| Param | Original file | Final file |
|---|---|---|
| Filename | modeM0/AS1A12_044T19_9000005600_41102cztM0_level2.fits | modeM0/AS1A12_044T19_9000005600_41102cztM0_level2_quad_clean.evt |
| Size (bytes) | 323,377,920 | 92,445,120 |
| Size | 308.4 MB | 88.2 MB |
| Events in quadrant A | 2,983,376 | 624,574 |
| Events in quadrant B | 3,065,688 | 628,485 |
| Events in quadrant C | 2,805,439 | 597,057 |
| Events in quadrant D | 2,680,635 | 557,720 |
| Mode SS | |||
|---|---|---|---|
| Quadrant | BADHDUFLAG | Total packets | Discarded packets |
| A | 0 | 116 | 0 |
| B | 0 | 116 | 0 |
| C | 0 | 116 | 0 |
| D | 0 | 116 | 0 |
| Mode M0 | |||
|---|---|---|---|
| Quadrant | BADHDUFLAG | Total packets | Discarded packets |
| A | 0 | 12233 | 3 |
| B | 0 | 12941 | 2 |
| C | 0 | 11870 | 2 |
| D | 0 | 11970 | 2 |
| Mode M9 | |||
|---|---|---|---|
| Quadrant | BADHDUFLAG | Total packets | Discarded packets |
| A | 0 | 18 | 0 |
| B | 0 | 18 | 0 |
| C | 0 | 18 | 0 |
| D | 0 | 19 | 0 |
| Quadrant | Total seconds | Saturated seconds | Saturation percentage |
|---|---|---|---|
| A | 5587 | 17 | 0.304278% |
| B | 5587 | 102 | 1.825667% |
| C | 5587 | 35 | 0.626454% |
| D | 5587 | 36 | 0.644353% |
Noise dominated data is calculated using 1-second bins in cleaned event files. If a bin has >2000 counts, and if more than 50% of those come from <1% of pixels, then it is considered to be noise-dominated and hence unusable.
| Quadrant | # 1 sec bins | Bins with >0 counts | Bins with >2000 counts | High rate bins dominated by noise | Noise dominated (total time) | Noise dominated (detector-on time) | Marked lightcurve |
|---|---|---|---|---|---|---|---|
| A | 7049 | 5588 | 4 | 4 | 0.06% | 0.07% | 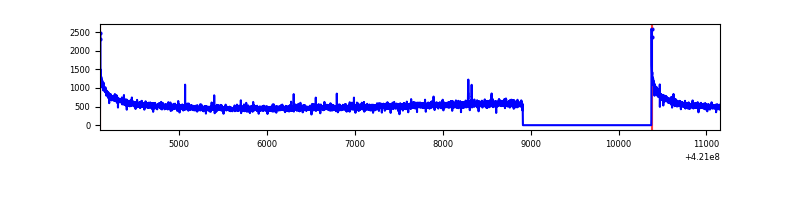 |
| B | 7049 | 5588 | 63 | 63 | 0.89% | 1.13% | 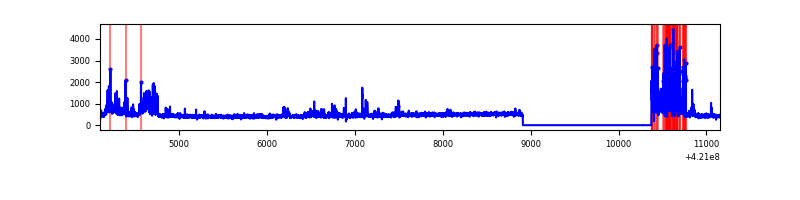 |
| C | 7049 | 5588 | 28 | 28 | 0.40% | 0.50% | 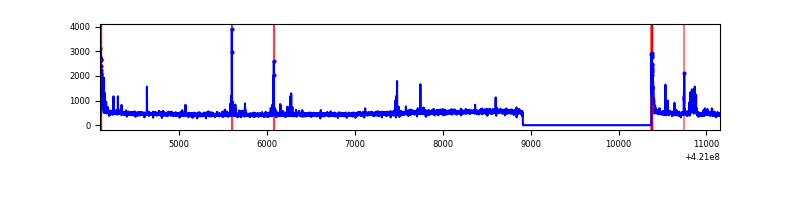 |
| D | 7049 | 5588 | 23 | 23 | 0.33% | 0.41% | 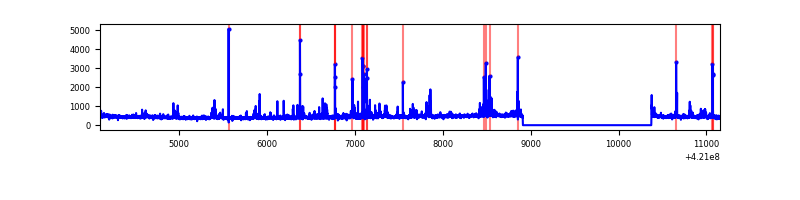 |
Top three noisy pixels from each quadrant. If the there are fewer than three noisy pixels in the level2.evt file, extra rows are filled as -1
| Pixel properties | Quadrant properties | ||||||
|---|---|---|---|---|---|---|---|
| Quadrant | DetID | PixID | Counts | Sigma | Mean | Median | Sigma |
| A | 10 | 83 | 544059 | 4211.3 | 625 | 614 | 129.0 |
| A | 2 | 79 | 10248 | 74.66 | 625 | 614 | 129.0 |
| A | 13 | 254 | 9813 | 71.29 | 625 | 614 | 129.0 |
| B | 0 | 186 | 407273 | 3355.44 | 617 | 600 | 121.2 |
| B | 15 | 85 | 95861 | 785.99 | 617 | 600 | 121.2 |
| B | 0 | 190 | 84224 | 689.98 | 617 | 600 | 121.2 |
| C | 15 | 214 | 239649 | 1682.26 | 602 | 605 | 142.1 |
| C | 0 | 10 | 99219 | 693.99 | 602 | 605 | 142.1 |
| C | 14 | 254 | 63081 | 439.67 | 602 | 605 | 142.1 |
| D | 2 | 249 | 122945 | 814.98 | 603 | 584 | 150.1 |
| D | 13 | 249 | 84561 | 559.33 | 603 | 584 | 150.1 |
| D | 9 | 19 | 57629 | 379.95 | 603 | 584 | 150.1 |
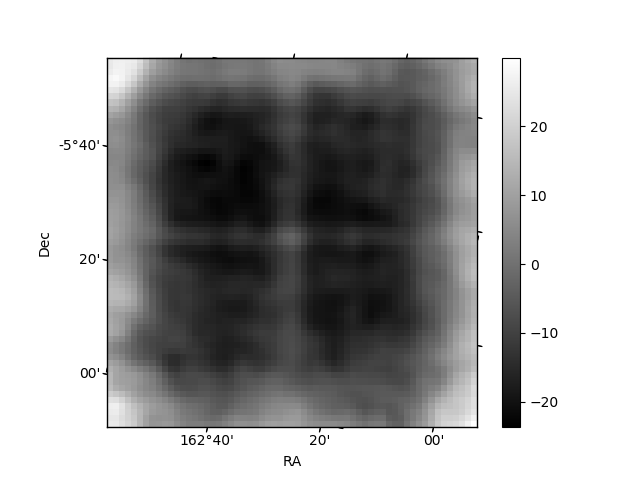
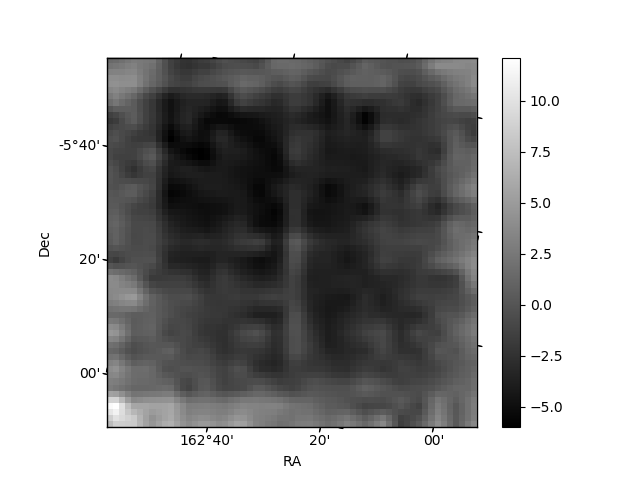
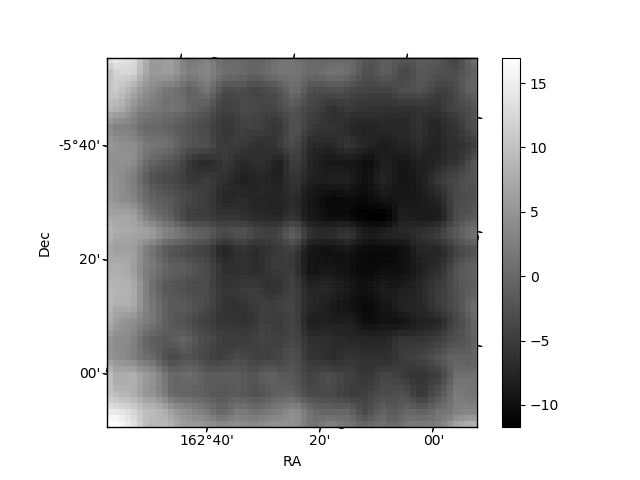
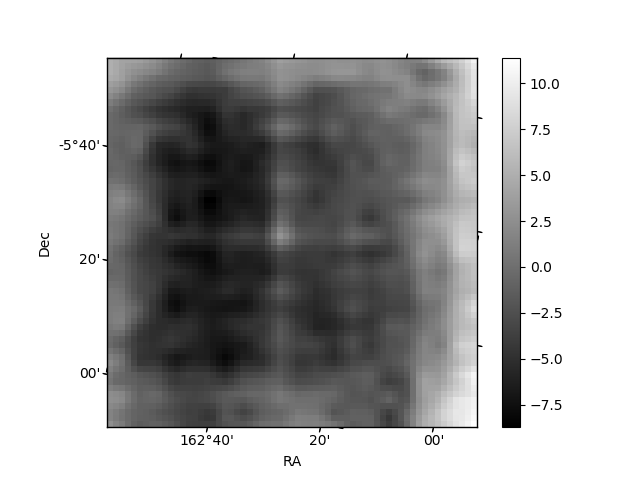
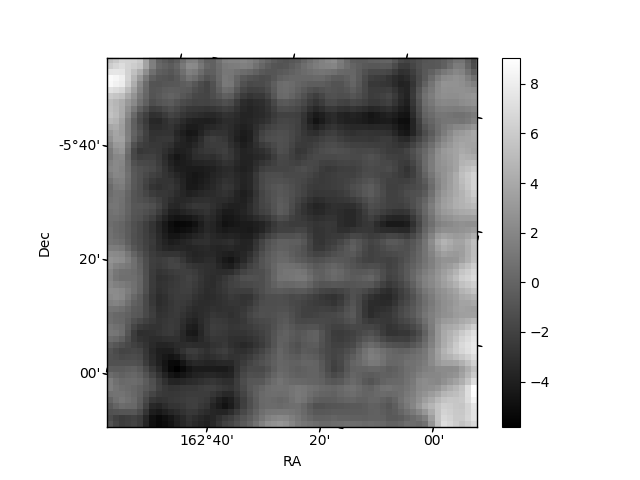
Histogram calculated using DETX and DETY for each event in the final _common_clean file
| Quadrant A | 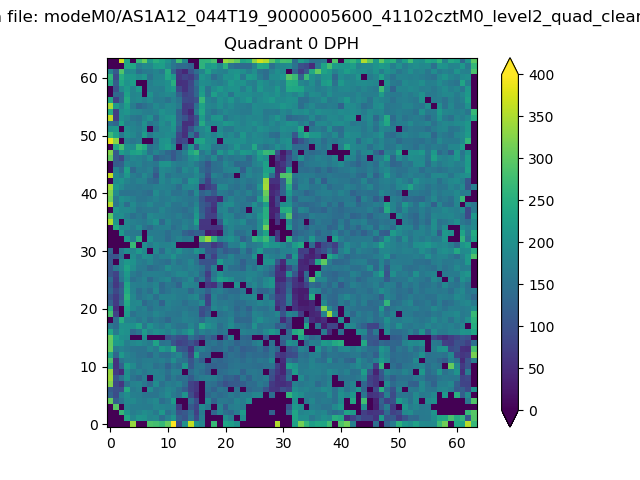 |
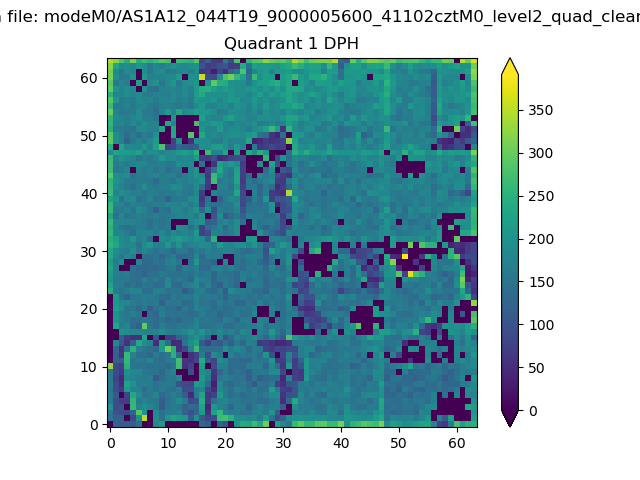 |
Quadrant B |
|---|---|---|---|
| Quadrant D | 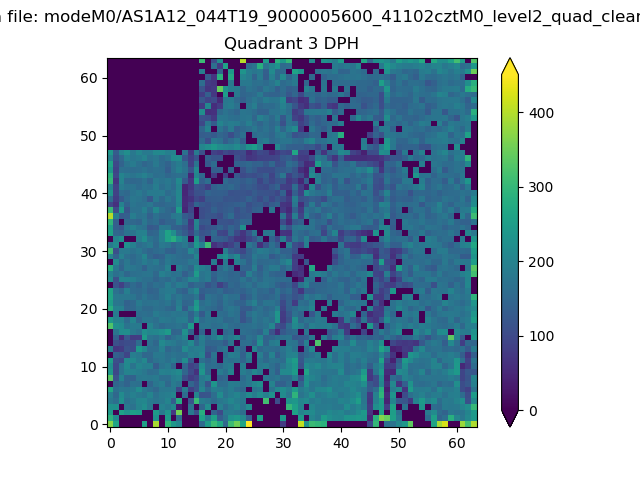 |
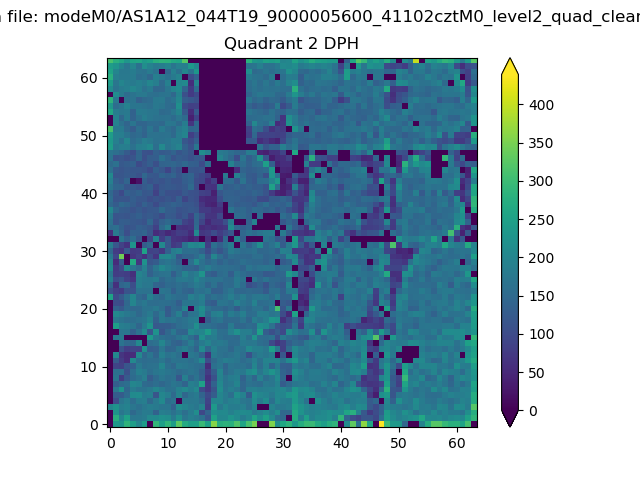 |
Quadrant C |
| Plot type | Count rate plots | Images |
|---|---|---|
| Comparison with Poisson distribution Blue bars denote a histogram of data divided into 1 sec bins. Red curve is a Poisson curve with rate = median count rate of data. |
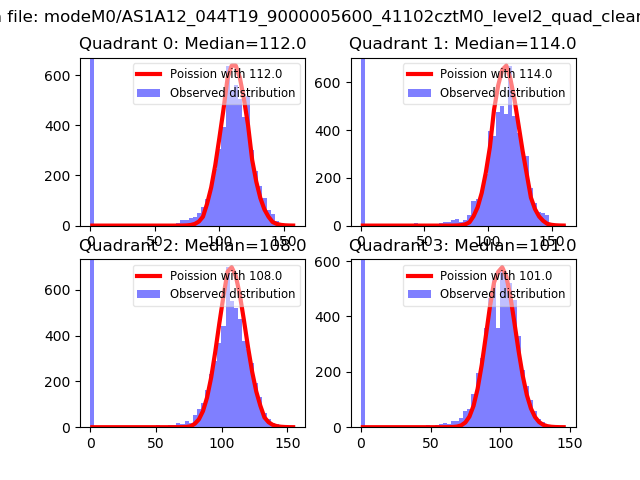 |
 |
| Quadrant-wise count rates Data is divided into 100 sec bins |
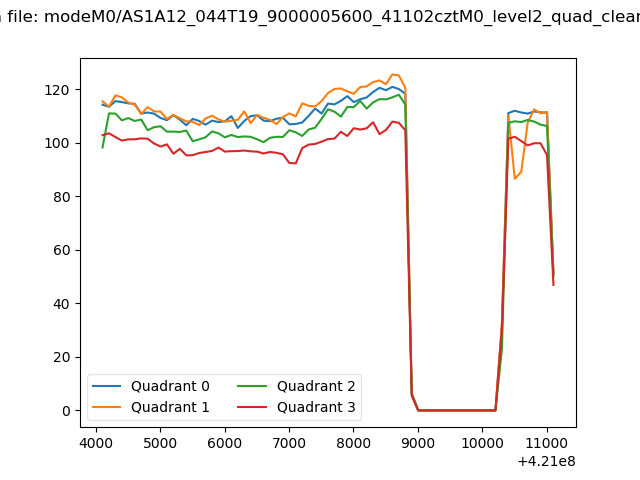 |
|
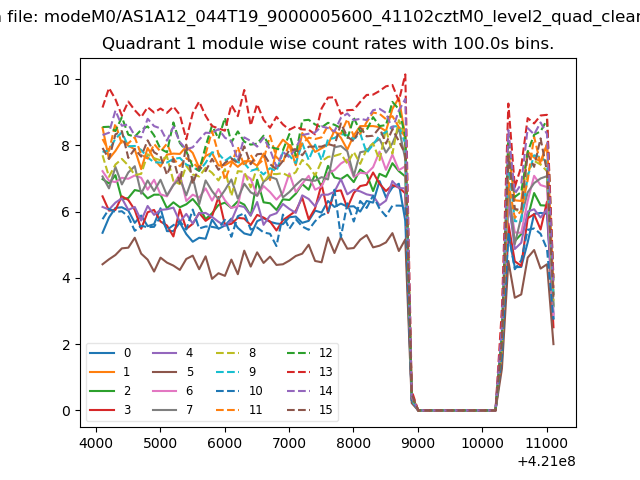
| Module-wise count rates for Quadrant A Data is divided into 100 sec bins |
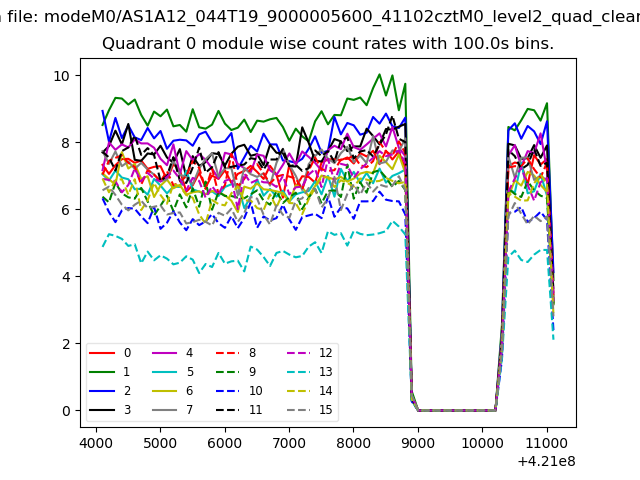 |
 |
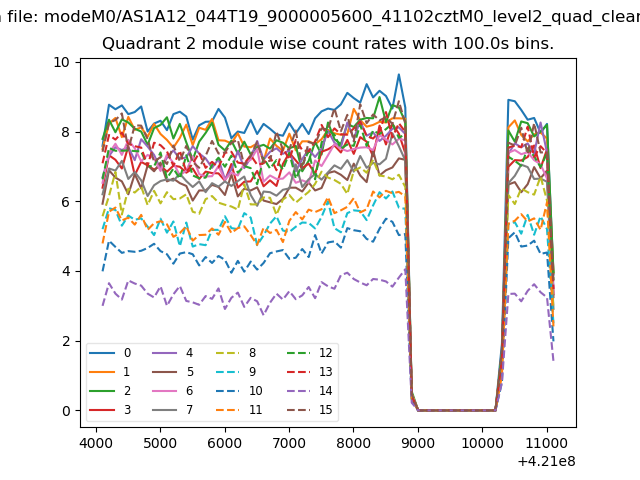
| Module-wise count rates for Quadrant B Data is divided into 100 sec bins |
 |
 |
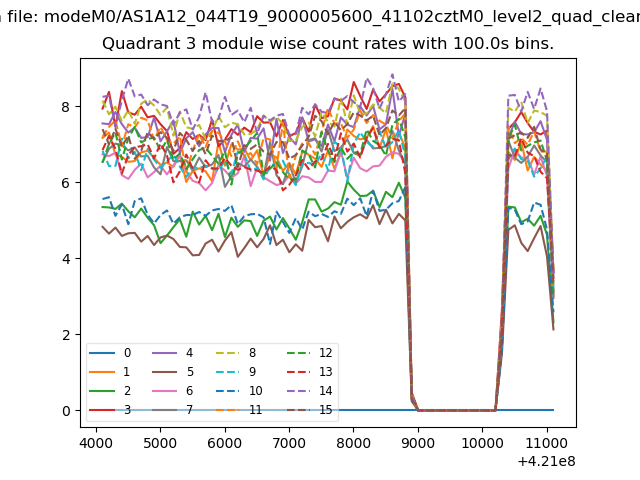
| Module-wise count rates for Quadrant C Data is divided into 100 sec bins |
 |
 |
| Module-wise count rates for Quadrant D Data is divided into 100 sec bins |
 |
 |
| Parameter | Plot |
|---|---|
| CZT HV Monitor | 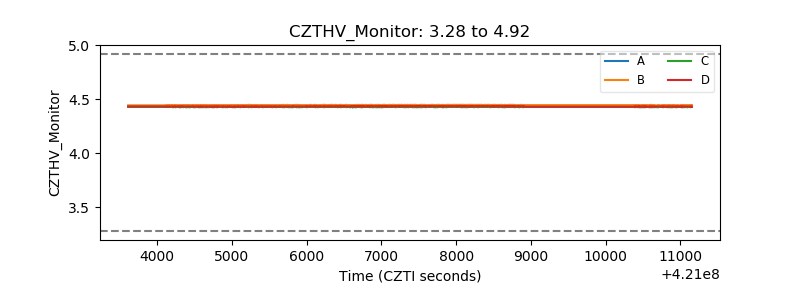 |
| D_VDD | 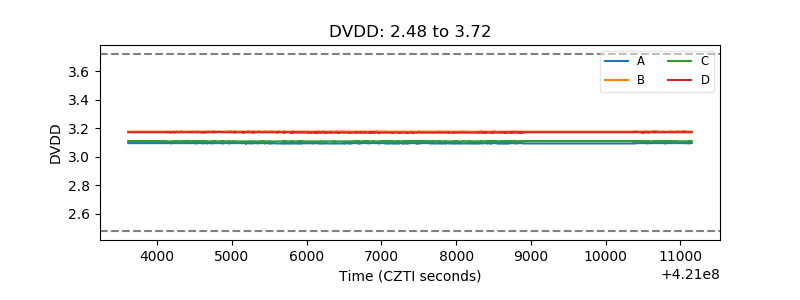 |
| Temperature 1 | 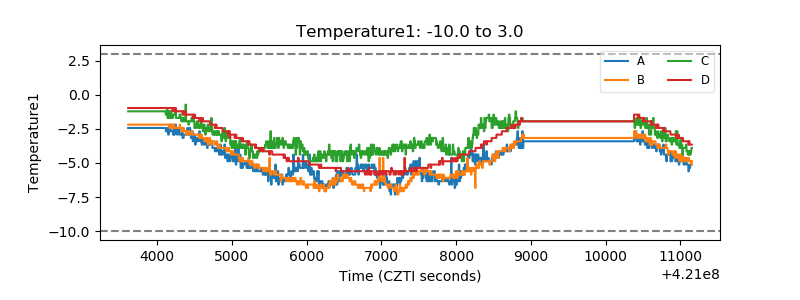 |
| Veto HV Monitor | 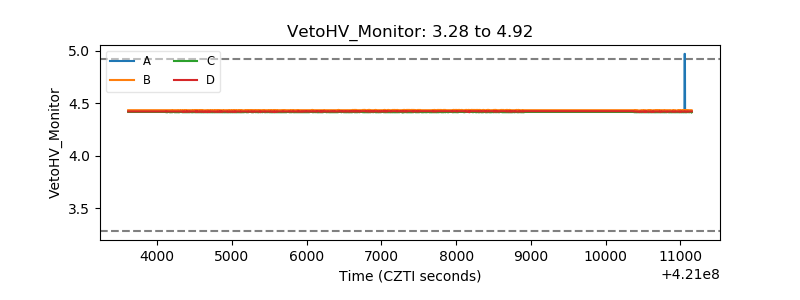 |
| Veto LLD | 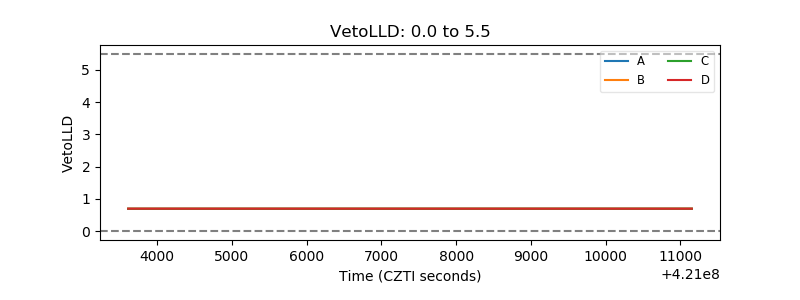 |
| Alpha Counter | 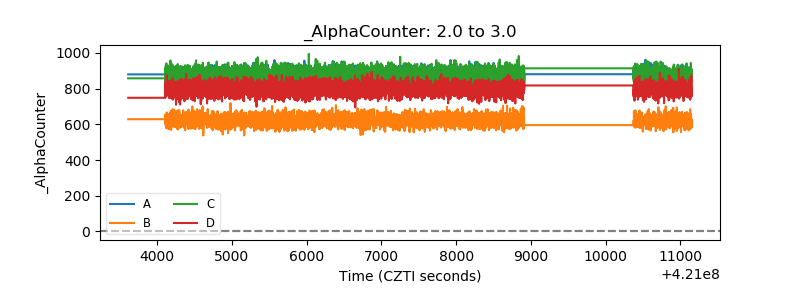 |
| _CPM_Rate | 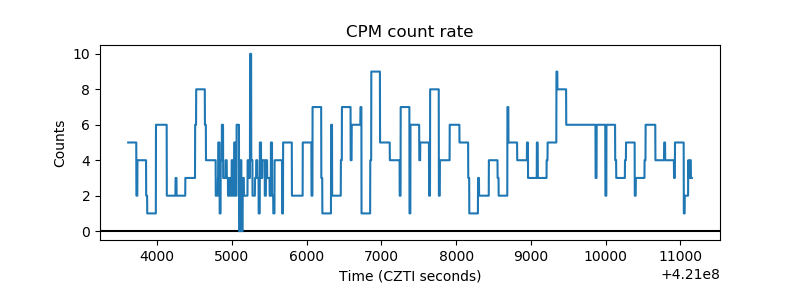 |
| CZT Counter | 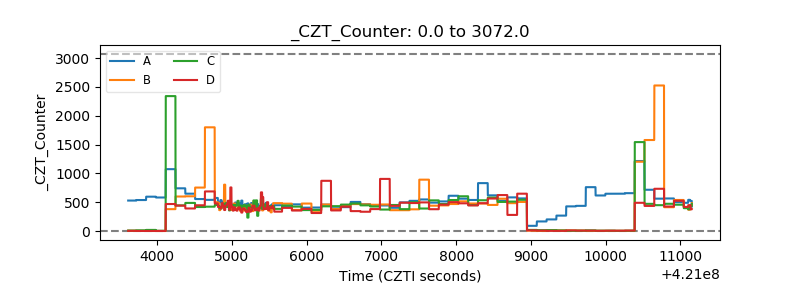 |
| +2.5 Volts monitor | 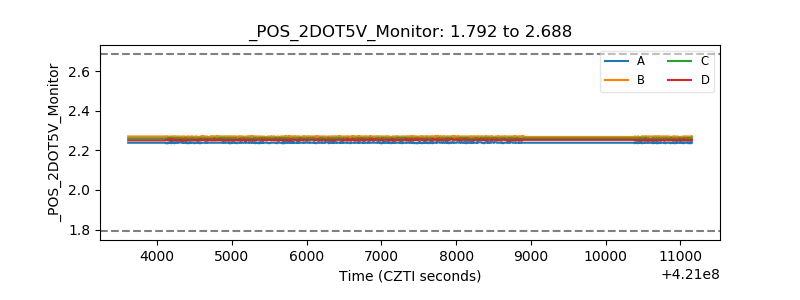 |
| +5 Volts monitor | 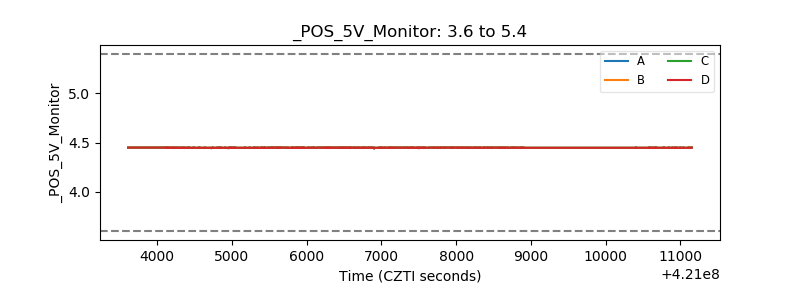 |
| _ROLL_ROT | 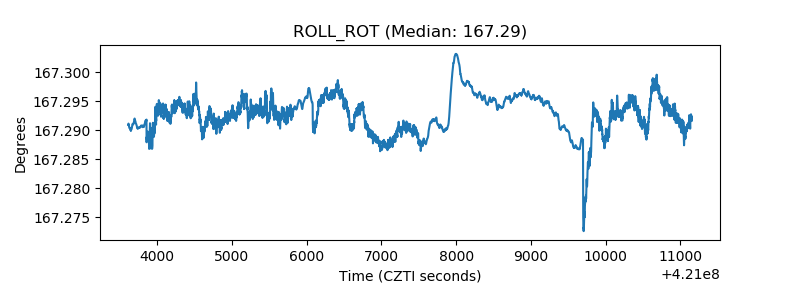 |
| _Roll_DEC | 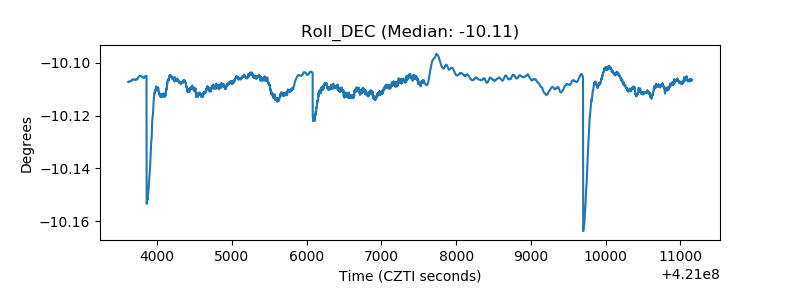 |
| _Roll_RA | 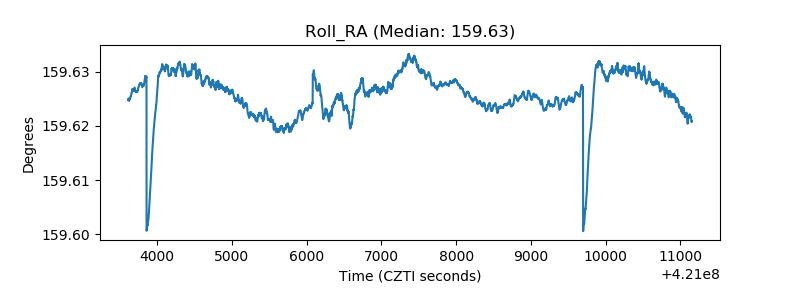 |
| Veto Counter | 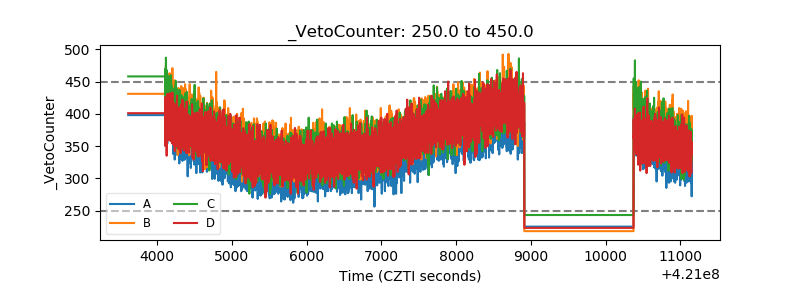 |