| Param | Original file | Final file |
|---|---|---|
| Filename | modeM0/AS1A12_044T19_9000005600_41103cztM0_level2.fits | modeM0/AS1A12_044T19_9000005600_41103cztM0_level2_quad_clean.evt |
| Size (bytes) | 371,355,840 | 93,536,640 |
| Size | 354.2 MB | 89.2 MB |
| Events in quadrant A | 3,104,452 | 639,584 |
| Events in quadrant B | 3,131,257 | 645,562 |
| Events in quadrant C | 3,243,295 | 610,454 |
| Events in quadrant D | 3,815,614 | 531,440 |
| Mode SS | |||
|---|---|---|---|
| Quadrant | BADHDUFLAG | Total packets | Discarded packets |
| A | 0 | 116 | 0 |
| B | 0 | 116 | 0 |
| C | 0 | 116 | 0 |
| D | 0 | 116 | 0 |
| Mode M0 | |||
|---|---|---|---|
| Quadrant | BADHDUFLAG | Total packets | Discarded packets |
| A | 0 | 12763 | 3 |
| B | 0 | 13242 | 2 |
| C | 0 | 13311 | 2 |
| D | 0 | 15516 | 2 |
| Mode M9 | |||
|---|---|---|---|
| Quadrant | BADHDUFLAG | Total packets | Discarded packets |
| A | 0 | 22 | 0 |
| B | 0 | 22 | 0 |
| C | 0 | 22 | 0 |
| D | 0 | 23 | 0 |
| Quadrant | Total seconds | Saturated seconds | Saturation percentage |
|---|---|---|---|
| A | 5800 | 18 | 0.310345% |
| B | 5800 | 123 | 2.120690% |
| C | 5800 | 96 | 1.655172% |
| D | 5800 | 464 | 8.000000% |
Noise dominated data is calculated using 1-second bins in cleaned event files. If a bin has >2000 counts, and if more than 50% of those come from <1% of pixels, then it is considered to be noise-dominated and hence unusable.
| Quadrant | # 1 sec bins | Bins with >0 counts | Bins with >2000 counts | High rate bins dominated by noise | Noise dominated (total time) | Noise dominated (detector-on time) | Marked lightcurve |
|---|---|---|---|---|---|---|---|
| A | 7113 | 5801 | 3 | 3 | 0.04% | 0.05% | 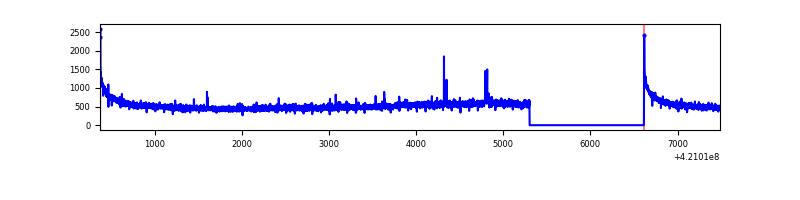 |
| B | 7113 | 5801 | 87 | 87 | 1.22% | 1.50% | 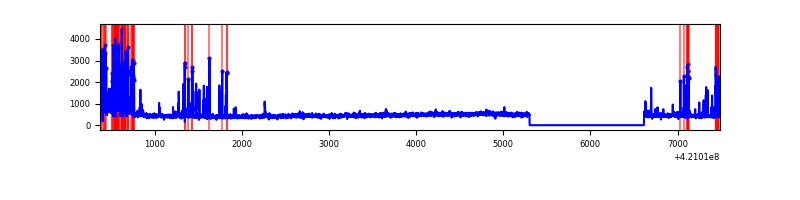 |
| C | 7113 | 5801 | 88 | 88 | 1.24% | 1.52% | 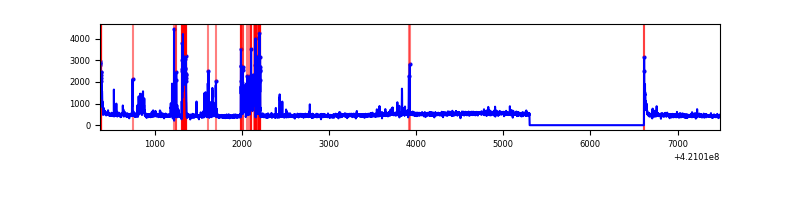 |
| D | 7113 | 5801 | 382 | 382 | 5.37% | 6.59% | 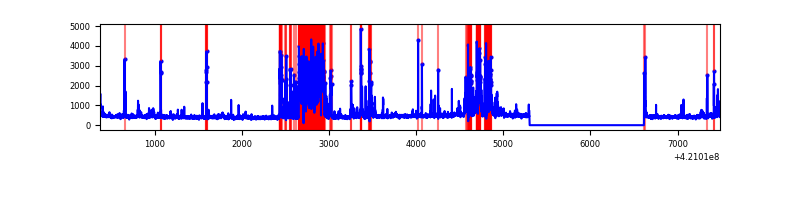 |
Top three noisy pixels from each quadrant. If the there are fewer than three noisy pixels in the level2.evt file, extra rows are filled as -1
| Pixel properties | Quadrant properties | ||||||
|---|---|---|---|---|---|---|---|
| Quadrant | DetID | PixID | Counts | Sigma | Mean | Median | Sigma |
| A | 10 | 83 | 555057 | 4114.17 | 647 | 634 | 134.8 |
| A | 2 | 79 | 32219 | 234.38 | 647 | 634 | 134.8 |
| A | 13 | 254 | 10459 | 72.91 | 647 | 634 | 134.8 |
| B | 0 | 186 | 234888 | 1871.79 | 638 | 621 | 125.2 |
| B | 0 | 245 | 207119 | 1649.91 | 638 | 621 | 125.2 |
| B | 15 | 85 | 95870 | 761.04 | 638 | 621 | 125.2 |
| C | 15 | 159 | 291011 | 1975.59 | 623 | 624 | 147.0 |
| C | 15 | 214 | 247282 | 1678.09 | 623 | 624 | 147.0 |
| C | 14 | 254 | 194931 | 1321.93 | 623 | 624 | 147.0 |
| D | 2 | 249 | 1194435 | 7896.98 | 602 | 582 | 151.2 |
| D | 13 | 249 | 136590 | 899.65 | 602 | 582 | 151.2 |
| D | 6 | 239 | 85631 | 562.57 | 602 | 582 | 151.2 |
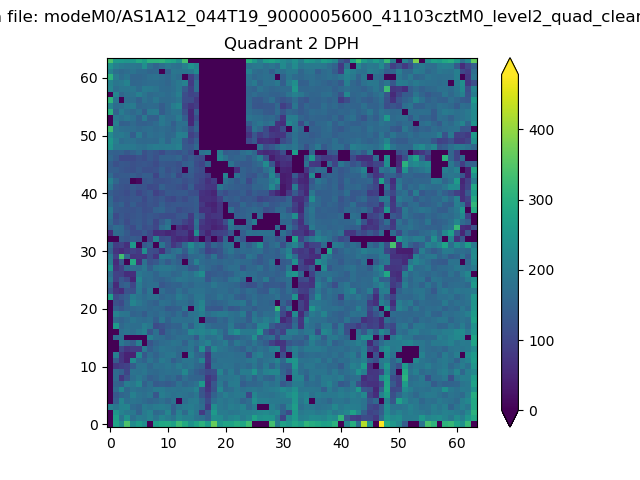
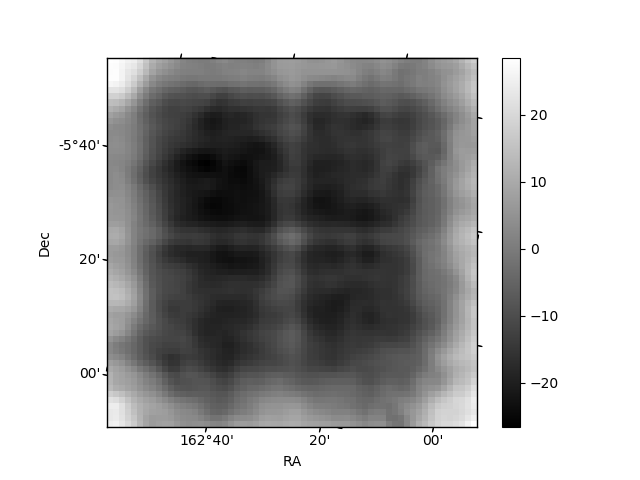
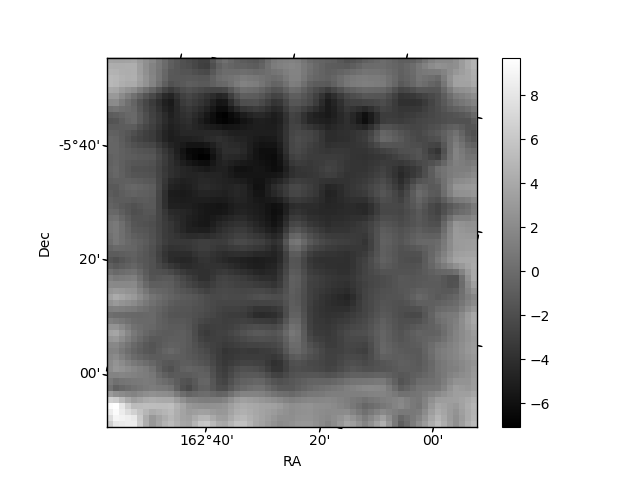
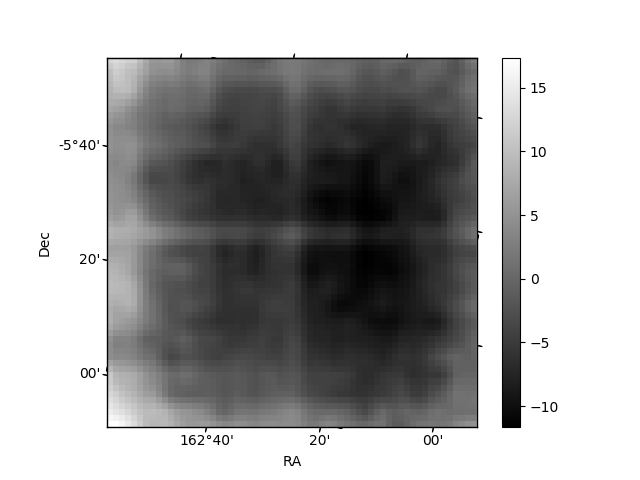
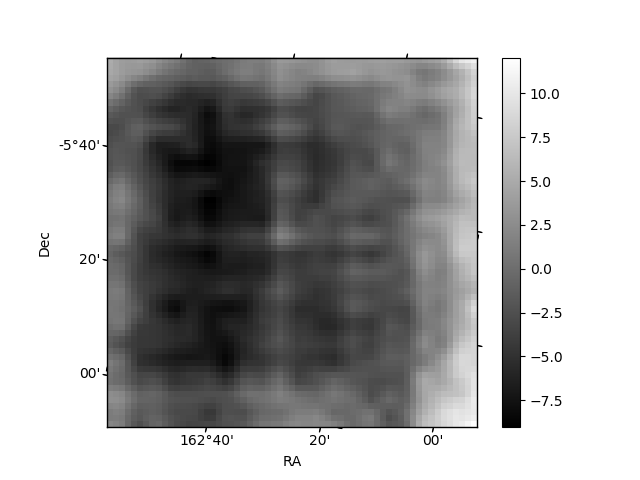
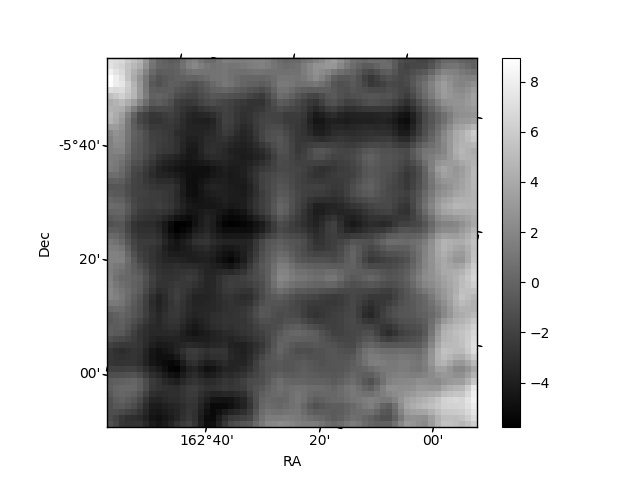
Histogram calculated using DETX and DETY for each event in the final _common_clean file
| Quadrant A | 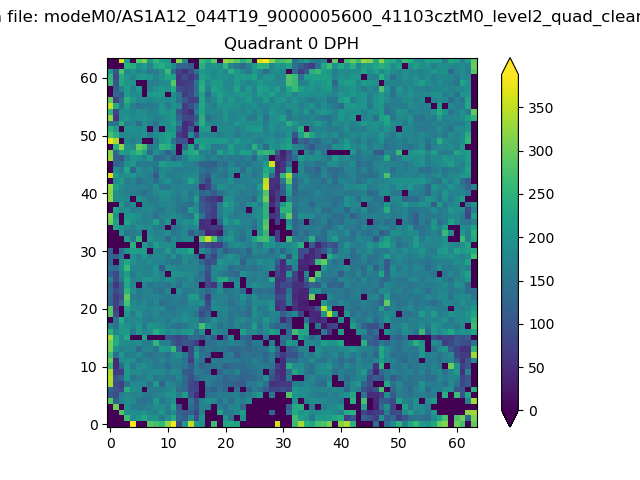 |
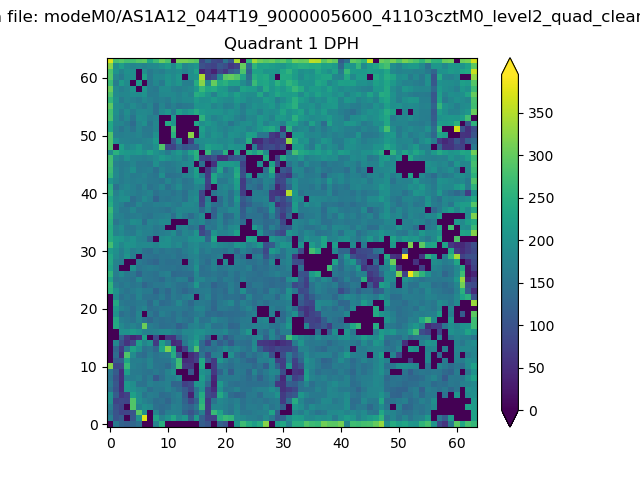 |
Quadrant B |
|---|---|---|---|
| Quadrant D | 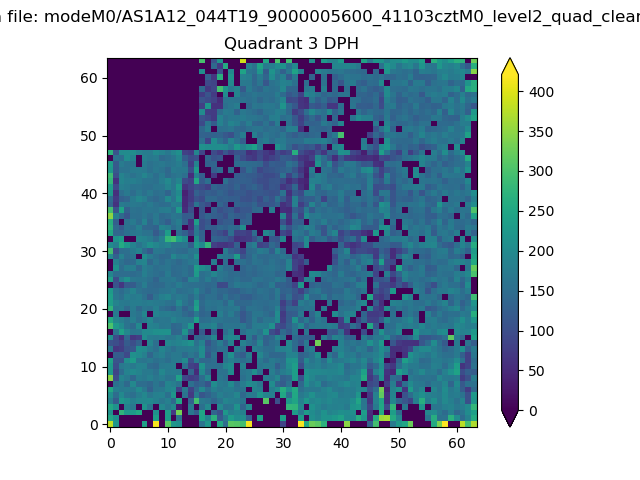 |
 |
Quadrant C |
| Plot type | Count rate plots | Images |
|---|---|---|
| Comparison with Poisson distribution Blue bars denote a histogram of data divided into 1 sec bins. Red curve is a Poisson curve with rate = median count rate of data. |
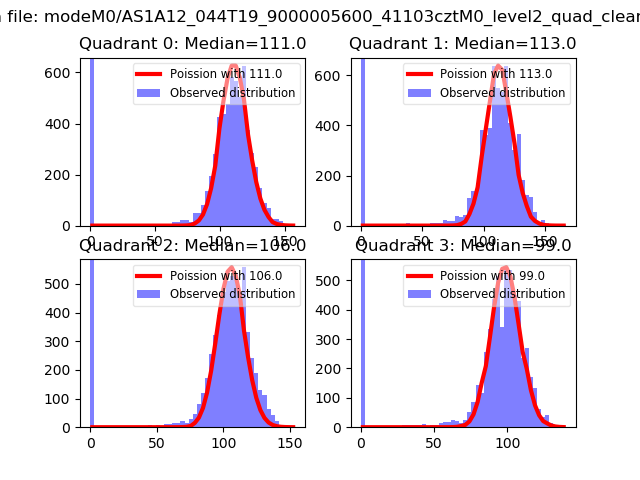 |
 |
| Quadrant-wise count rates Data is divided into 100 sec bins |
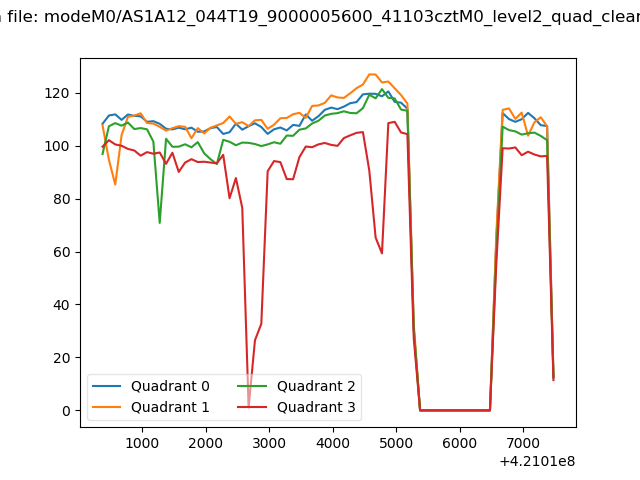 |
|
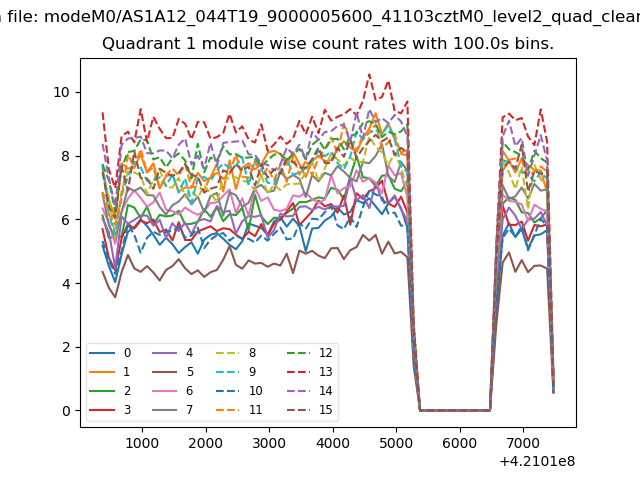
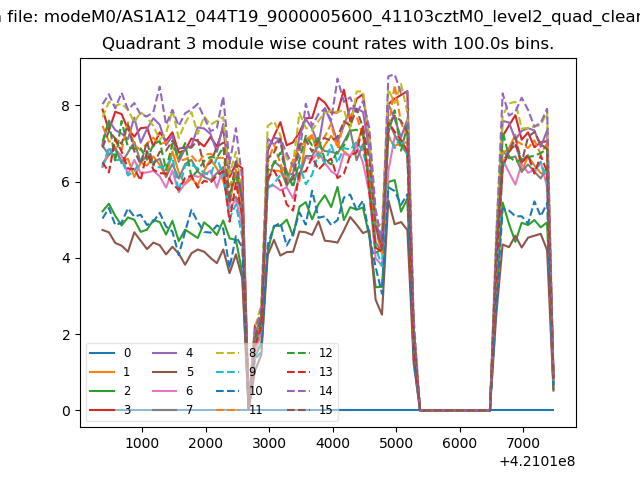
| Module-wise count rates for Quadrant A Data is divided into 100 sec bins |
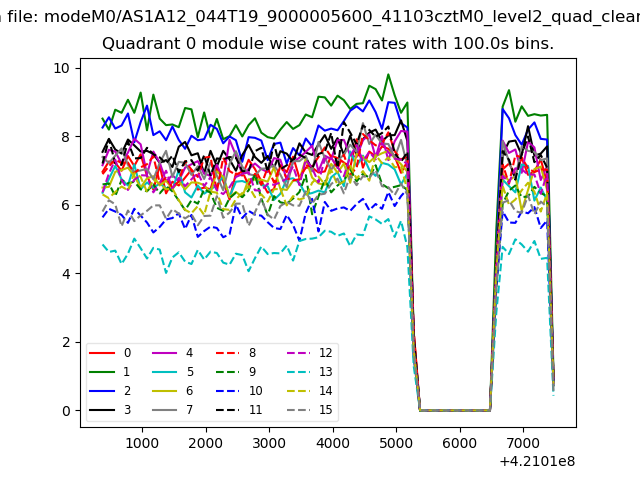 |
 |
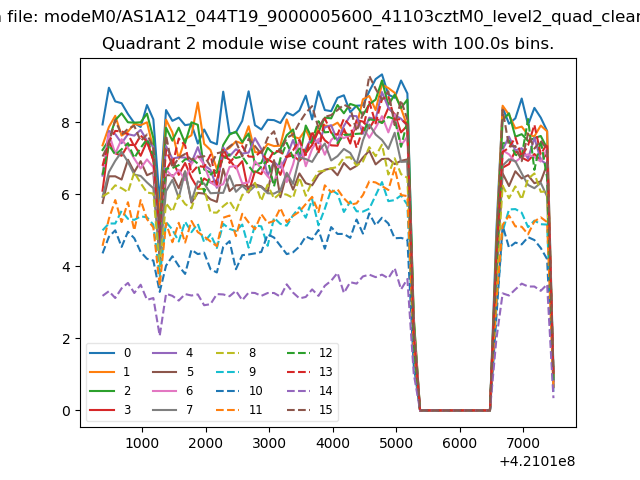
| Module-wise count rates for Quadrant B Data is divided into 100 sec bins |
 |
 |
| Module-wise count rates for Quadrant C Data is divided into 100 sec bins |
 |
 |
| Module-wise count rates for Quadrant D Data is divided into 100 sec bins |
 |
 |
| Parameter | Plot |
|---|---|
| CZT HV Monitor | 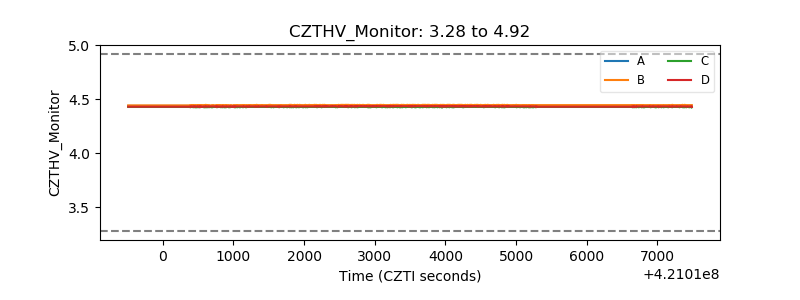 |
| D_VDD | 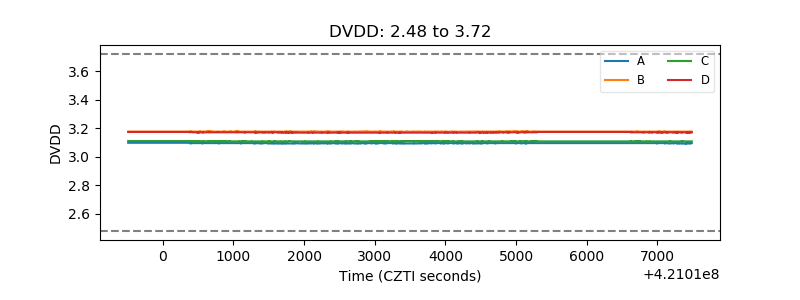 |
| Temperature 1 | 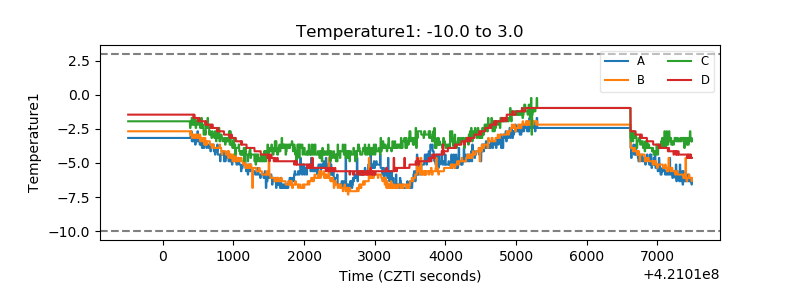 |
| Veto HV Monitor | 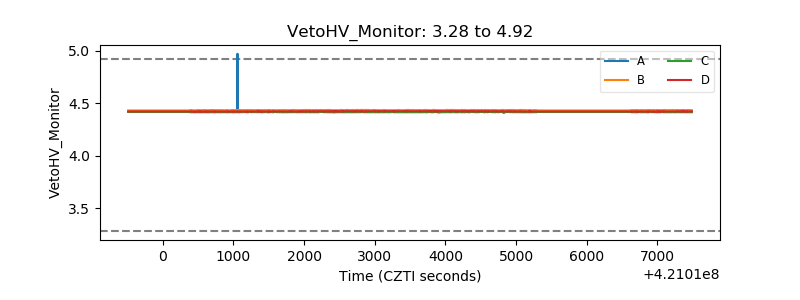 |
| Veto LLD | 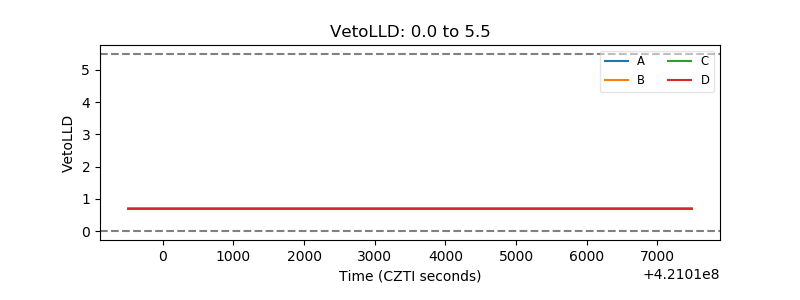 |
| Alpha Counter | 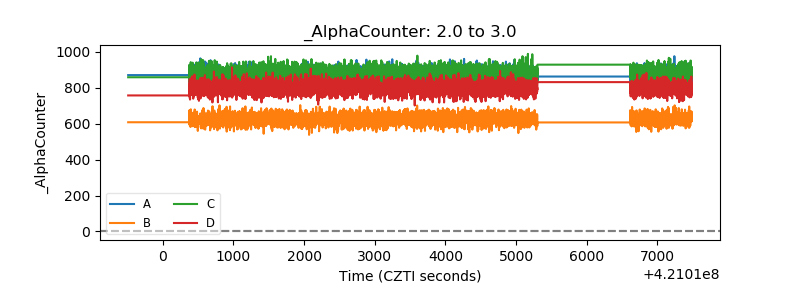 |
| _CPM_Rate | 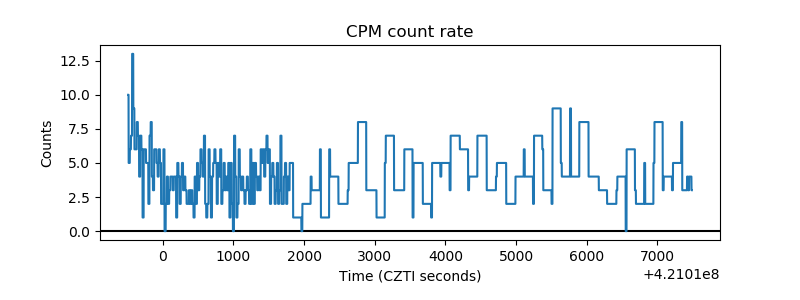 |
| CZT Counter | 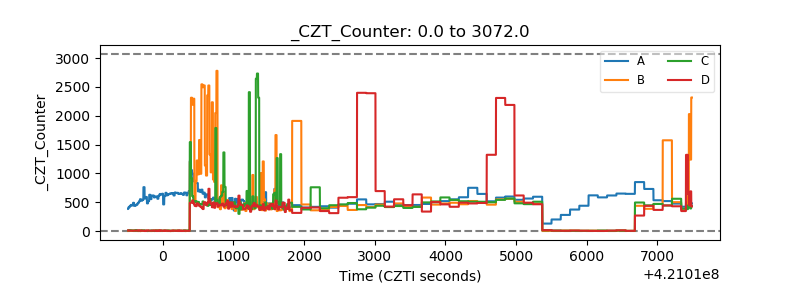 |
| +2.5 Volts monitor | 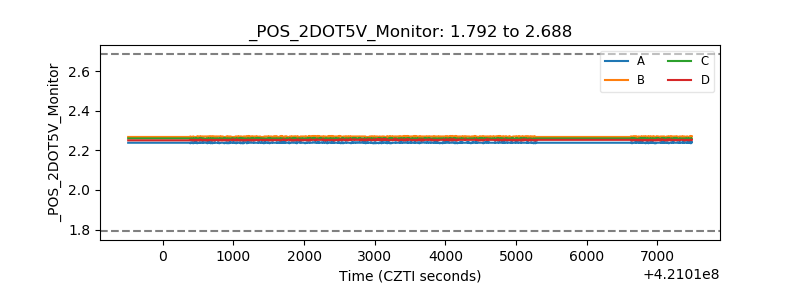 |
| +5 Volts monitor | 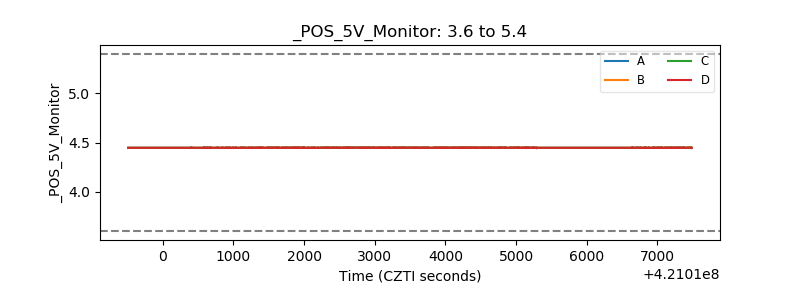 |
| _ROLL_ROT | 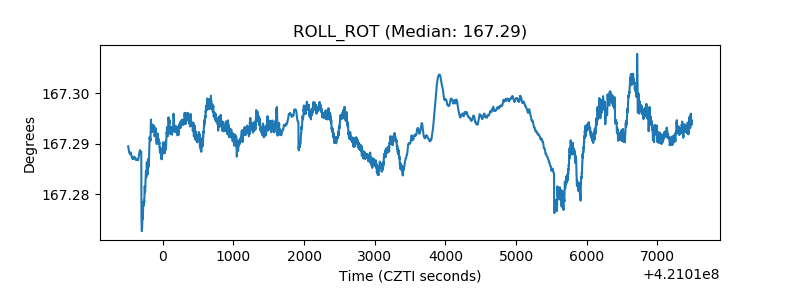 |
| _Roll_DEC | 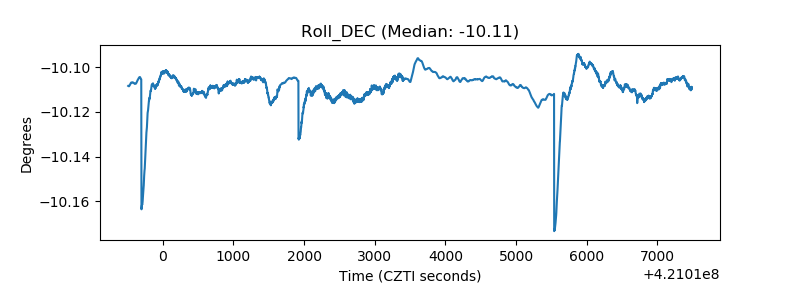 |
| _Roll_RA | 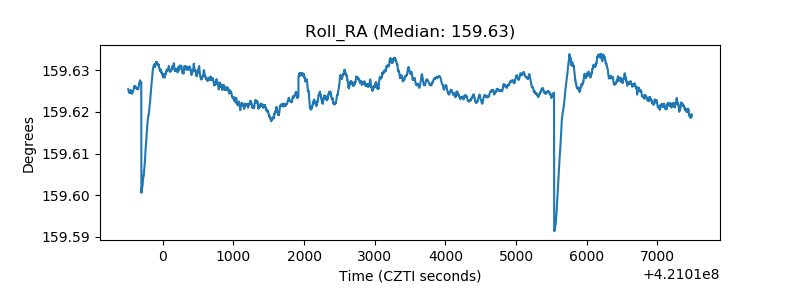 |
| Veto Counter | 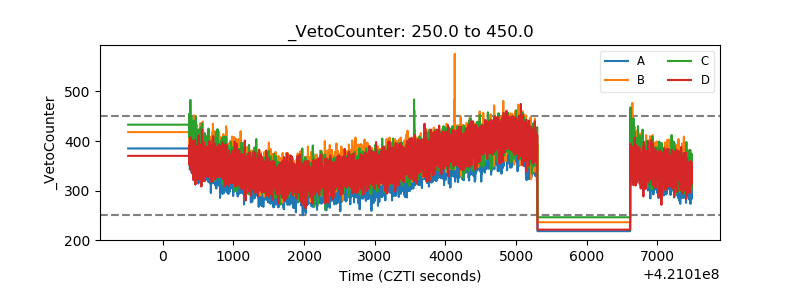 |