| Param | Original file | Final file |
|---|---|---|
| Filename | modeM0/AS1A12_044T19_9000005600_41104cztM0_level2.fits | modeM0/AS1A12_044T19_9000005600_41104cztM0_level2_quad_clean.evt |
| Size (bytes) | 295,660,800 | 82,175,040 |
| Size | 282.0 MB | 78.4 MB |
| Events in quadrant A | 2,699,538 | 553,692 |
| Events in quadrant B | 2,800,306 | 562,500 |
| Events in quadrant C | 2,608,535 | 525,439 |
| Events in quadrant D | 2,443,828 | 494,134 |
| Mode SS | |||
|---|---|---|---|
| Quadrant | BADHDUFLAG | Total packets | Discarded packets |
| A | 0 | 102 | 0 |
| B | 0 | 102 | 0 |
| C | 0 | 102 | 0 |
| D | 0 | 102 | 0 |
| Mode M0 | |||
|---|---|---|---|
| Quadrant | BADHDUFLAG | Total packets | Discarded packets |
| A | 0 | 11123 | 3 |
| B | 0 | 11699 | 2 |
| C | 0 | 10961 | 2 |
| D | 0 | 10932 | 2 |
| Mode M9 | |||
|---|---|---|---|
| Quadrant | BADHDUFLAG | Total packets | Discarded packets |
| A | 0 | 25 | 0 |
| B | 0 | 25 | 0 |
| C | 0 | 25 | 0 |
| D | 0 | 26 | 0 |
| Quadrant | Total seconds | Saturated seconds | Saturation percentage |
|---|---|---|---|
| A | 5029 | 12 | 0.238616% |
| B | 5029 | 63 | 1.252734% |
| C | 5029 | 62 | 1.232849% |
| D | 5029 | 51 | 1.014118% |
Noise dominated data is calculated using 1-second bins in cleaned event files. If a bin has >2000 counts, and if more than 50% of those come from <1% of pixels, then it is considered to be noise-dominated and hence unusable.
| Quadrant | # 1 sec bins | Bins with >0 counts | Bins with >2000 counts | High rate bins dominated by noise | Noise dominated (total time) | Noise dominated (detector-on time) | Marked lightcurve |
|---|---|---|---|---|---|---|---|
| A | 6312 | 5030 | 4 | 4 | 0.06% | 0.08% | 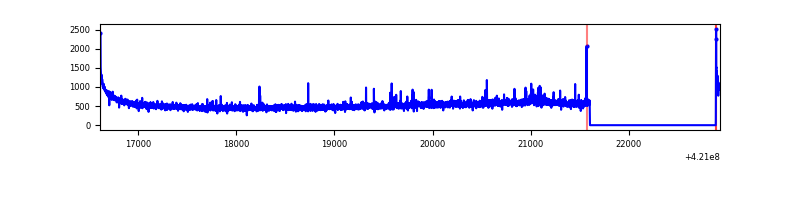 |
| B | 6312 | 5030 | 47 | 47 | 0.74% | 0.93% | 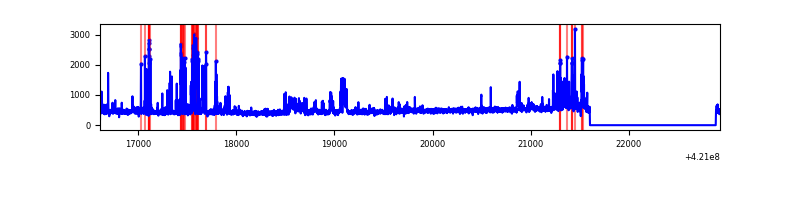 |
| C | 6312 | 5030 | 50 | 50 | 0.79% | 0.99% | 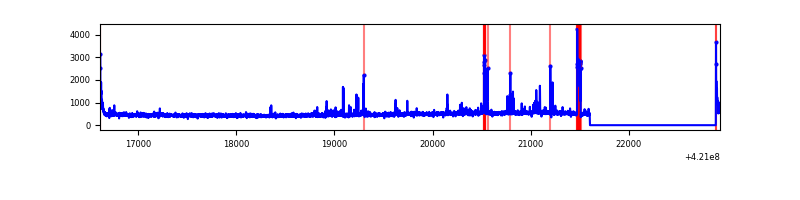 |
| D | 6312 | 5030 | 34 | 34 | 0.54% | 0.68% | 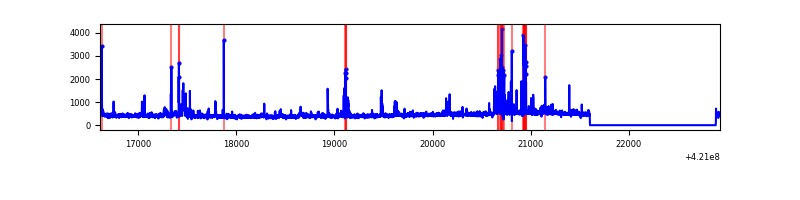 |
Top three noisy pixels from each quadrant. If the there are fewer than three noisy pixels in the level2.evt file, extra rows are filled as -1
| Pixel properties | Quadrant properties | ||||||
|---|---|---|---|---|---|---|---|
| Quadrant | DetID | PixID | Counts | Sigma | Mean | Median | Sigma |
| A | 10 | 83 | 437932 | 3676.68 | 568 | 556 | 119.0 |
| A | 13 | 248 | 34864 | 288.4 | 568 | 556 | 119.0 |
| A | 2 | 79 | 21458 | 175.71 | 568 | 556 | 119.0 |
| B | 0 | 245 | 442109 | 3937.92 | 561 | 543 | 112.1 |
| B | 0 | 186 | 107606 | 954.8 | 561 | 543 | 112.1 |
| B | 0 | 190 | 22587 | 196.59 | 561 | 543 | 112.1 |
| C | 15 | 214 | 210060 | 1623.05 | 545 | 548 | 129.1 |
| C | 14 | 254 | 191198 | 1476.93 | 545 | 548 | 129.1 |
| C | 0 | 10 | 54162 | 415.34 | 545 | 548 | 129.1 |
| D | 2 | 249 | 107418 | 785.32 | 547 | 529 | 136.1 |
| D | 13 | 249 | 80852 | 590.14 | 547 | 529 | 136.1 |
| D | 5 | 32 | 67081 | 488.96 | 547 | 529 | 136.1 |
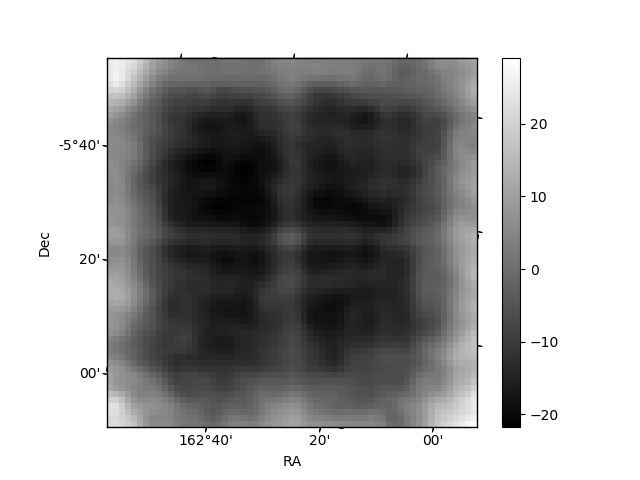
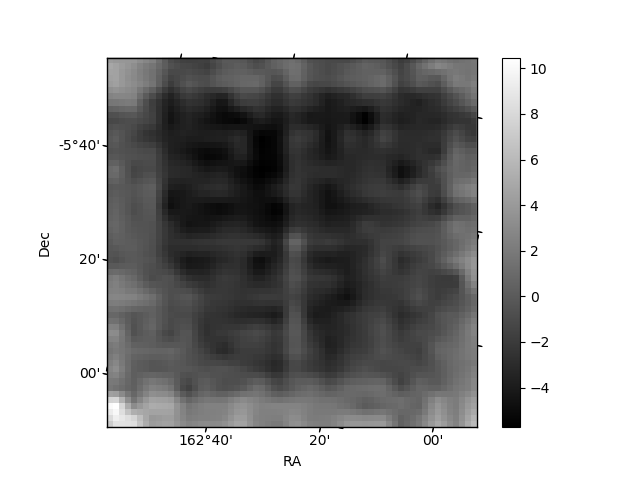
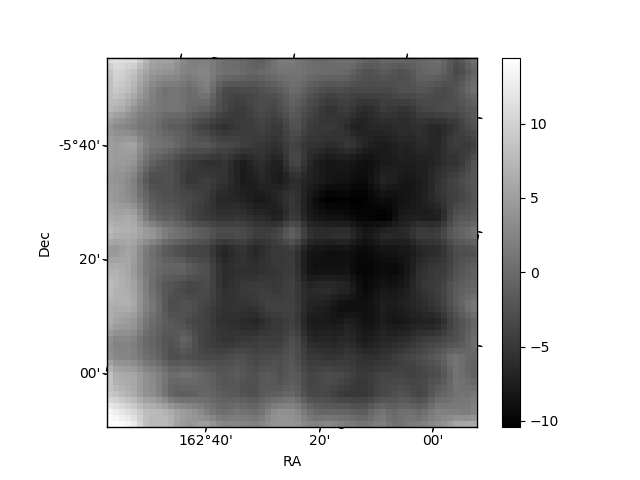
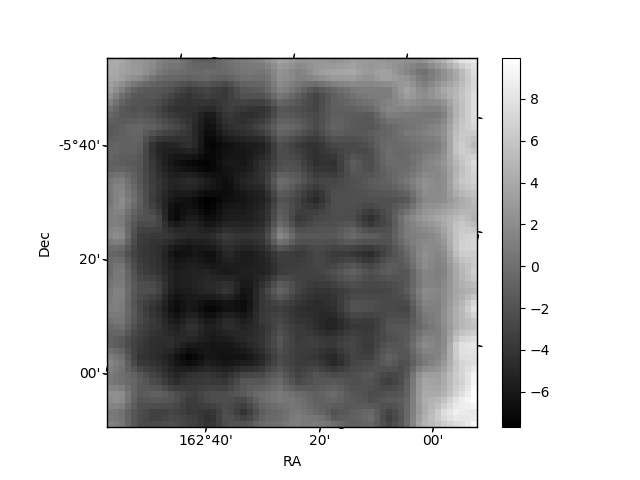
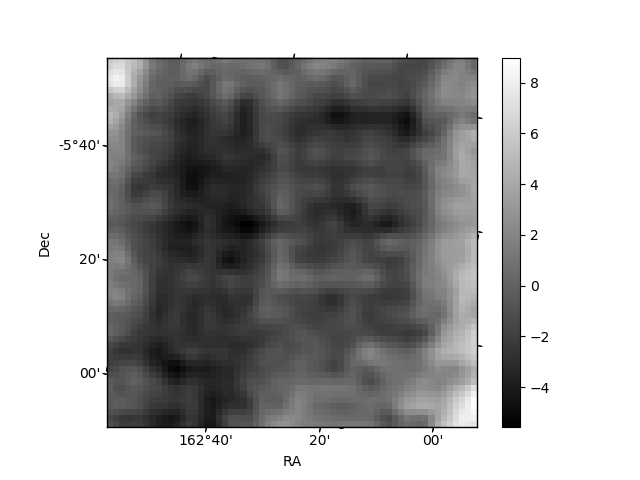
Histogram calculated using DETX and DETY for each event in the final _common_clean file
| Quadrant A | 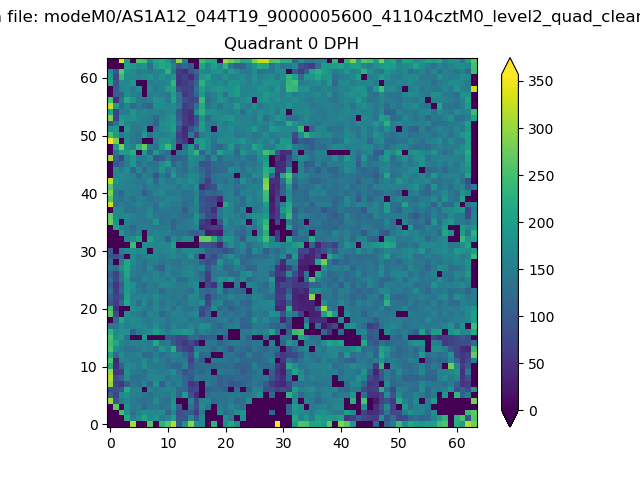 |
 |
Quadrant B |
|---|---|---|---|
| Quadrant D | 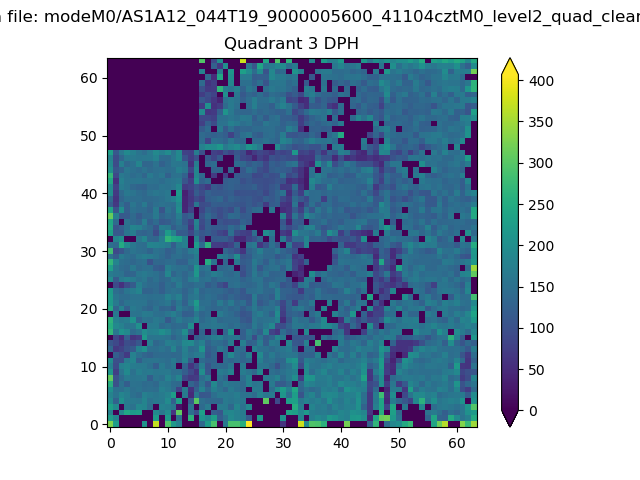 |
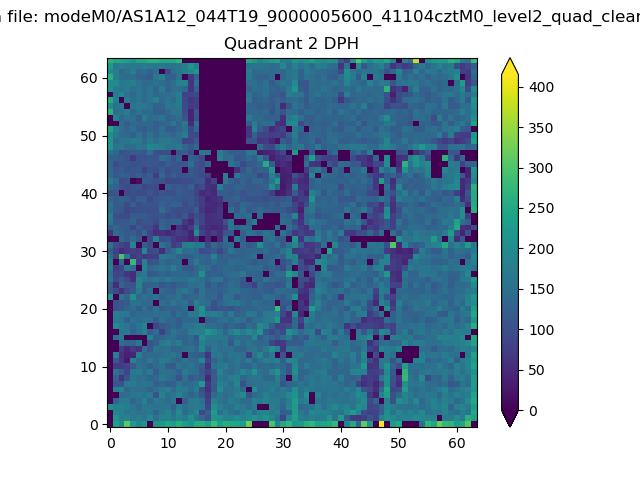 |
Quadrant C |
| Plot type | Count rate plots | Images |
|---|---|---|
| Comparison with Poisson distribution Blue bars denote a histogram of data divided into 1 sec bins. Red curve is a Poisson curve with rate = median count rate of data. |
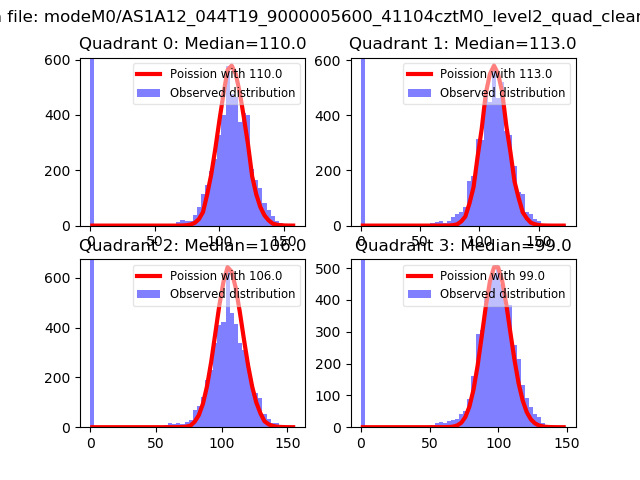 |
 |
| Quadrant-wise count rates Data is divided into 100 sec bins |
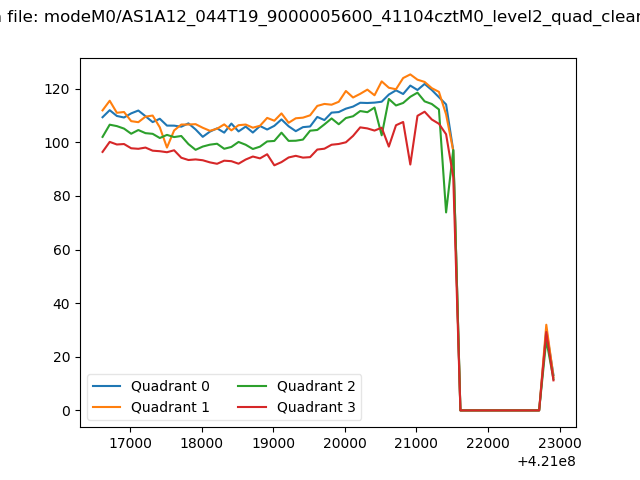 |
|
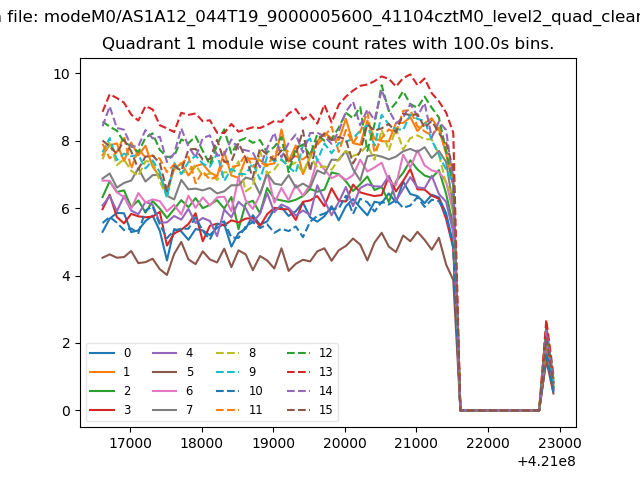
| Module-wise count rates for Quadrant A Data is divided into 100 sec bins |
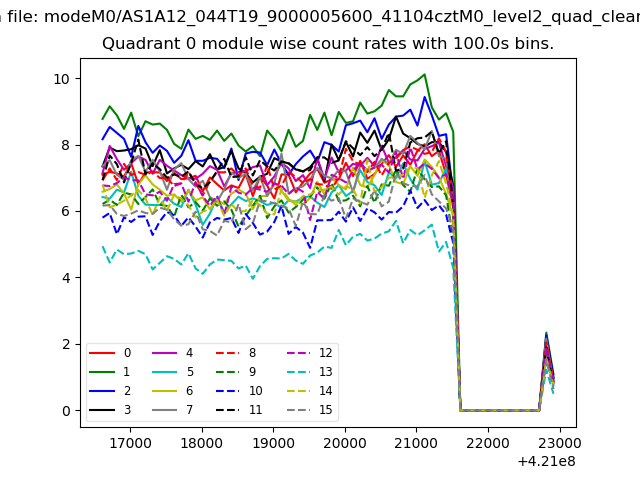 |
 |
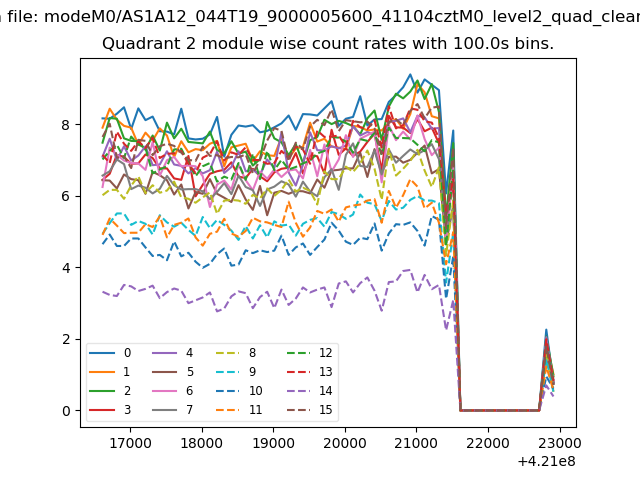
| Module-wise count rates for Quadrant B Data is divided into 100 sec bins |
 |
 |
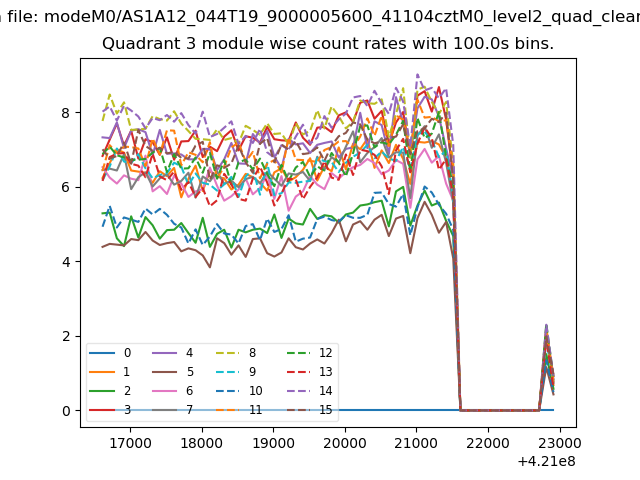
| Module-wise count rates for Quadrant C Data is divided into 100 sec bins |
 |
 |
| Module-wise count rates for Quadrant D Data is divided into 100 sec bins |
 |
 |
| Parameter | Plot |
|---|---|
| CZT HV Monitor | 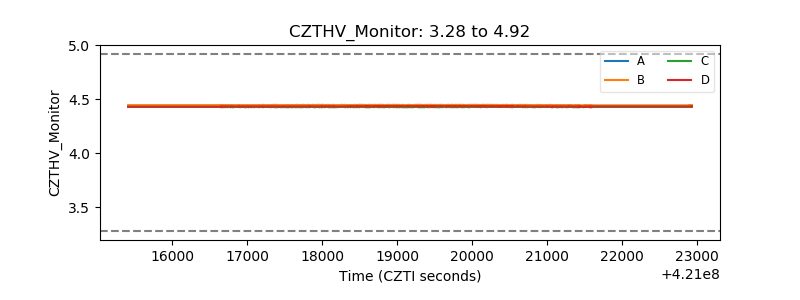 |
| D_VDD | 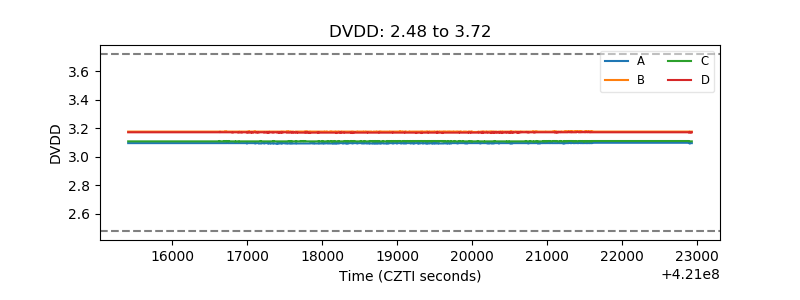 |
| Temperature 1 | 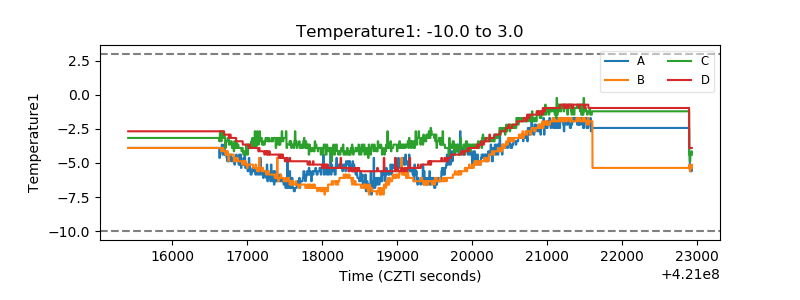 |
| Veto HV Monitor | 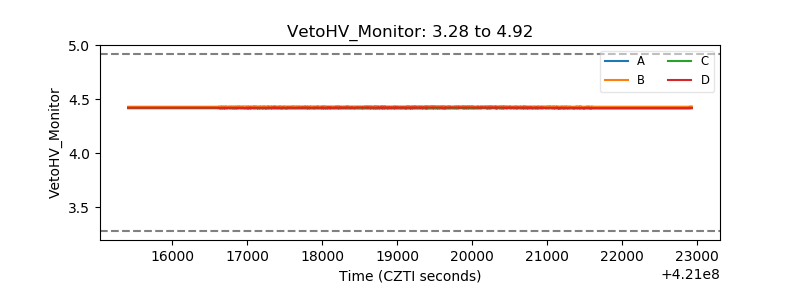 |
| Veto LLD | 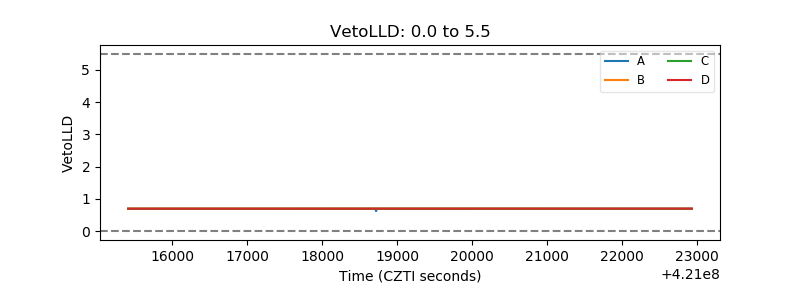 |
| Alpha Counter | 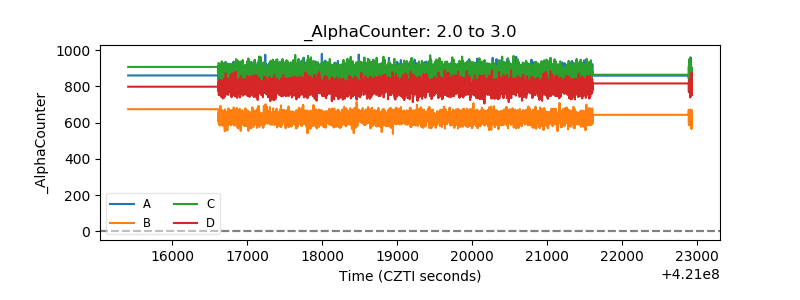 |
| _CPM_Rate | 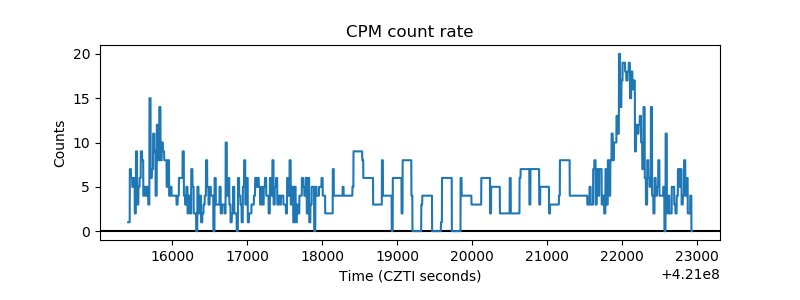 |
| CZT Counter | 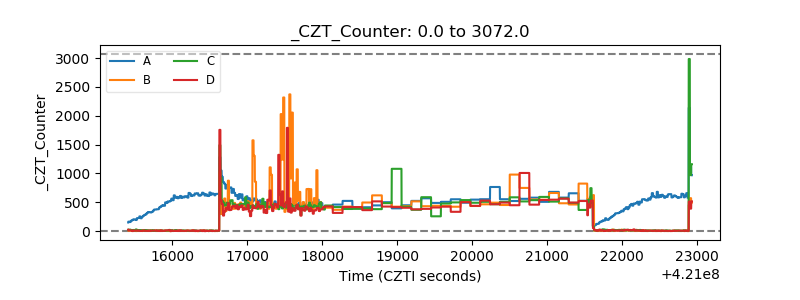 |
| +2.5 Volts monitor | 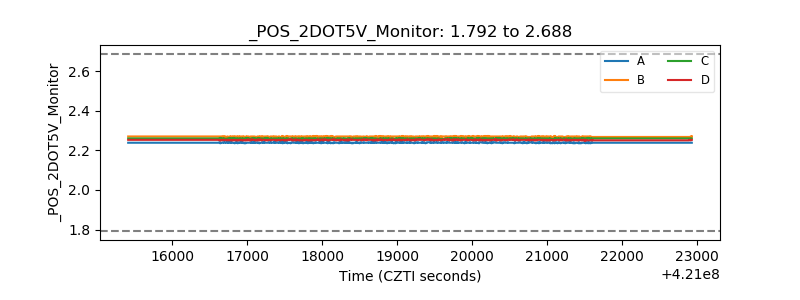 |
| +5 Volts monitor | 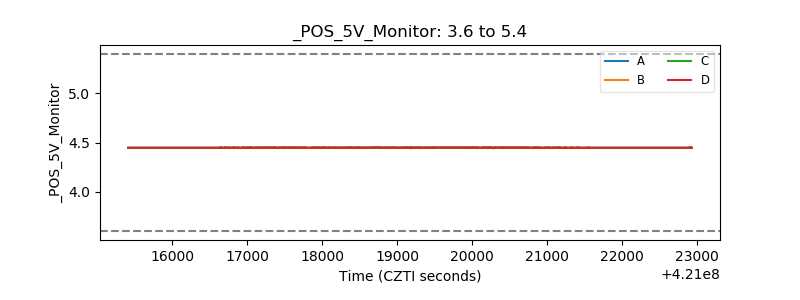 |
| _ROLL_ROT | 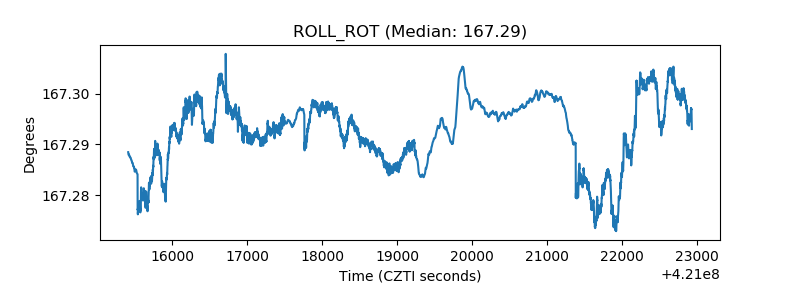 |
| _Roll_DEC | 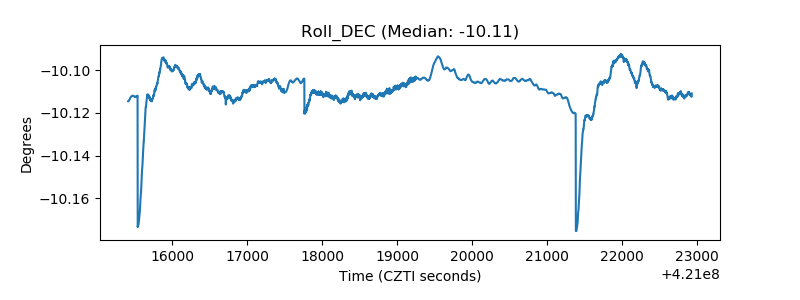 |
| _Roll_RA | 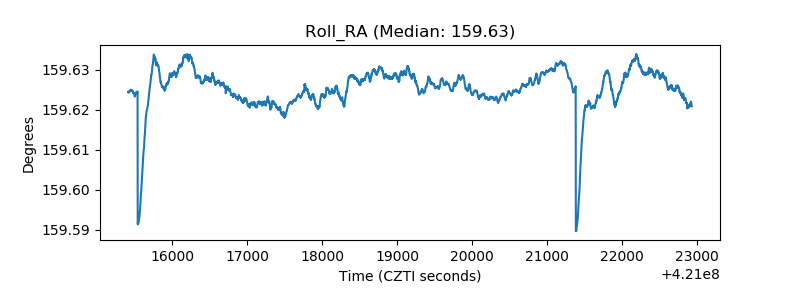 |
| Veto Counter |  |