| Param | Original file | Final file |
|---|---|---|
| Filename | modeM0/AS1A12_044T19_9000005600_41106cztM0_level2.fits | modeM0/AS1A12_044T19_9000005600_41106cztM0_level2_quad_clean.evt |
| Size (bytes) | 746,893,440 | 167,918,400 |
| Size | 712.3 MB | 160.1 MB |
| Events in quadrant A | 5,817,504 | 1,162,294 |
| Events in quadrant B | 6,628,251 | 1,155,667 |
| Events in quadrant C | 5,451,172 | 1,110,266 |
| Events in quadrant D | 8,921,620 | 915,894 |
| Mode SS | |||
|---|---|---|---|
| Quadrant | BADHDUFLAG | Total packets | Discarded packets |
| A | 0 | 218 | 0 |
| B | 0 | 218 | 0 |
| C | 0 | 218 | 0 |
| D | 0 | 218 | 0 |
| Mode M0 | |||
|---|---|---|---|
| Quadrant | BADHDUFLAG | Total packets | Discarded packets |
| A | 0 | 23579 | 4 |
| B | 0 | 26945 | 3 |
| C | 0 | 22738 | 3 |
| D | 0 | 34129 | 3 |
| Mode M9 | |||
|---|---|---|---|
| Quadrant | BADHDUFLAG | Total packets | Discarded packets |
| A | 0 | 42 | 0 |
| B | 0 | 42 | 0 |
| C | 0 | 42 | 0 |
| D | 0 | 42 | 0 |
| Quadrant | Total seconds | Saturated seconds | Saturation percentage |
|---|---|---|---|
| A | 10692 | 36 | 0.336700% |
| B | 10692 | 430 | 4.021698% |
| C | 10692 | 80 | 0.748223% |
| D | 10692 | 1462 | 13.673775% |
Noise dominated data is calculated using 1-second bins in cleaned event files. If a bin has >2000 counts, and if more than 50% of those come from <1% of pixels, then it is considered to be noise-dominated and hence unusable.
| Quadrant | # 1 sec bins | Bins with >0 counts | Bins with >2000 counts | High rate bins dominated by noise | Noise dominated (total time) | Noise dominated (detector-on time) | Marked lightcurve |
|---|---|---|---|---|---|---|---|
| A | 14811 | 10695 | 19 | 19 | 0.13% | 0.18% | 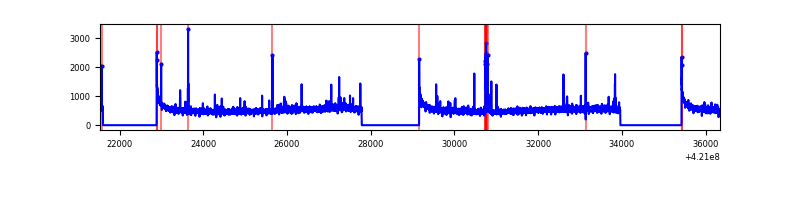 |
| B | 14811 | 10695 | 288 | 288 | 1.94% | 2.69% | 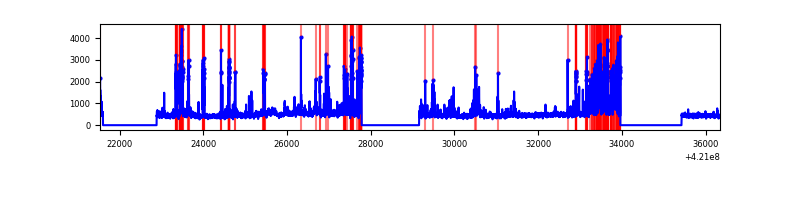 |
| C | 14811 | 10695 | 57 | 57 | 0.38% | 0.53% | 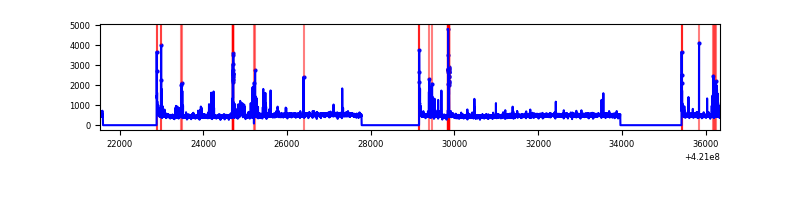 |
| D | 14811 | 10695 | 1125 | 1125 | 7.60% | 10.52% | 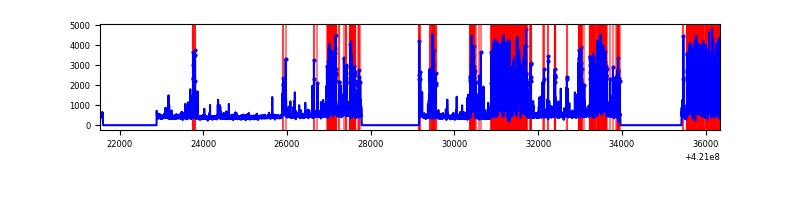 |
Top three noisy pixels from each quadrant. If the there are fewer than three noisy pixels in the level2.evt file, extra rows are filled as -1
| Pixel properties | Quadrant properties | ||||||
|---|---|---|---|---|---|---|---|
| Quadrant | DetID | PixID | Counts | Sigma | Mean | Median | Sigma |
| A | 10 | 83 | 935932 | 3778.83 | 1204 | 1181 | 247.4 |
| A | 2 | 79 | 127268 | 509.72 | 1204 | 1181 | 247.4 |
| A | 12 | 189 | 39775 | 156.02 | 1204 | 1181 | 247.4 |
| B | 0 | 245 | 1490663 | 6457.0 | 1179 | 1145 | 230.7 |
| B | 0 | 186 | 289661 | 1250.71 | 1179 | 1145 | 230.7 |
| B | 0 | 190 | 172269 | 741.82 | 1179 | 1145 | 230.7 |
| C | 15 | 214 | 456355 | 1671.26 | 1161 | 1165 | 272.4 |
| C | 14 | 254 | 373138 | 1365.72 | 1161 | 1165 | 272.4 |
| C | 0 | 10 | 71623 | 258.69 | 1161 | 1165 | 272.4 |
| D | 2 | 249 | 2961228 | 10882.37 | 1103 | 1073 | 272.0 |
| D | 13 | 249 | 1560628 | 5733.37 | 1103 | 1073 | 272.0 |
| D | 5 | 32 | 57160 | 206.19 | 1103 | 1073 | 272.0 |
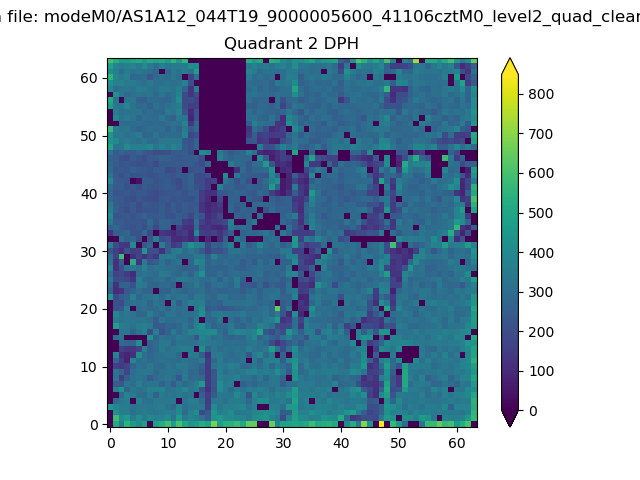
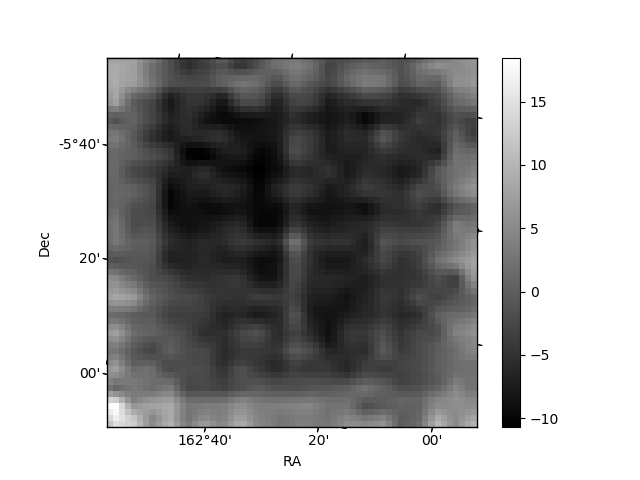
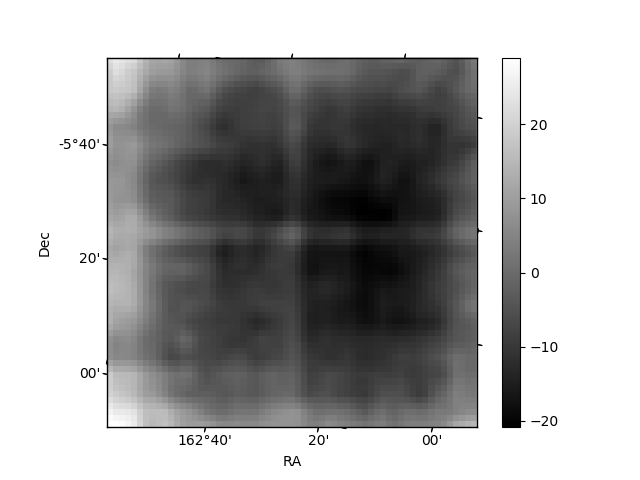
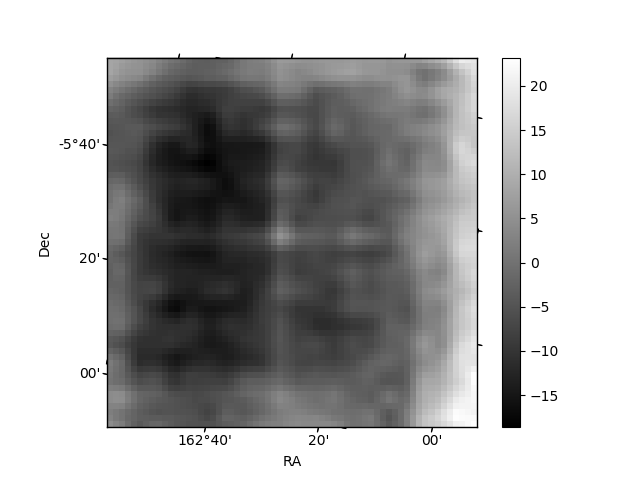
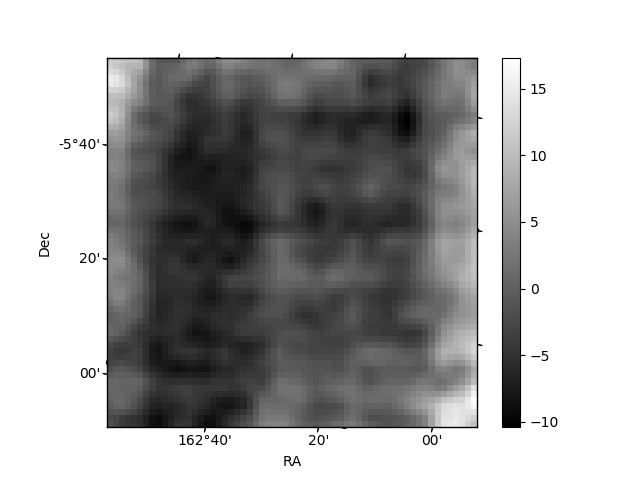
Histogram calculated using DETX and DETY for each event in the final _common_clean file
| Quadrant A | 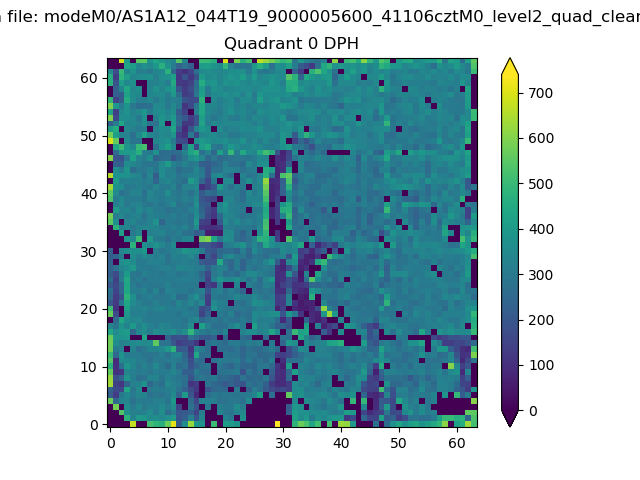 |
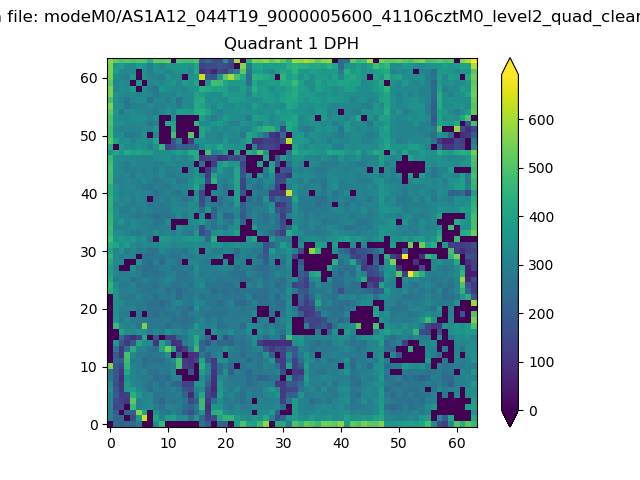 |
Quadrant B |
|---|---|---|---|
| Quadrant D | 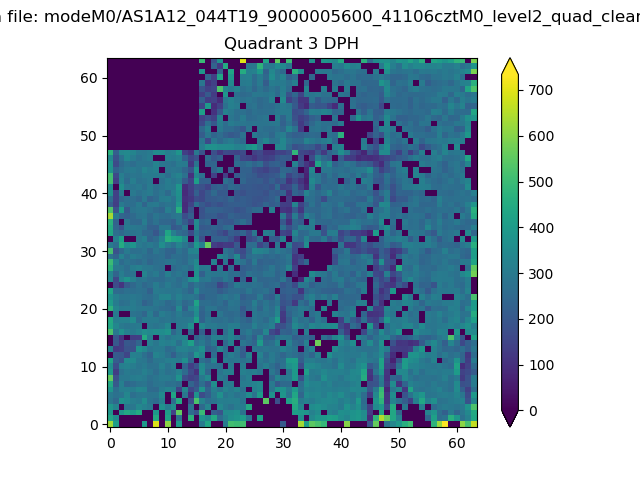 |
 |
Quadrant C |
| Plot type | Count rate plots | Images |
|---|---|---|
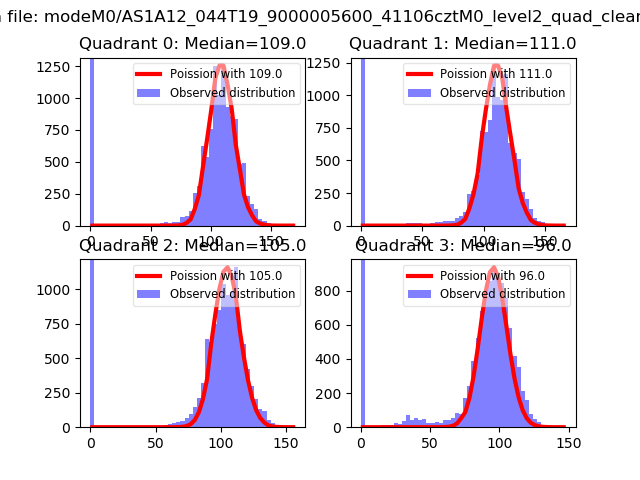
| Comparison with Poisson distribution Blue bars denote a histogram of data divided into 1 sec bins. Red curve is a Poisson curve with rate = median count rate of data. |
 |
 |
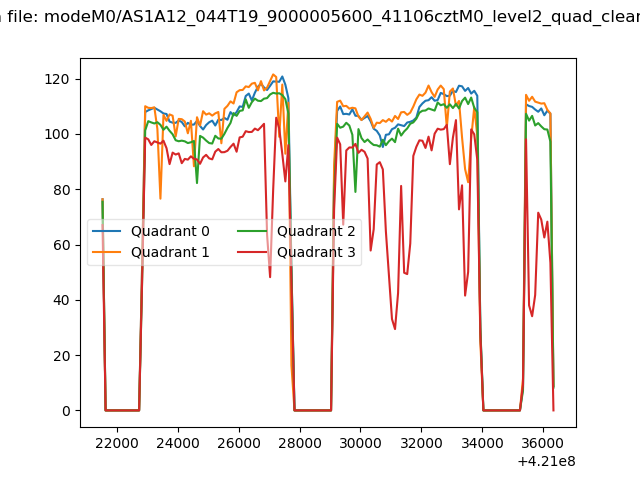
| Quadrant-wise count rates Data is divided into 100 sec bins |
 |
|
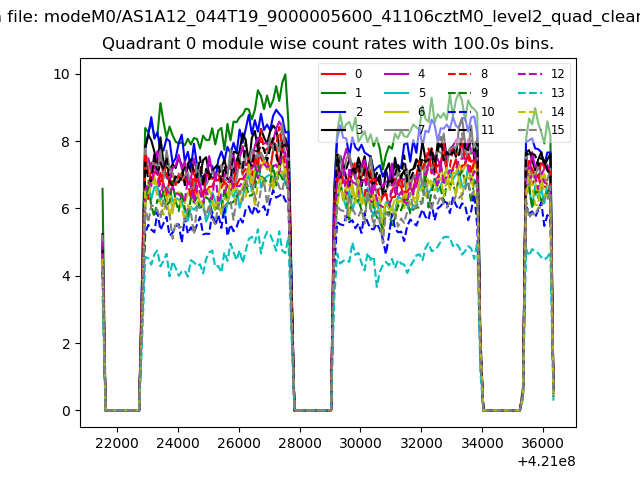
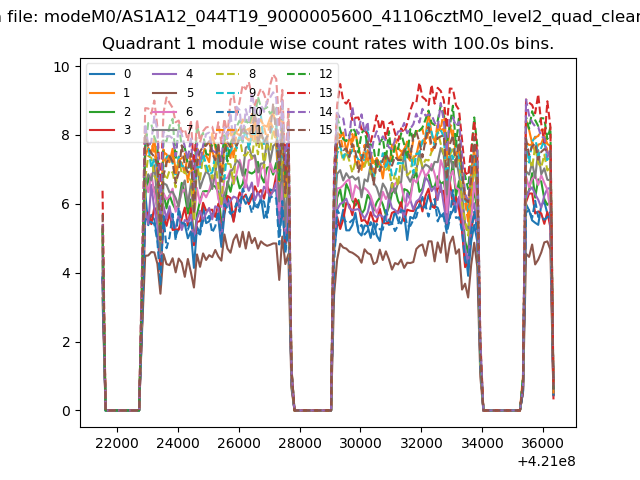
| Module-wise count rates for Quadrant A Data is divided into 100 sec bins |
 |
 |
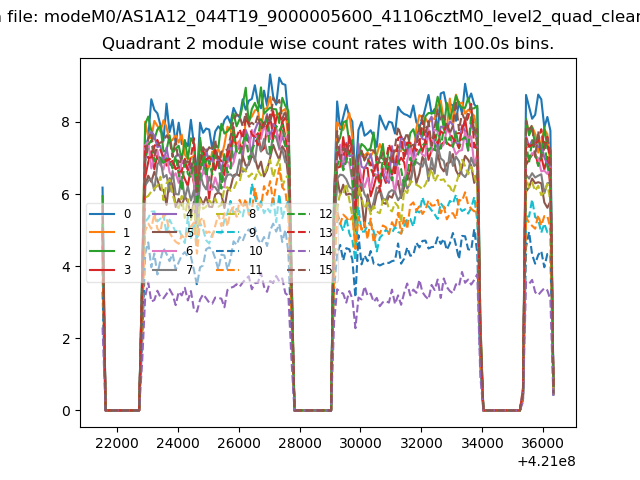
| Module-wise count rates for Quadrant B Data is divided into 100 sec bins |
 |
 |
| Module-wise count rates for Quadrant C Data is divided into 100 sec bins |
 |
 |
| Module-wise count rates for Quadrant D Data is divided into 100 sec bins |
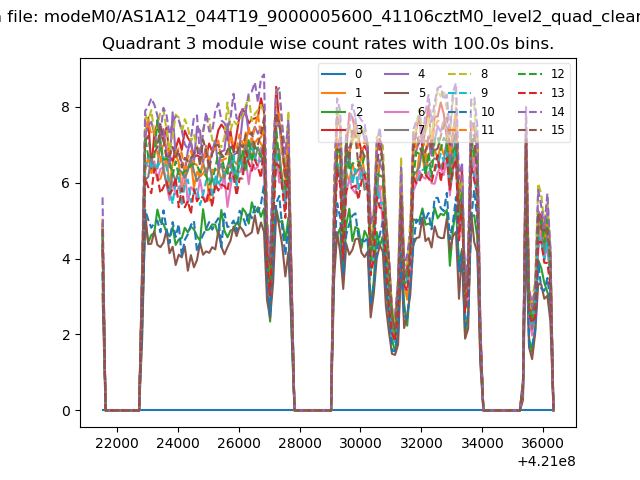 |
 |
| Parameter | Plot |
|---|---|
| CZT HV Monitor | 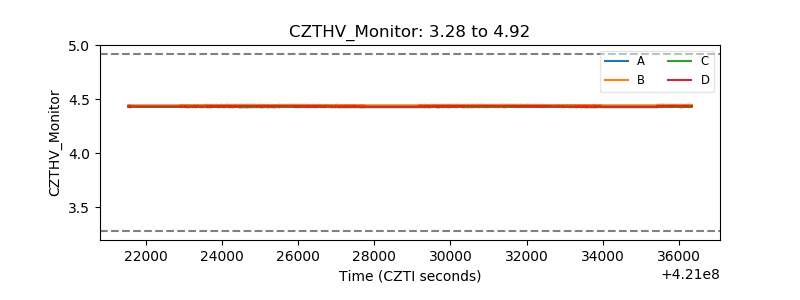 |
| D_VDD | 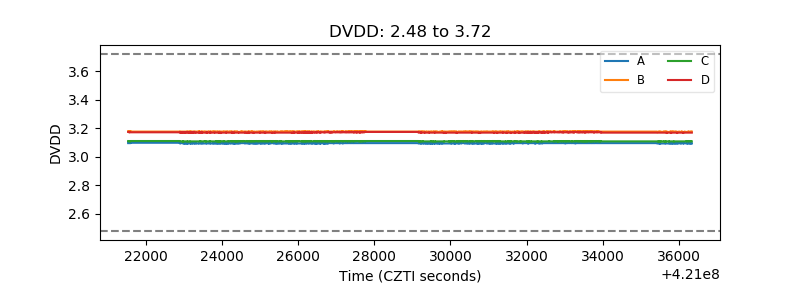 |
| Temperature 1 | 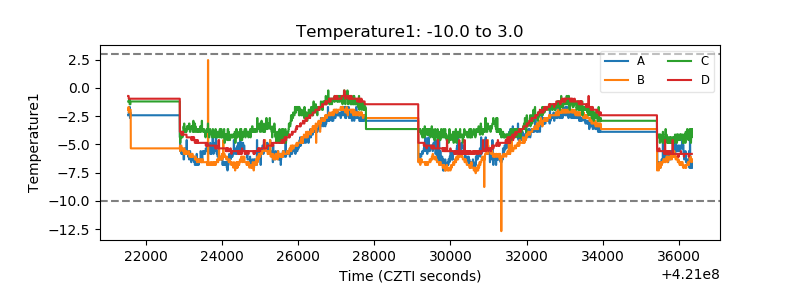 |
| Veto HV Monitor | 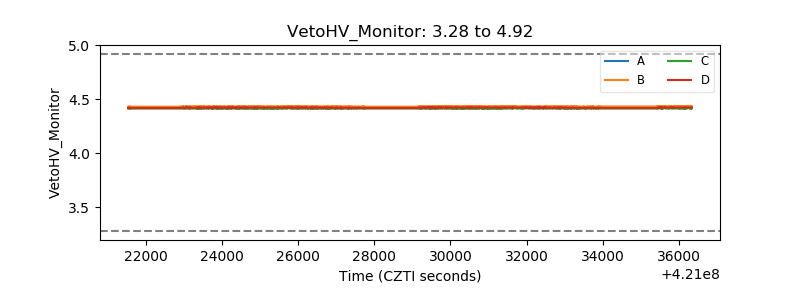 |
| Veto LLD |  |
| Alpha Counter | 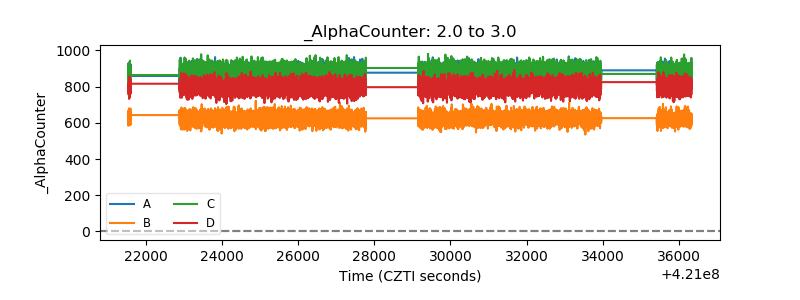 |
| _CPM_Rate | 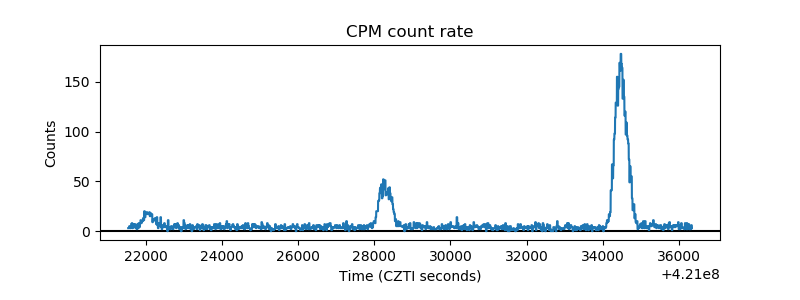 |
| CZT Counter | 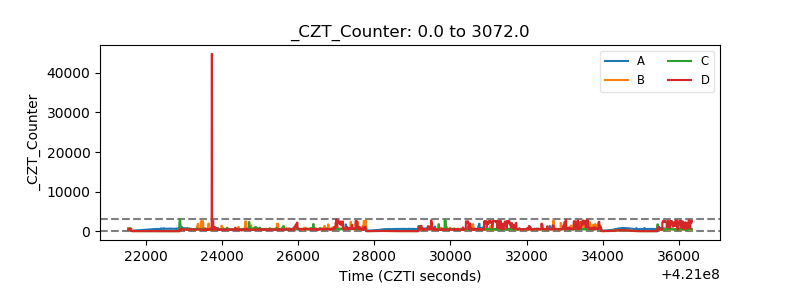 |
| +2.5 Volts monitor | 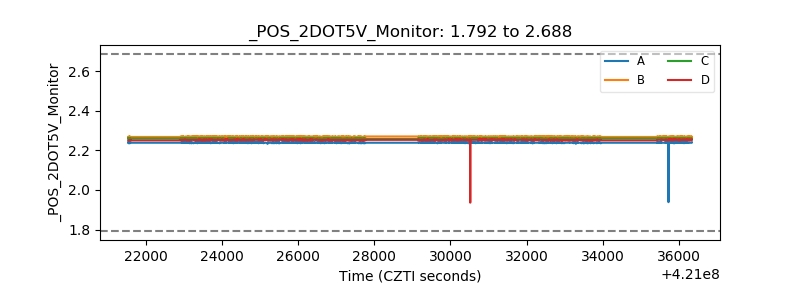 |
| +5 Volts monitor | 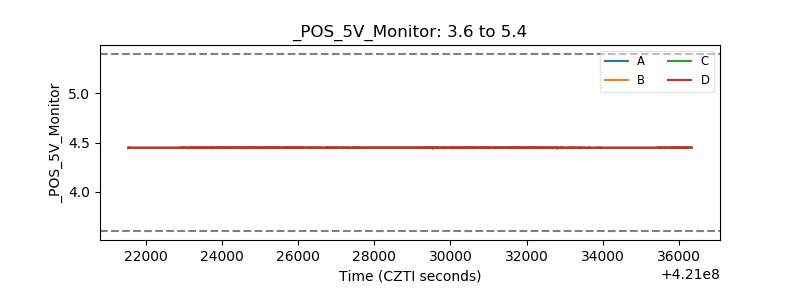 |
| _ROLL_ROT | 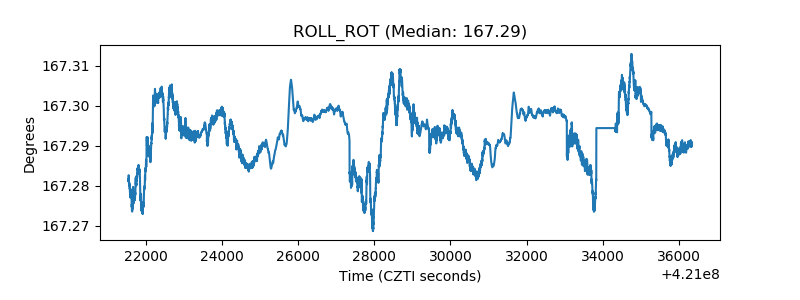 |
| _Roll_DEC | 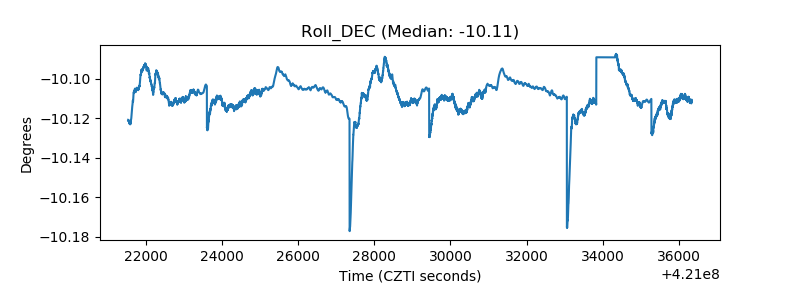 |
| _Roll_RA | 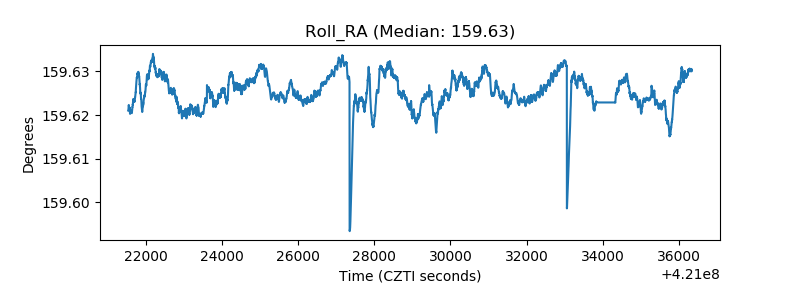 |
| Veto Counter | 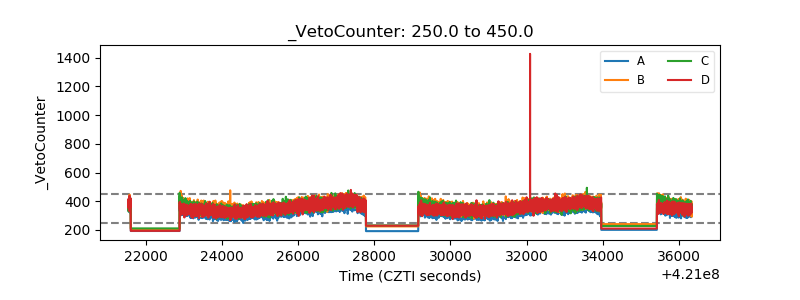 |