| Param | Original file | Final file |
|---|---|---|
| Filename | modeM0/AS1A12_044T19_9000005600_41107cztM0_level2.fits | modeM0/AS1A12_044T19_9000005600_41107cztM0_level2_quad_clean.evt |
| Size (bytes) | 460,615,680 | 92,352,960 |
| Size | 439.3 MB | 88.1 MB |
| Events in quadrant A | 3,172,563 | 658,067 |
| Events in quadrant B | 4,003,134 | 617,098 |
| Events in quadrant C | 2,974,214 | 627,396 |
| Events in quadrant D | 6,449,482 | 488,522 |
| Mode SS | |||
|---|---|---|---|
| Quadrant | BADHDUFLAG | Total packets | Discarded packets |
| A | 0 | 120 | 0 |
| B | 0 | 120 | 0 |
| C | 0 | 120 | 0 |
| D | 0 | 120 | 0 |
| Mode M0 | |||
|---|---|---|---|
| Quadrant | BADHDUFLAG | Total packets | Discarded packets |
| A | 0 | 12691 | 3 |
| B | 0 | 15815 | 2 |
| C | 0 | 12306 | 2 |
| D | 0 | 23136 | 2 |
| Mode M9 | |||
|---|---|---|---|
| Quadrant | BADHDUFLAG | Total packets | Discarded packets |
| A | 0 | 30 | 0 |
| B | 0 | 30 | 0 |
| C | 0 | 30 | 0 |
| D | 0 | 30 | 0 |
| Quadrant | Total seconds | Saturated seconds | Saturation percentage |
|---|---|---|---|
| A | 5799 | 14 | 0.241421% |
| B | 5799 | 520 | 8.967063% |
| C | 5799 | 35 | 0.603552% |
| D | 5799 | 1240 | 21.382997% |
Noise dominated data is calculated using 1-second bins in cleaned event files. If a bin has >2000 counts, and if more than 50% of those come from <1% of pixels, then it is considered to be noise-dominated and hence unusable.
| Quadrant | # 1 sec bins | Bins with >0 counts | Bins with >2000 counts | High rate bins dominated by noise | Noise dominated (total time) | Noise dominated (detector-on time) | Marked lightcurve |
|---|---|---|---|---|---|---|---|
| A | 8843 | 5801 | 3 | 3 | 0.03% | 0.05% | 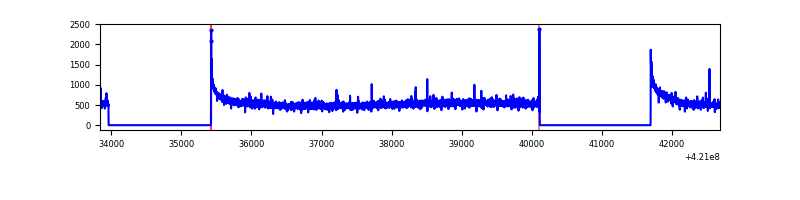 |
| B | 8843 | 5801 | 343 | 343 | 3.88% | 5.91% | 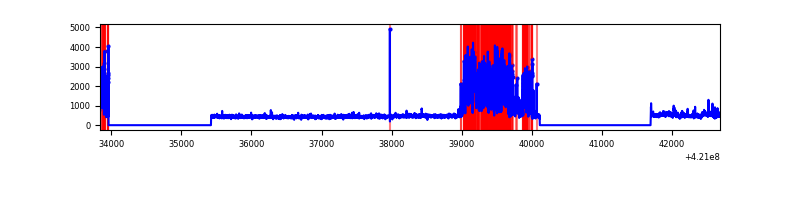 |
| C | 8843 | 5801 | 25 | 25 | 0.28% | 0.43% | 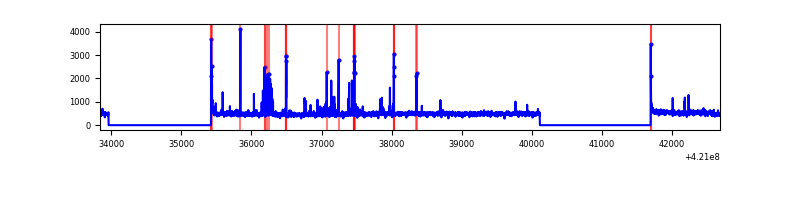 |
| D | 8843 | 5801 | 1064 | 1064 | 12.03% | 18.34% | 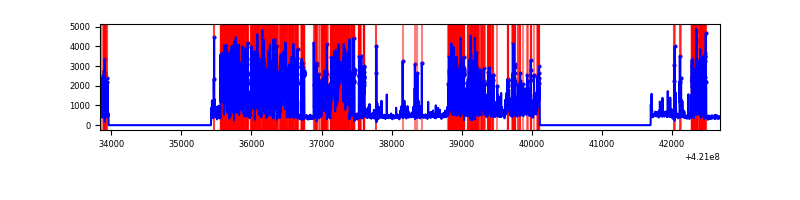 |
Top three noisy pixels from each quadrant. If the there are fewer than three noisy pixels in the level2.evt file, extra rows are filled as -1
| Pixel properties | Quadrant properties | ||||||
|---|---|---|---|---|---|---|---|
| Quadrant | DetID | PixID | Counts | Sigma | Mean | Median | Sigma |
| A | 10 | 83 | 549650 | 4015.34 | 663 | 650 | 136.7 |
| A | 12 | 189 | 26767 | 191.02 | 663 | 650 | 136.7 |
| A | 2 | 79 | 26592 | 189.74 | 663 | 650 | 136.7 |
| B | 0 | 186 | 753909 | 6083.66 | 633 | 615 | 123.8 |
| B | 0 | 245 | 691648 | 5580.84 | 633 | 615 | 123.8 |
| B | 5 | 255 | 50824 | 405.49 | 633 | 615 | 123.8 |
| C | 15 | 214 | 253972 | 1685.56 | 637 | 640 | 150.3 |
| C | 14 | 254 | 181090 | 1200.63 | 637 | 640 | 150.3 |
| C | 0 | 10 | 31287 | 203.91 | 637 | 640 | 150.3 |
| D | 2 | 249 | 2330448 | 16208.19 | 583 | 566 | 143.7 |
| D | 13 | 249 | 1777275 | 12359.96 | 583 | 566 | 143.7 |
| D | 5 | 32 | 36466 | 249.74 | 583 | 566 | 143.7 |
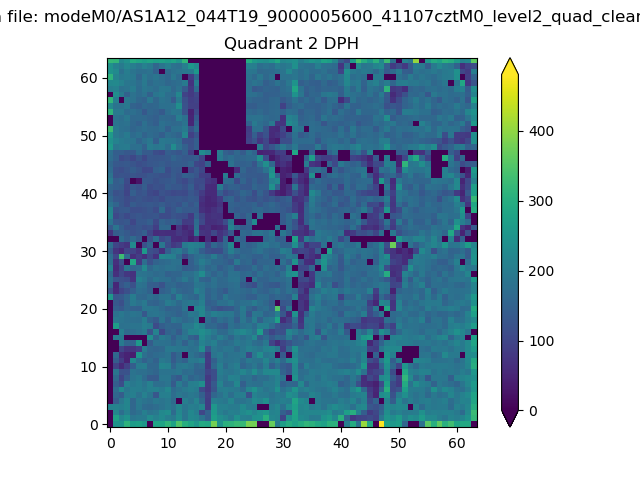
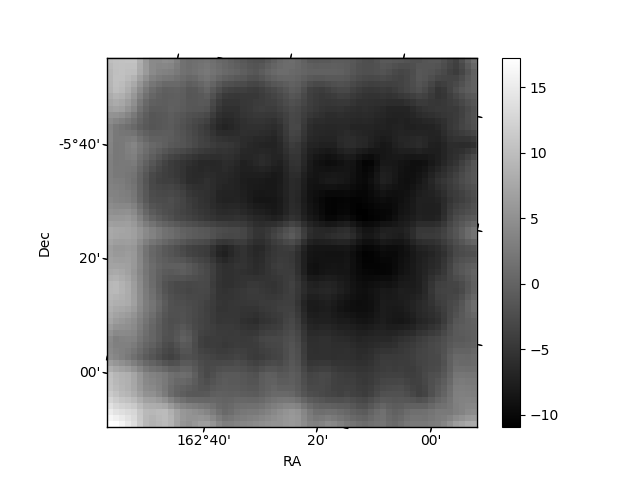
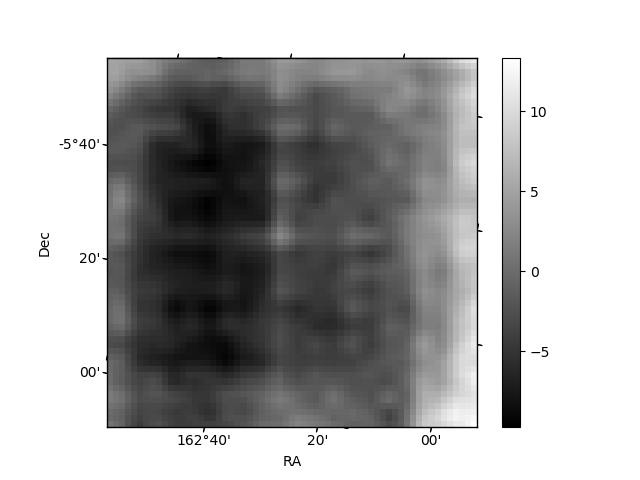
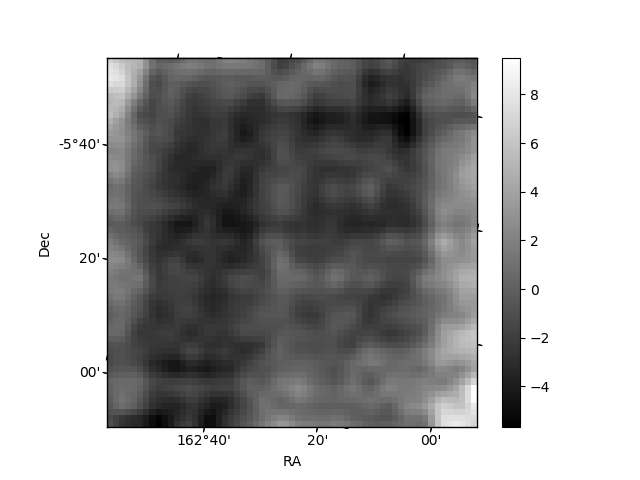
Histogram calculated using DETX and DETY for each event in the final _common_clean file
| Quadrant A | 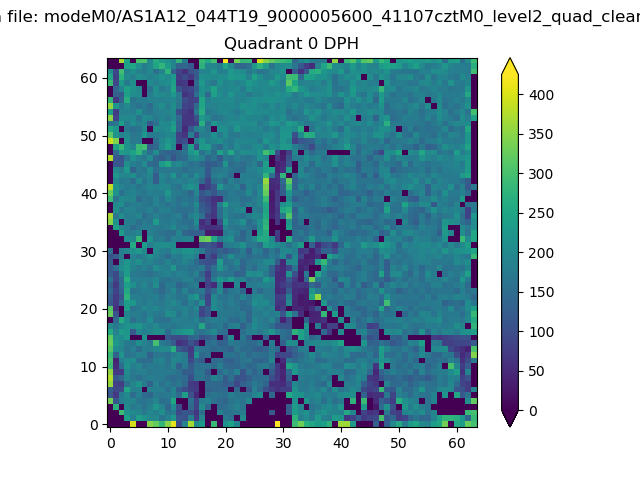 |
 |
Quadrant B |
|---|---|---|---|
| Quadrant D |  |
 |
Quadrant C |
| Plot type | Count rate plots | Images |
|---|---|---|
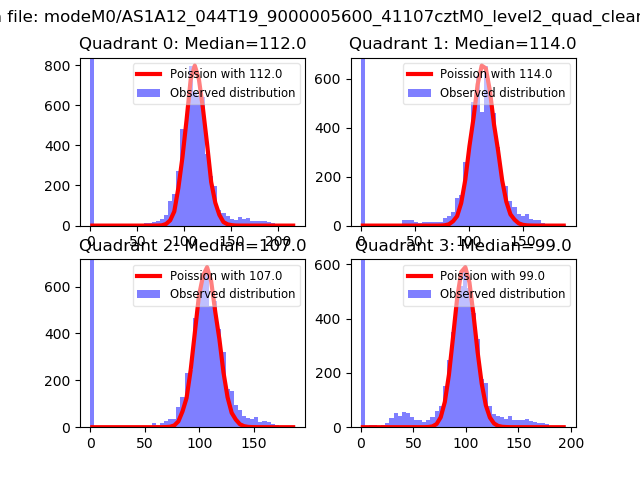
| Comparison with Poisson distribution Blue bars denote a histogram of data divided into 1 sec bins. Red curve is a Poisson curve with rate = median count rate of data. |
 |
 |
| Quadrant-wise count rates Data is divided into 100 sec bins |
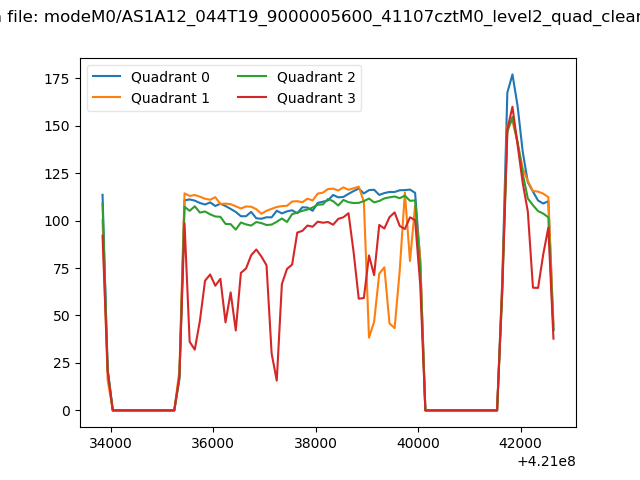 |
|
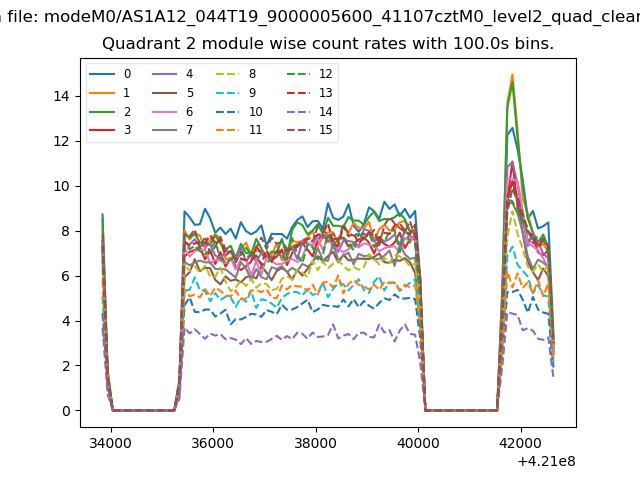
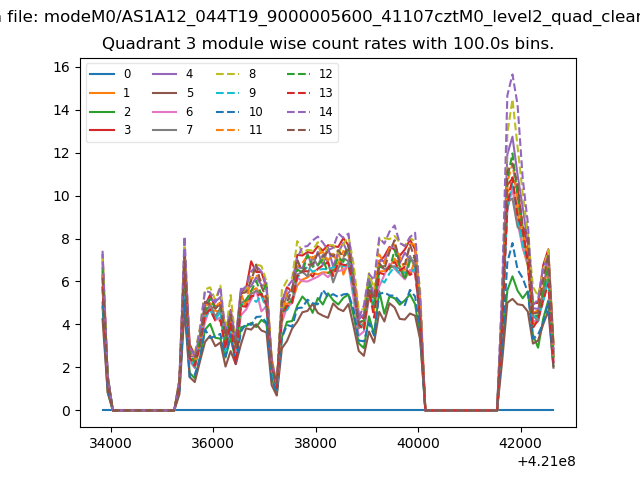
| Module-wise count rates for Quadrant A Data is divided into 100 sec bins |
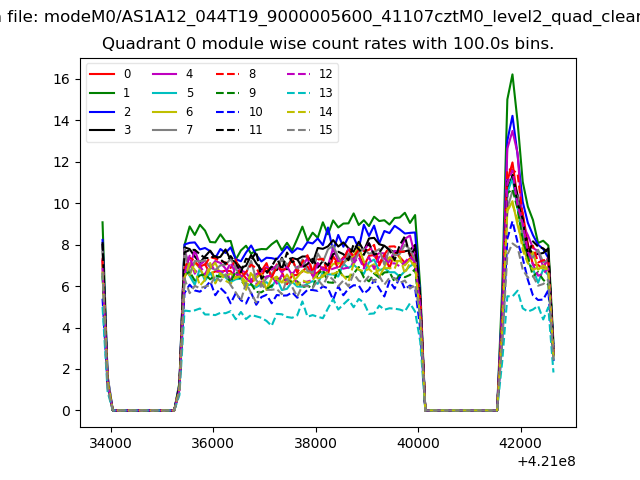 |
 |
| Module-wise count rates for Quadrant B Data is divided into 100 sec bins |
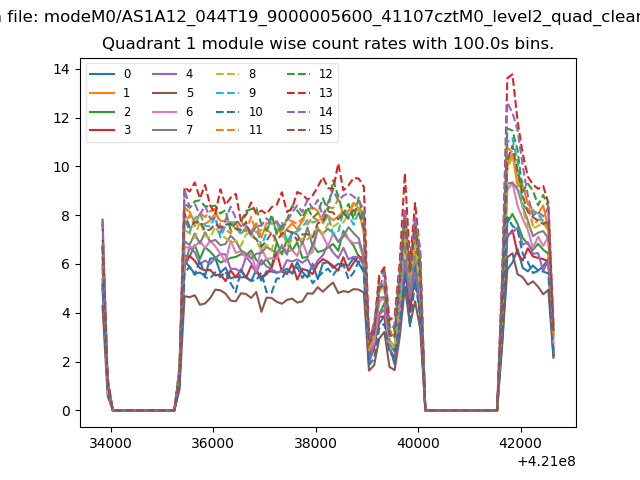 |
 |
| Module-wise count rates for Quadrant C Data is divided into 100 sec bins |
 |
 |
| Module-wise count rates for Quadrant D Data is divided into 100 sec bins |
 |
 |
| Parameter | Plot |
|---|---|
| CZT HV Monitor | 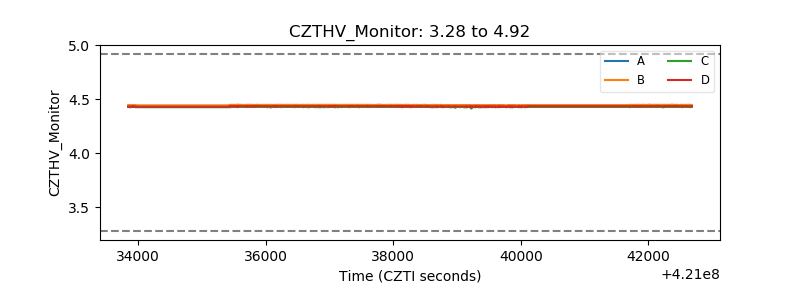 |
| D_VDD | 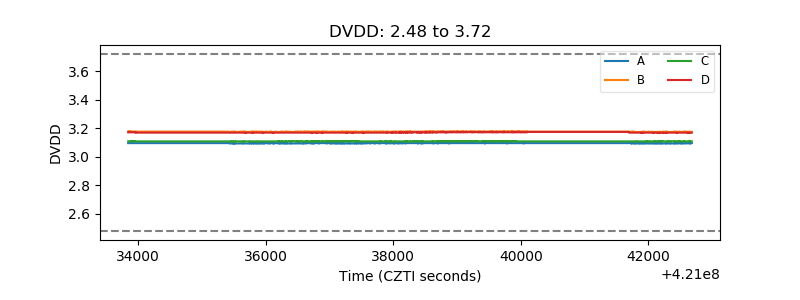 |
| Temperature 1 | 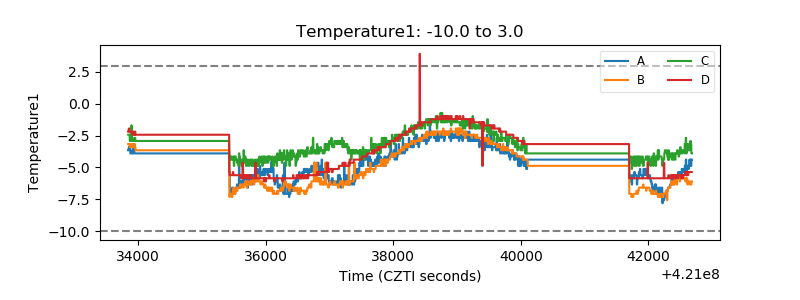 |
| Veto HV Monitor | 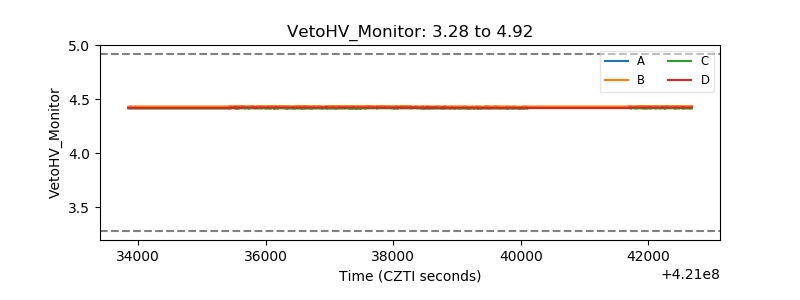 |
| Veto LLD | 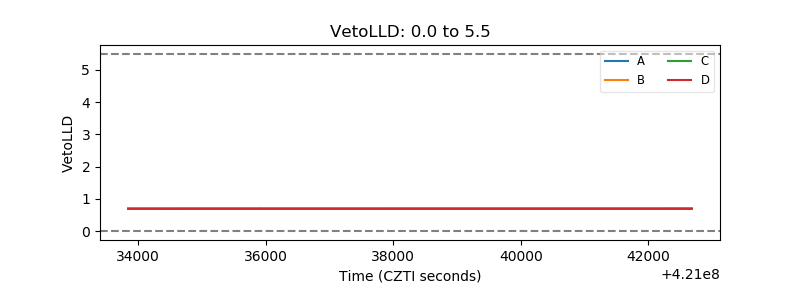 |
| Alpha Counter | 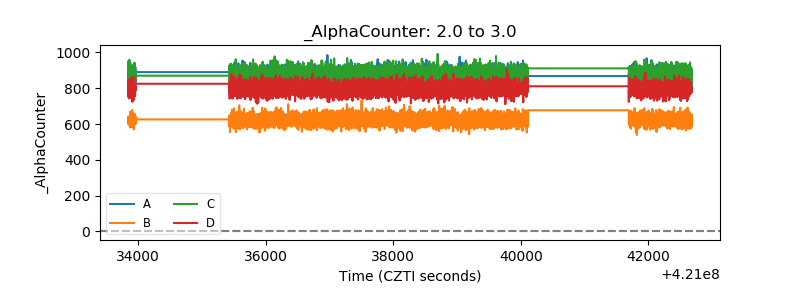 |
| _CPM_Rate | 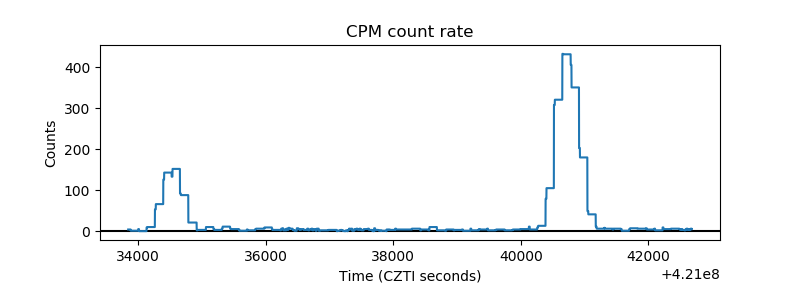 |
| CZT Counter | 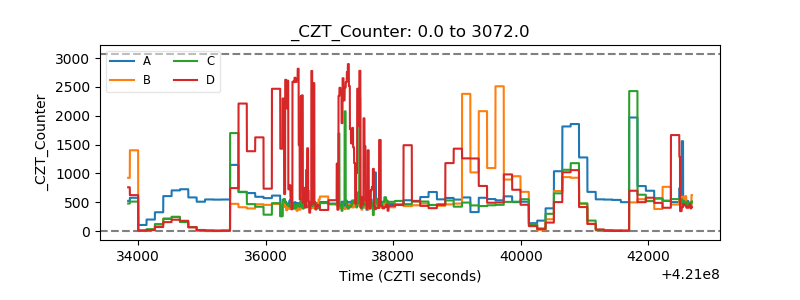 |
| +2.5 Volts monitor | 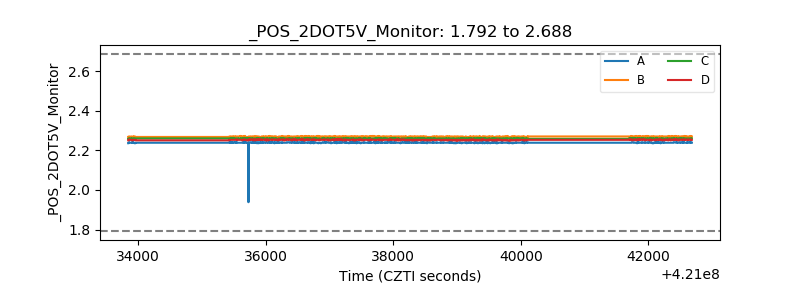 |
| +5 Volts monitor | 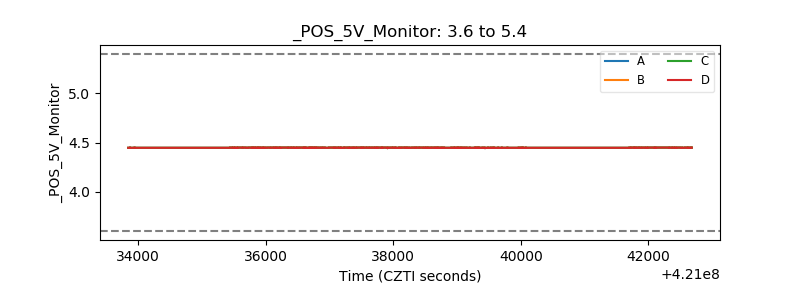 |
| _ROLL_ROT | 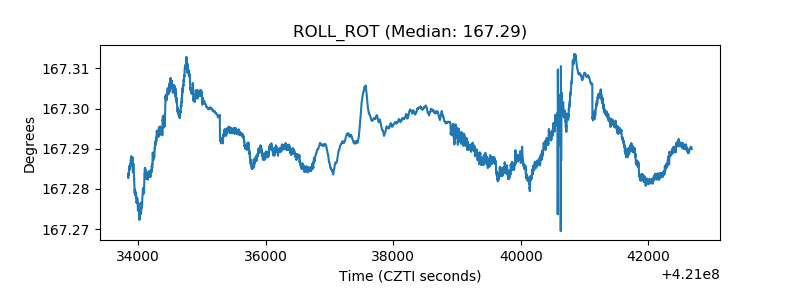 |
| _Roll_DEC | 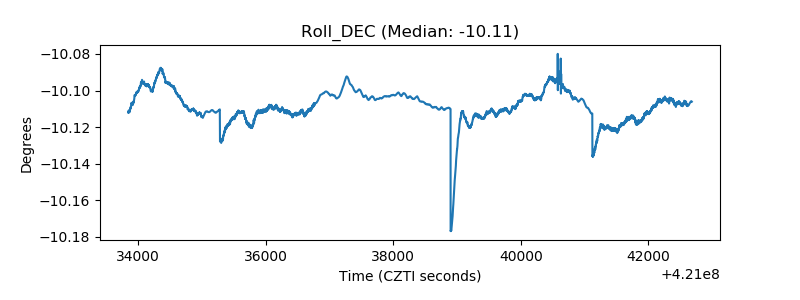 |
| _Roll_RA | 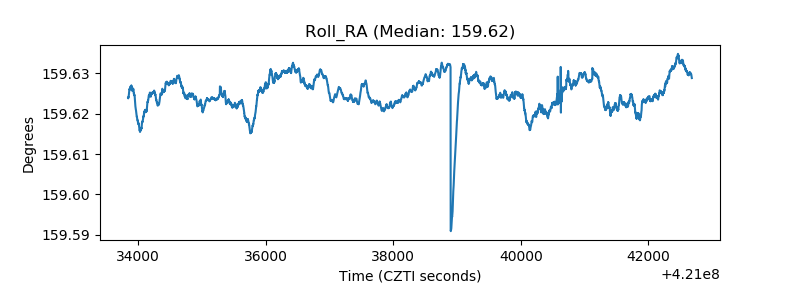 |
| Veto Counter |  |