| Param | Original file | Final file |
|---|---|---|
| Filename | modeM0/AS1A12_044T19_9000005600_41108cztM0_level2.fits | modeM0/AS1A12_044T19_9000005600_41108cztM0_level2_quad_clean.evt |
| Size (bytes) | 366,626,880 | 91,396,800 |
| Size | 349.6 MB | 87.2 MB |
| Events in quadrant A | 3,029,258 | 634,236 |
| Events in quadrant B | 3,707,550 | 616,596 |
| Events in quadrant C | 2,738,550 | 602,886 |
| Events in quadrant D | 3,674,269 | 534,436 |
| Mode SS | |||
|---|---|---|---|
| Quadrant | BADHDUFLAG | Total packets | Discarded packets |
| A | 0 | 112 | 0 |
| B | 0 | 112 | 0 |
| C | 0 | 112 | 0 |
| D | 0 | 112 | 0 |
| Mode M0 | |||
|---|---|---|---|
| Quadrant | BADHDUFLAG | Total packets | Discarded packets |
| A | 0 | 12100 | 3 |
| B | 0 | 14425 | 2 |
| C | 0 | 11240 | 2 |
| D | 0 | 14727 | 2 |
| Mode M9 | |||
|---|---|---|---|
| Quadrant | BADHDUFLAG | Total packets | Discarded packets |
| A | 0 | 18 | 0 |
| B | 0 | 18 | 0 |
| C | 0 | 18 | 0 |
| D | 0 | 19 | 0 |
| Quadrant | Total seconds | Saturated seconds | Saturation percentage |
|---|---|---|---|
| A | 5414 | 18 | 0.332471% |
| B | 5414 | 327 | 6.039897% |
| C | 5414 | 17 | 0.314001% |
| D | 5414 | 359 | 6.630957% |
Noise dominated data is calculated using 1-second bins in cleaned event files. If a bin has >2000 counts, and if more than 50% of those come from <1% of pixels, then it is considered to be noise-dominated and hence unusable.
| Quadrant | # 1 sec bins | Bins with >0 counts | Bins with >2000 counts | High rate bins dominated by noise | Noise dominated (total time) | Noise dominated (detector-on time) | Marked lightcurve |
|---|---|---|---|---|---|---|---|
| A | 7148 | 5415 | 3 | 3 | 0.04% | 0.06% | 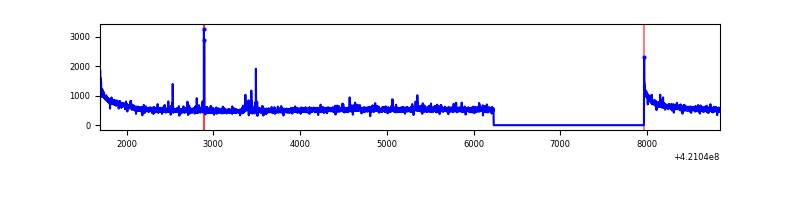 |
| B | 7148 | 5415 | 246 | 246 | 3.44% | 4.54% | 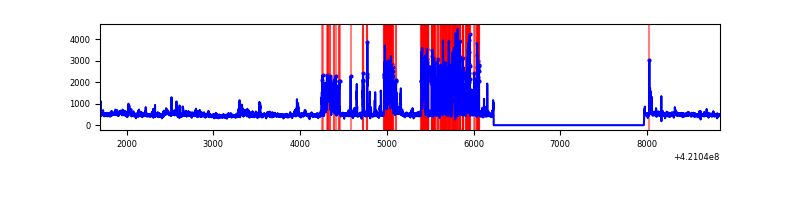 |
| C | 7148 | 5415 | 9 | 9 | 0.13% | 0.17% | 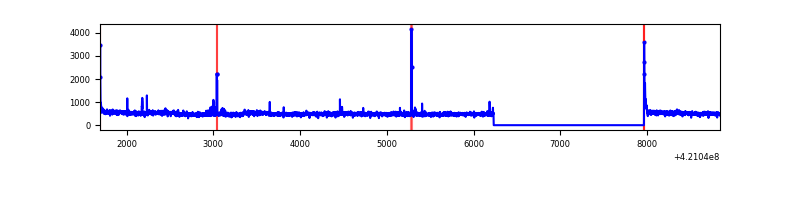 |
| D | 7148 | 5415 | 286 | 286 | 4.00% | 5.28% | 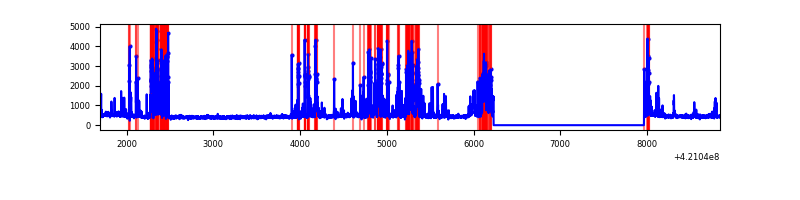 |
Top three noisy pixels from each quadrant. If the there are fewer than three noisy pixels in the level2.evt file, extra rows are filled as -1
| Pixel properties | Quadrant properties | ||||||
|---|---|---|---|---|---|---|---|
| Quadrant | DetID | PixID | Counts | Sigma | Mean | Median | Sigma |
| A | 10 | 83 | 515526 | 3956.01 | 631 | 618 | 130.2 |
| A | 2 | 79 | 45729 | 346.59 | 631 | 618 | 130.2 |
| A | 7 | 3 | 12553 | 91.7 | 631 | 618 | 130.2 |
| B | 0 | 245 | 991847 | 8233.68 | 613 | 597 | 120.4 |
| B | 0 | 186 | 151556 | 1253.92 | 613 | 597 | 120.4 |
| B | 5 | 255 | 104165 | 860.27 | 613 | 597 | 120.4 |
| C | 15 | 214 | 237213 | 1662.72 | 608 | 610 | 142.3 |
| C | 14 | 254 | 45384 | 314.65 | 608 | 610 | 142.3 |
| C | 0 | 10 | 43707 | 302.86 | 608 | 610 | 142.3 |
| D | 13 | 249 | 770807 | 5219.21 | 595 | 576 | 147.6 |
| D | 2 | 249 | 583196 | 3947.92 | 595 | 576 | 147.6 |
| D | 2 | 234 | 23987 | 158.64 | 595 | 576 | 147.6 |
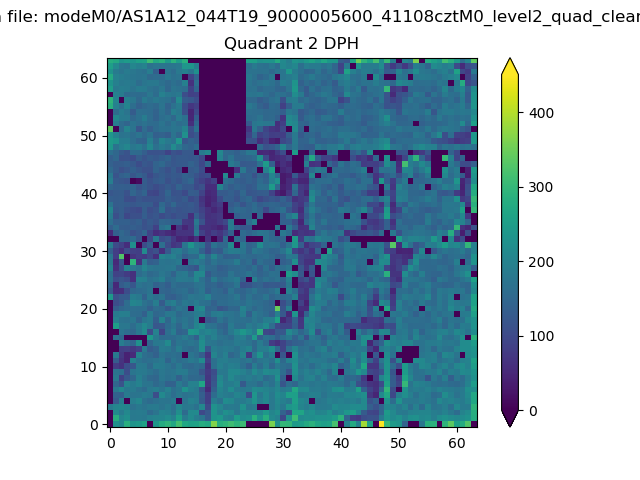
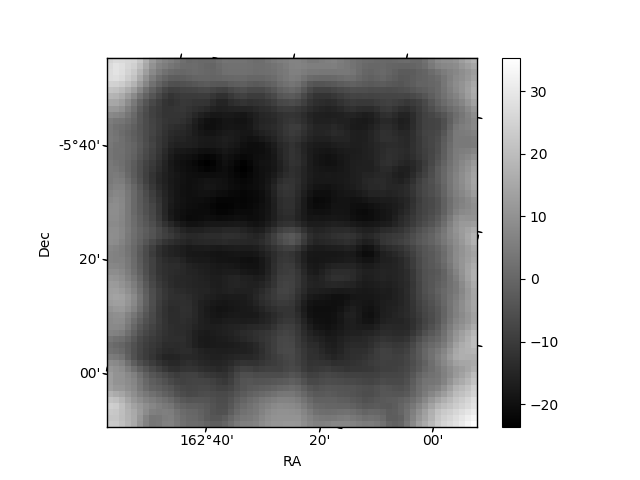
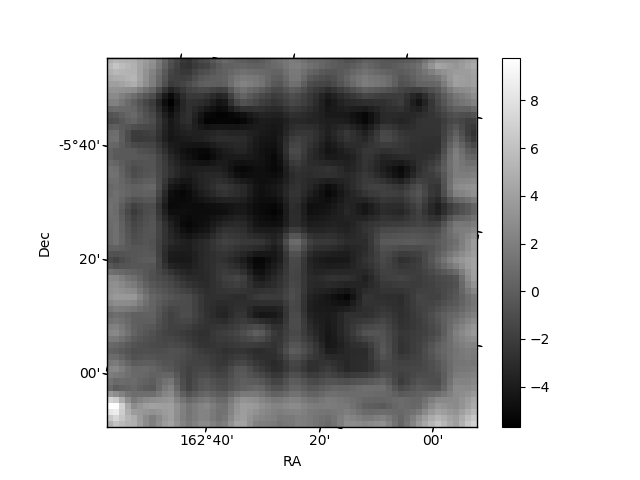
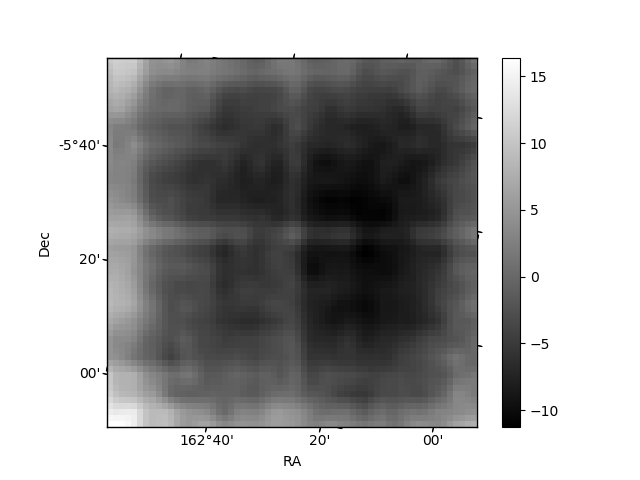
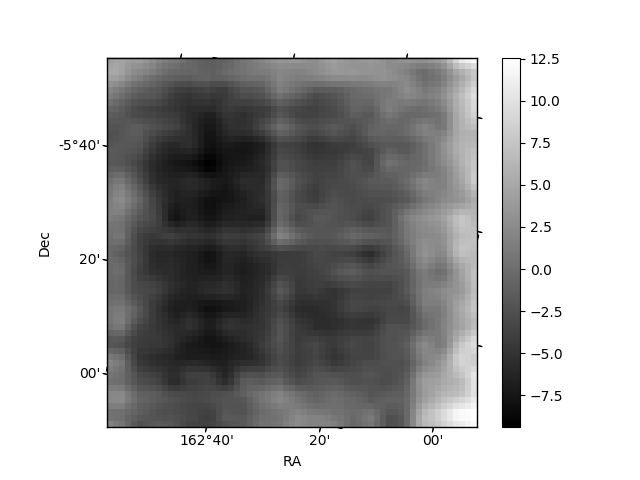
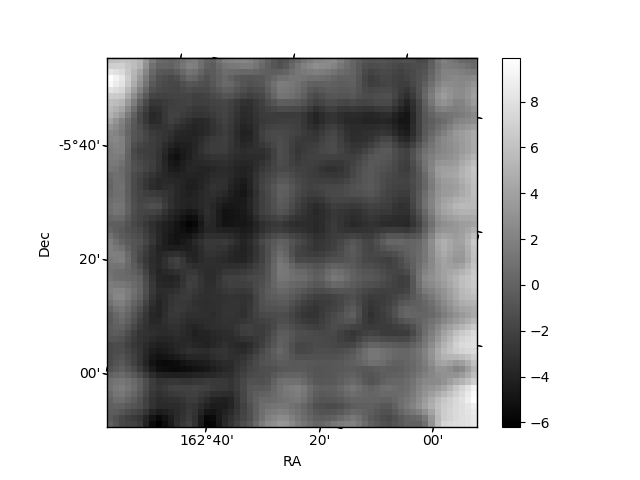
Histogram calculated using DETX and DETY for each event in the final _common_clean file
| Quadrant A | 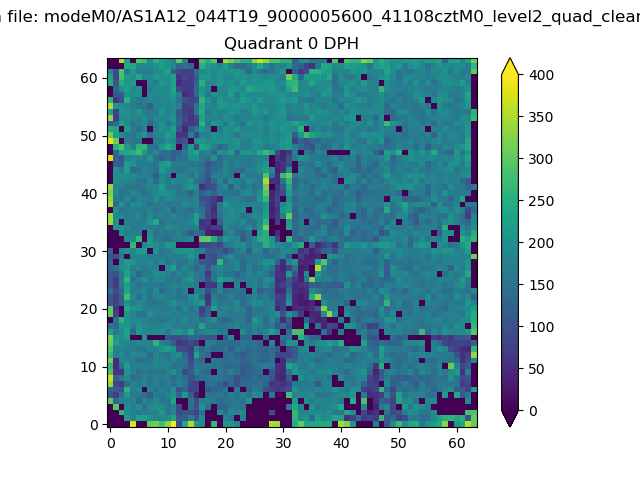 |
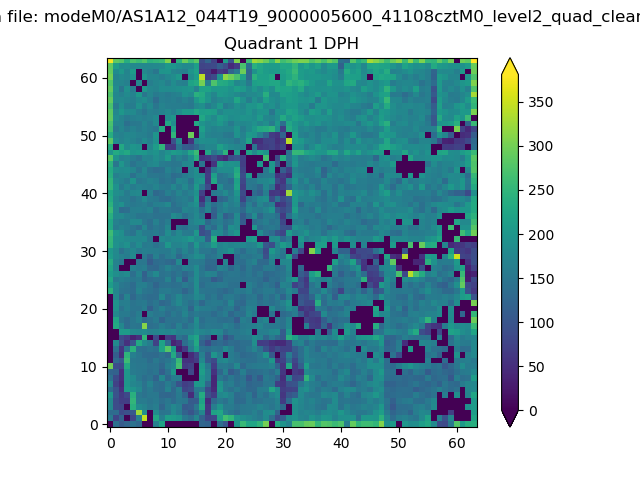 |
Quadrant B |
|---|---|---|---|
| Quadrant D | 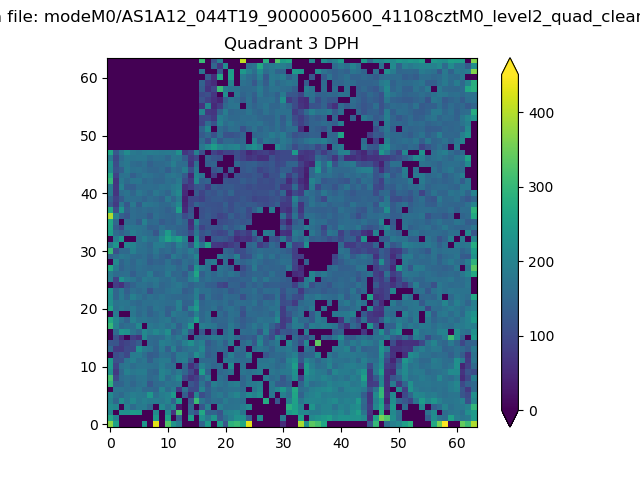 |
 |
Quadrant C |
| Plot type | Count rate plots | Images |
|---|---|---|
| Comparison with Poisson distribution Blue bars denote a histogram of data divided into 1 sec bins. Red curve is a Poisson curve with rate = median count rate of data. |
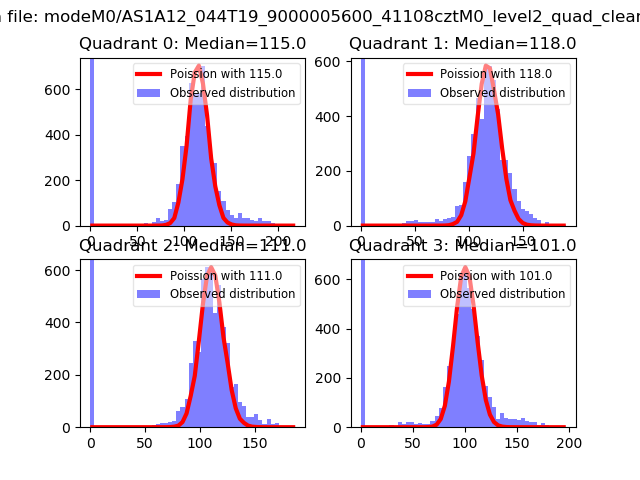 |
 |
| Quadrant-wise count rates Data is divided into 100 sec bins |
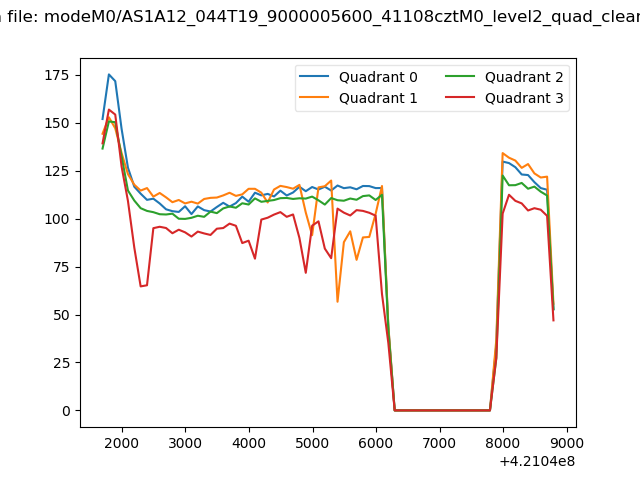 |
|
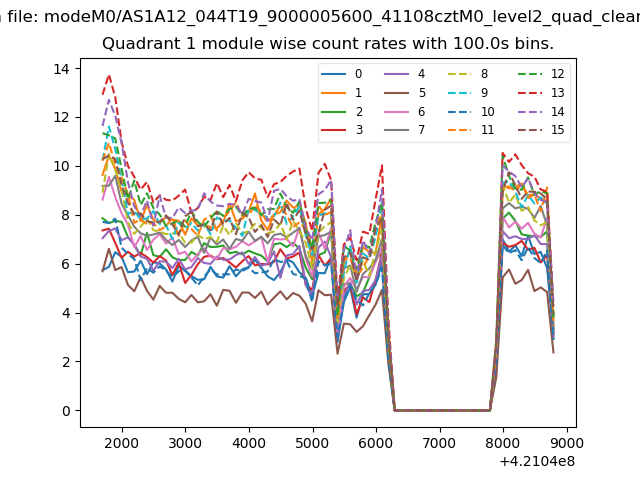
| Module-wise count rates for Quadrant A Data is divided into 100 sec bins |
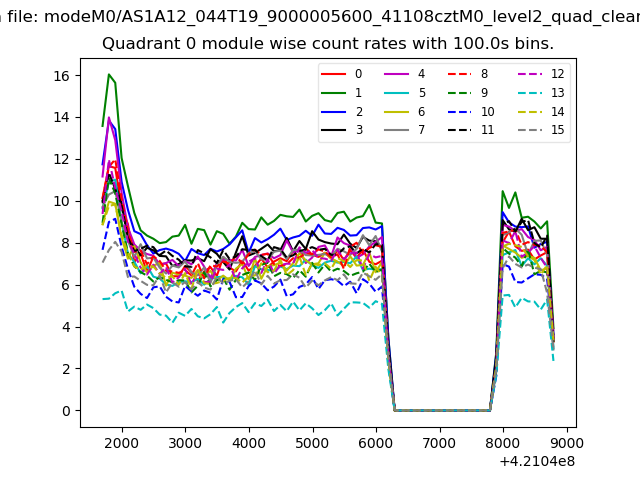 |
 |
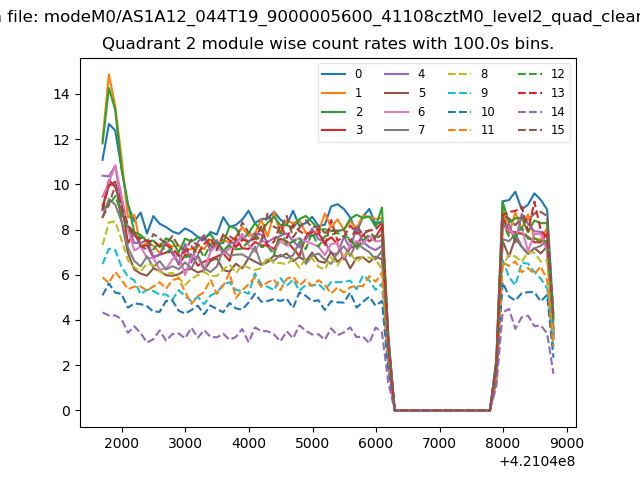
| Module-wise count rates for Quadrant B Data is divided into 100 sec bins |
 |
 |
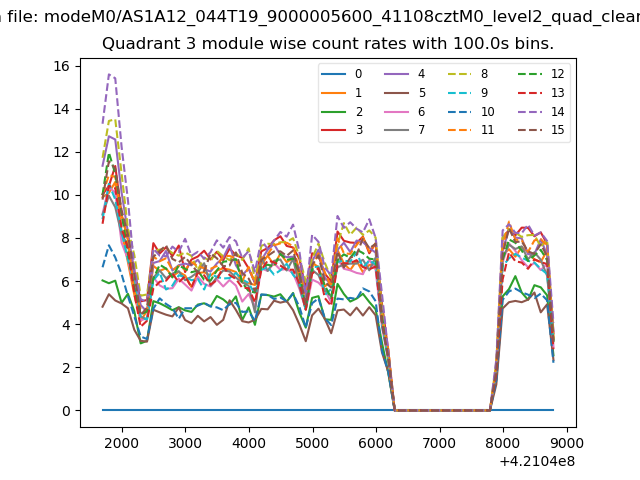
| Module-wise count rates for Quadrant C Data is divided into 100 sec bins |
 |
 |
| Module-wise count rates for Quadrant D Data is divided into 100 sec bins |
 |
 |
| Parameter | Plot |
|---|---|
| CZT HV Monitor | 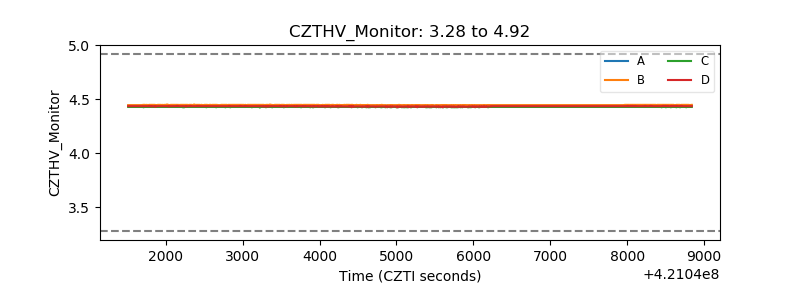 |
| D_VDD | 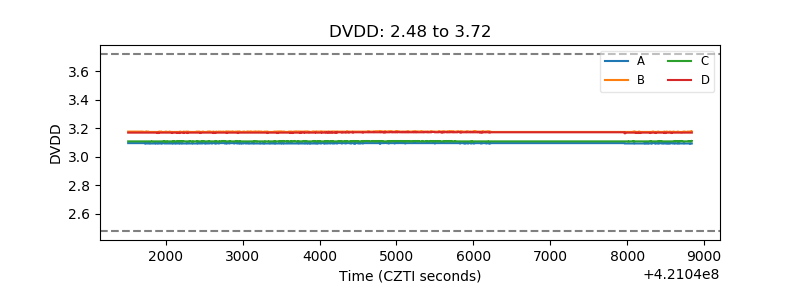 |
| Temperature 1 | 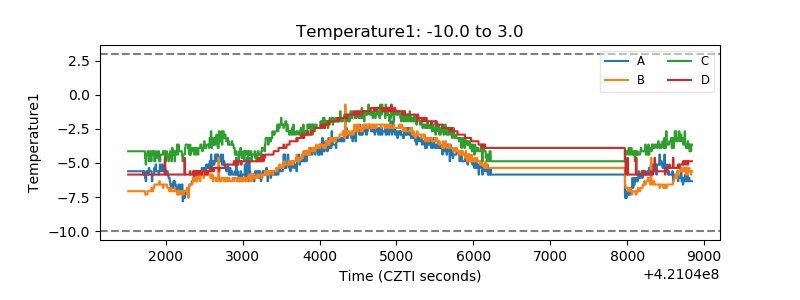 |
| Veto HV Monitor | 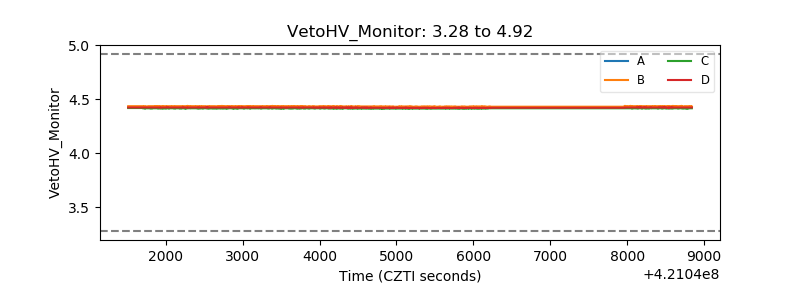 |
| Veto LLD | 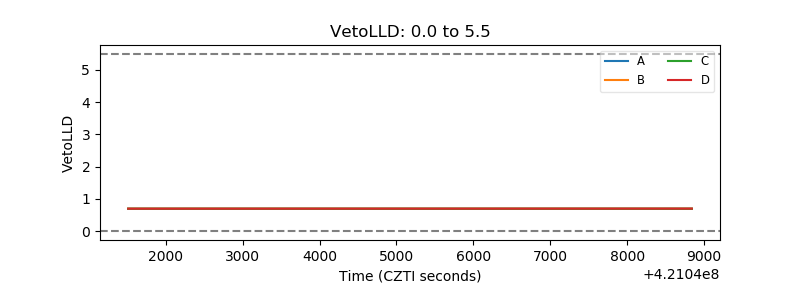 |
| Alpha Counter | 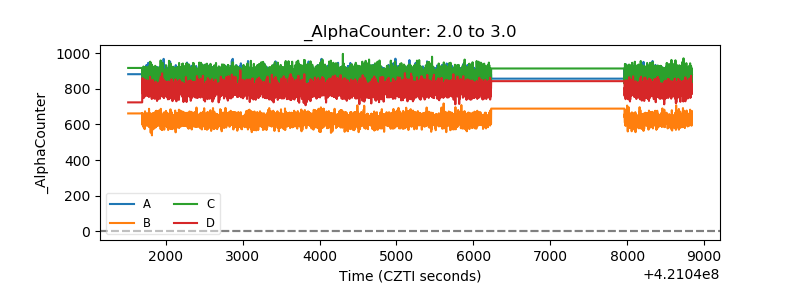 |
| _CPM_Rate | 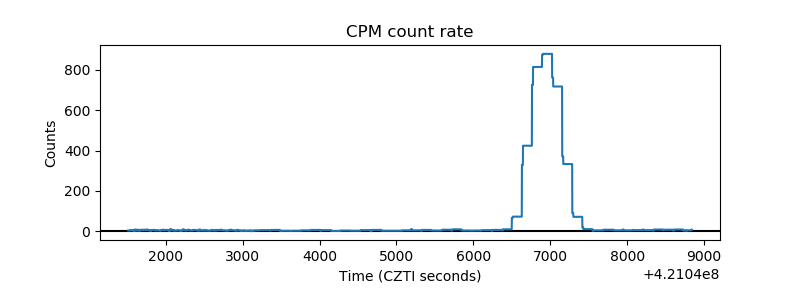 |
| CZT Counter | 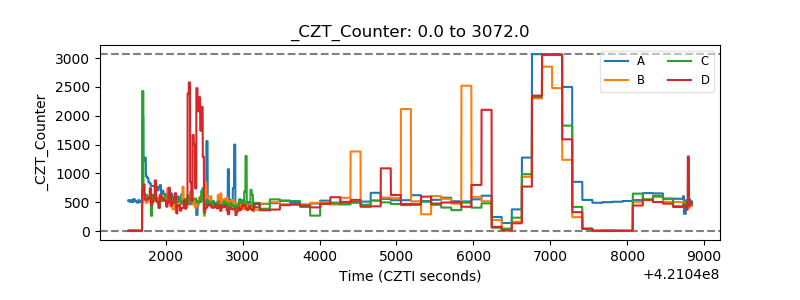 |
| +2.5 Volts monitor | 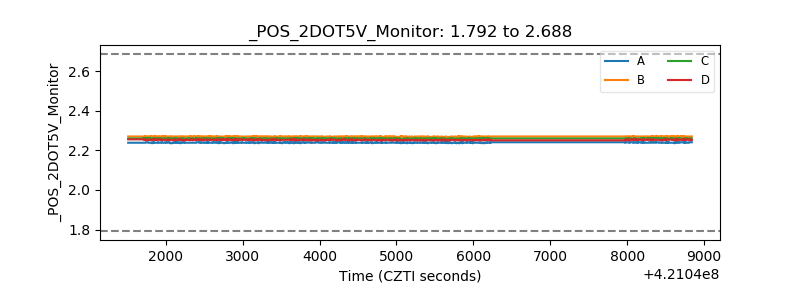 |
| +5 Volts monitor | 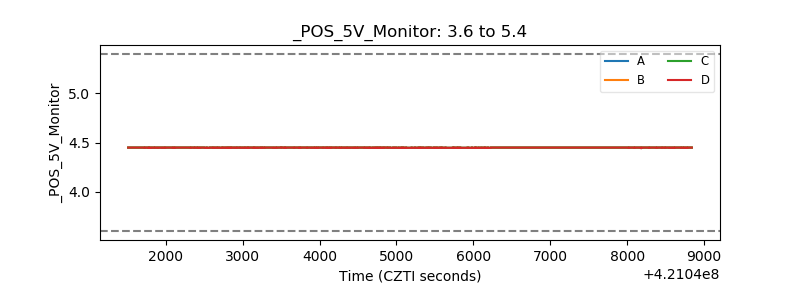 |
| _ROLL_ROT | 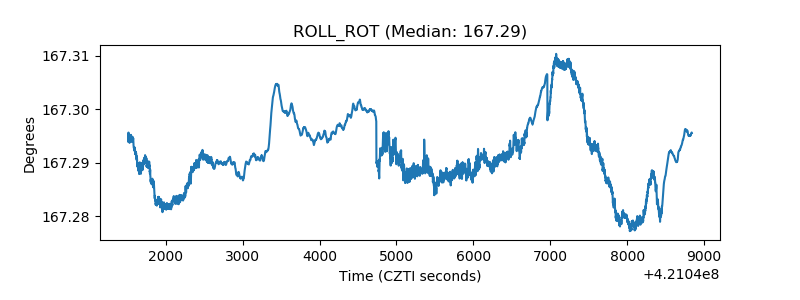 |
| _Roll_DEC | 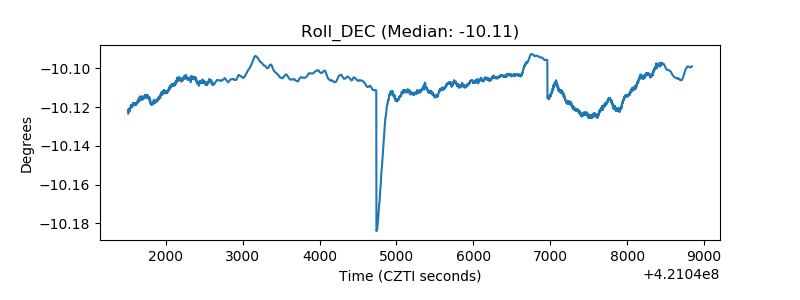 |
| _Roll_RA | 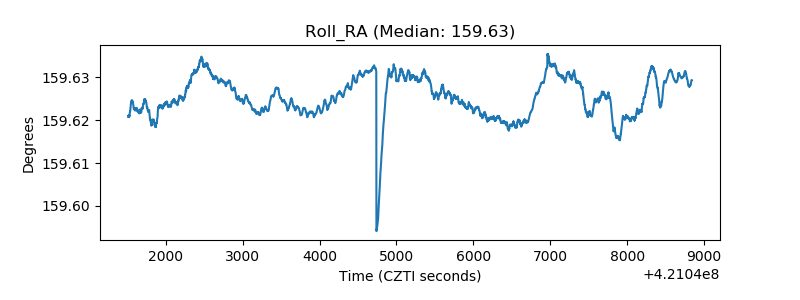 |
| Veto Counter | 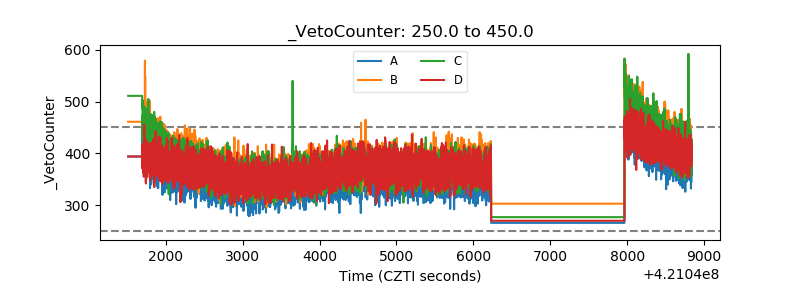 |