| Param | Original file | Final file |
|---|---|---|
| Filename | modeM0/AS1A12_044T19_9000005600_41110cztM0_level2.fits | modeM0/AS1A12_044T19_9000005600_41110cztM0_level2_quad_clean.evt |
| Size (bytes) | 342,544,320 | 89,697,600 |
| Size | 326.7 MB | 85.5 MB |
| Events in quadrant A | 2,893,545 | 617,251 |
| Events in quadrant B | 3,408,190 | 608,794 |
| Events in quadrant C | 2,793,523 | 590,272 |
| Events in quadrant D | 3,182,730 | 538,044 |
| Mode SS | |||
|---|---|---|---|
| Quadrant | BADHDUFLAG | Total packets | Discarded packets |
| A | 0 | 106 | 0 |
| B | 0 | 106 | 0 |
| C | 0 | 106 | 0 |
| D | 0 | 106 | 0 |
| Mode M0 | |||
|---|---|---|---|
| Quadrant | BADHDUFLAG | Total packets | Discarded packets |
| A | 0 | 11539 | 3 |
| B | 0 | 13325 | 2 |
| C | 0 | 11340 | 2 |
| D | 0 | 12862 | 2 |
| Mode M9 | |||
|---|---|---|---|
| Quadrant | BADHDUFLAG | Total packets | Discarded packets |
| A | 0 | 27 | 0 |
| B | 0 | 27 | 0 |
| C | 0 | 27 | 0 |
| D | 0 | 28 | 0 |
| Quadrant | Total seconds | Saturated seconds | Saturation percentage |
|---|---|---|---|
| A | 5160 | 20 | 0.387597% |
| B | 5160 | 298 | 5.775194% |
| C | 5160 | 51 | 0.988372% |
| D | 5160 | 131 | 2.538760% |
Noise dominated data is calculated using 1-second bins in cleaned event files. If a bin has >2000 counts, and if more than 50% of those come from <1% of pixels, then it is considered to be noise-dominated and hence unusable.
| Quadrant | # 1 sec bins | Bins with >0 counts | Bins with >2000 counts | High rate bins dominated by noise | Noise dominated (total time) | Noise dominated (detector-on time) | Marked lightcurve |
|---|---|---|---|---|---|---|---|
| A | 7013 | 5161 | 2 | 2 | 0.03% | 0.04% | 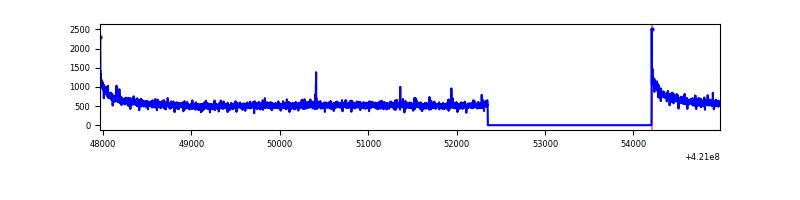 |
| B | 7013 | 5161 | 233 | 233 | 3.32% | 4.51% | 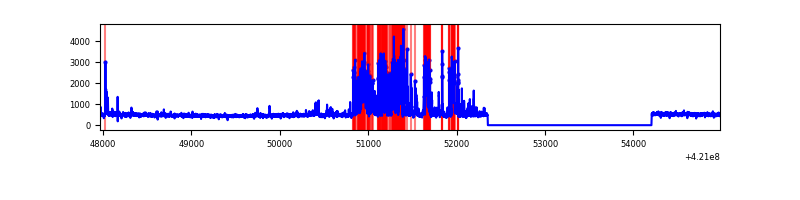 |
| C | 7013 | 5161 | 25 | 25 | 0.36% | 0.48% | 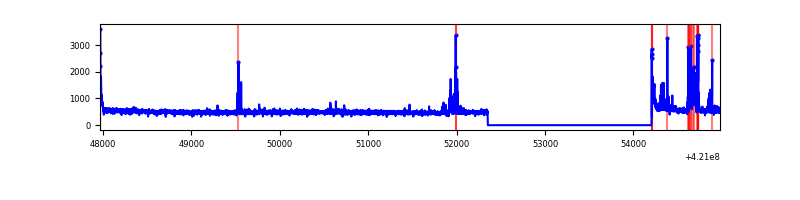 |
| D | 7013 | 5161 | 104 | 104 | 1.48% | 2.02% | 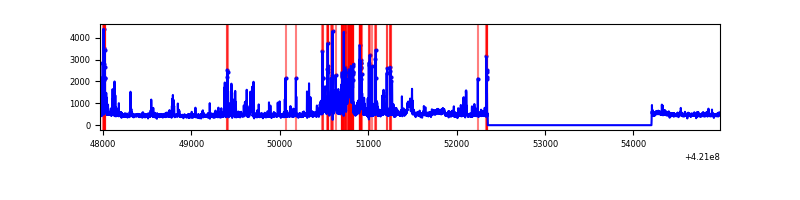 |
Top three noisy pixels from each quadrant. If the there are fewer than three noisy pixels in the level2.evt file, extra rows are filled as -1
| Pixel properties | Quadrant properties | ||||||
|---|---|---|---|---|---|---|---|
| Quadrant | DetID | PixID | Counts | Sigma | Mean | Median | Sigma |
| A | 10 | 83 | 503228 | 3989.56 | 613 | 602 | 126.0 |
| A | 2 | 79 | 8831 | 65.32 | 613 | 602 | 126.0 |
| A | 13 | 254 | 8375 | 61.7 | 613 | 602 | 126.0 |
| B | 0 | 245 | 908279 | 7864.03 | 597 | 582 | 115.4 |
| B | 0 | 186 | 44927 | 384.19 | 597 | 582 | 115.4 |
| B | 5 | 255 | 42495 | 363.12 | 597 | 582 | 115.4 |
| C | 15 | 214 | 226728 | 1632.3 | 589 | 593 | 138.5 |
| C | 14 | 254 | 200921 | 1446.02 | 589 | 593 | 138.5 |
| C | 0 | 10 | 63691 | 455.46 | 589 | 593 | 138.5 |
| D | 13 | 249 | 317367 | 2216.59 | 588 | 571 | 142.9 |
| D | 2 | 16 | 250548 | 1749.07 | 588 | 571 | 142.9 |
| D | 2 | 249 | 238405 | 1664.1 | 588 | 571 | 142.9 |
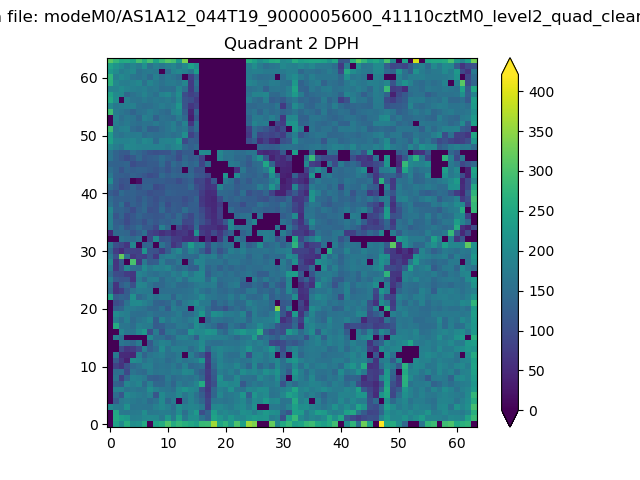
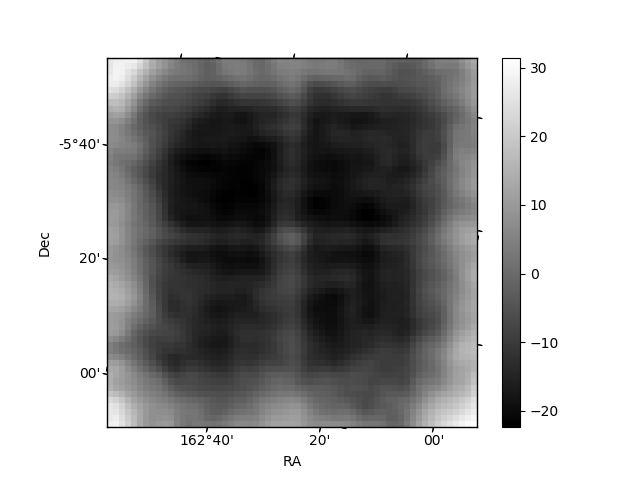
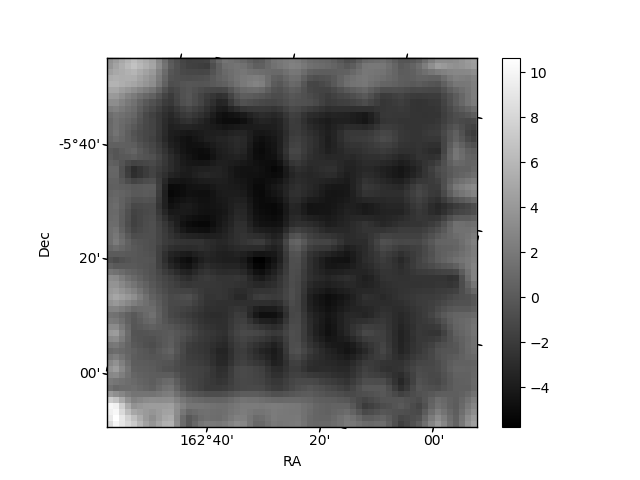
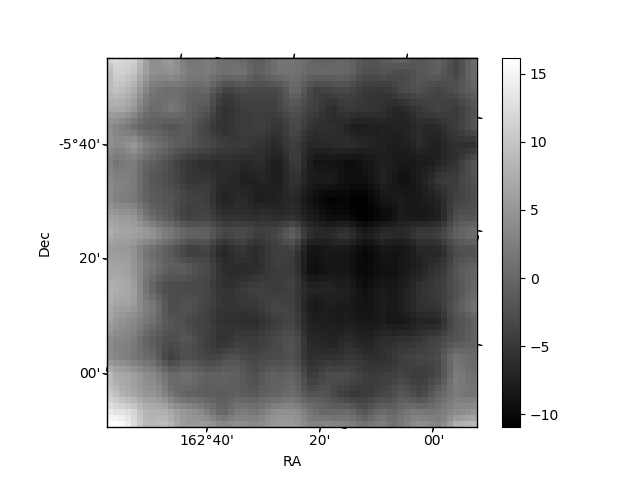
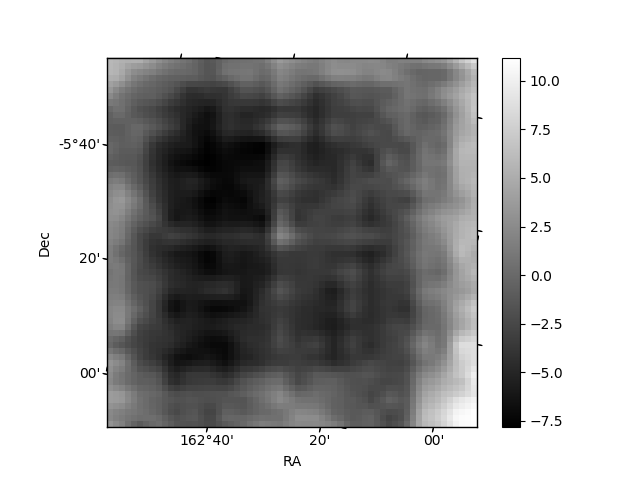
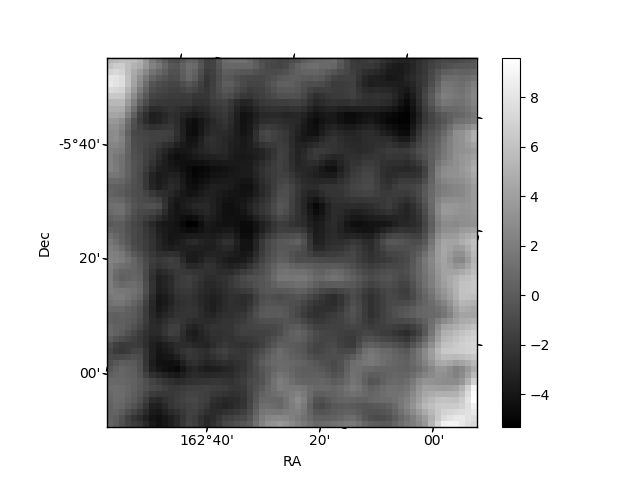
Histogram calculated using DETX and DETY for each event in the final _common_clean file
| Quadrant A | 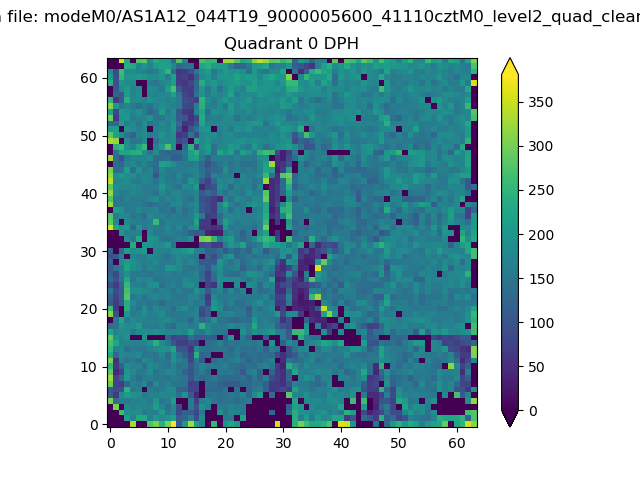 |
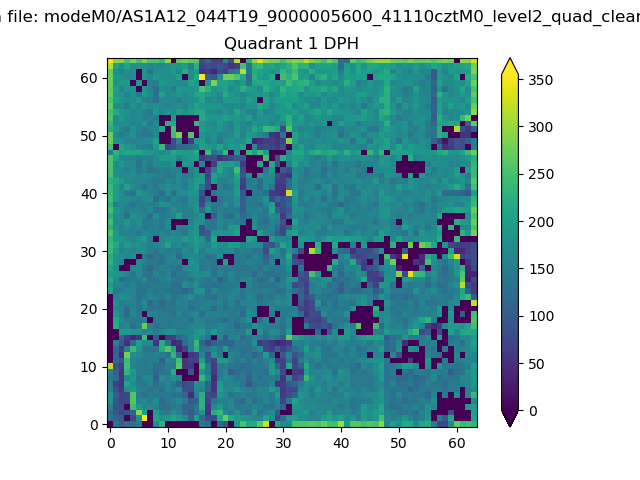 |
Quadrant B |
|---|---|---|---|
| Quadrant D | 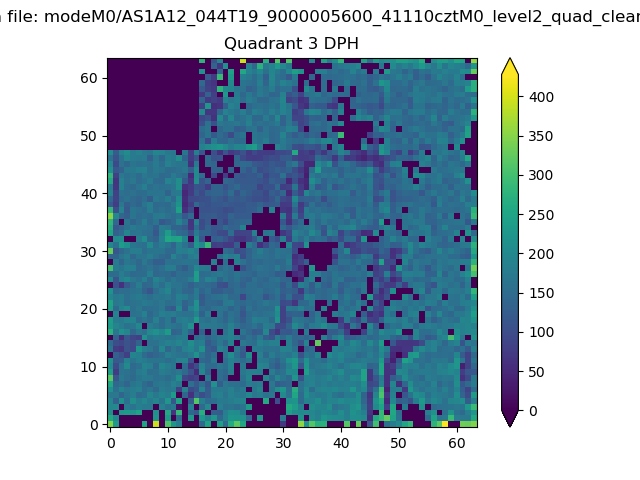 |
 |
Quadrant C |
| Plot type | Count rate plots | Images |
|---|---|---|
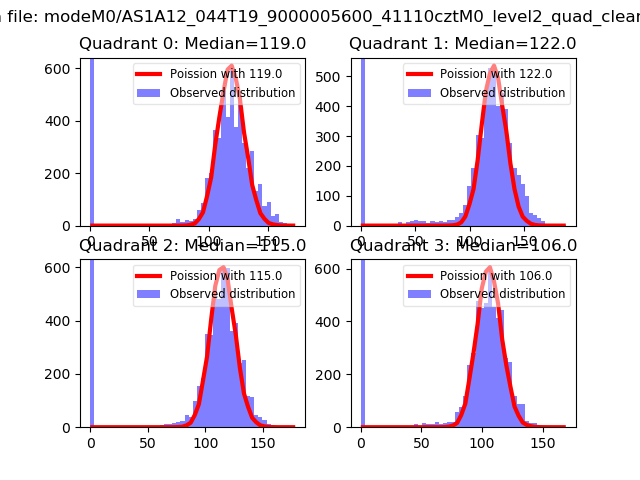
| Comparison with Poisson distribution Blue bars denote a histogram of data divided into 1 sec bins. Red curve is a Poisson curve with rate = median count rate of data. |
 |
 |
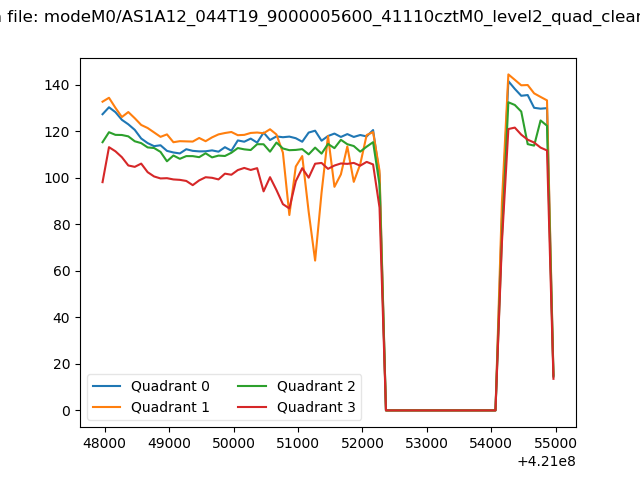
| Quadrant-wise count rates Data is divided into 100 sec bins |
 |
|
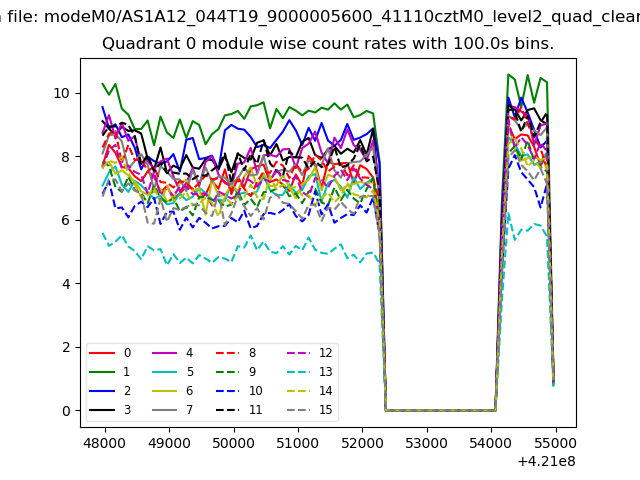
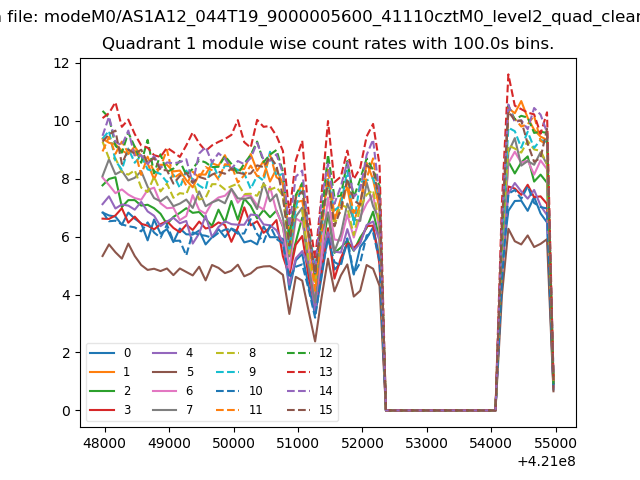
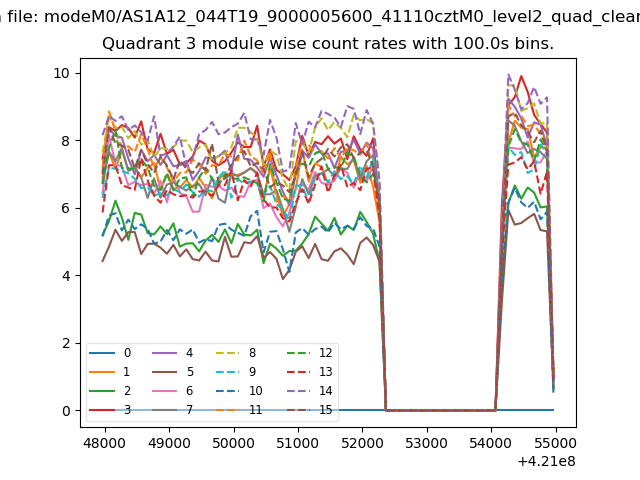
| Module-wise count rates for Quadrant A Data is divided into 100 sec bins |
 |
 |
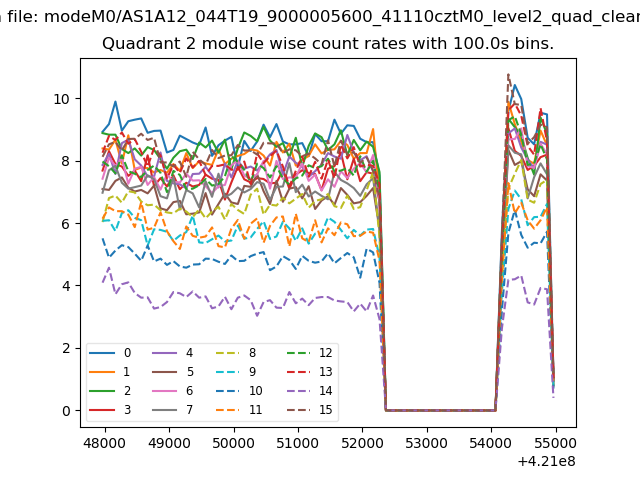
| Module-wise count rates for Quadrant B Data is divided into 100 sec bins |
 |
 |
| Module-wise count rates for Quadrant C Data is divided into 100 sec bins |
 |
 |
| Module-wise count rates for Quadrant D Data is divided into 100 sec bins |
 |
 |
| Parameter | Plot |
|---|---|
| CZT HV Monitor | 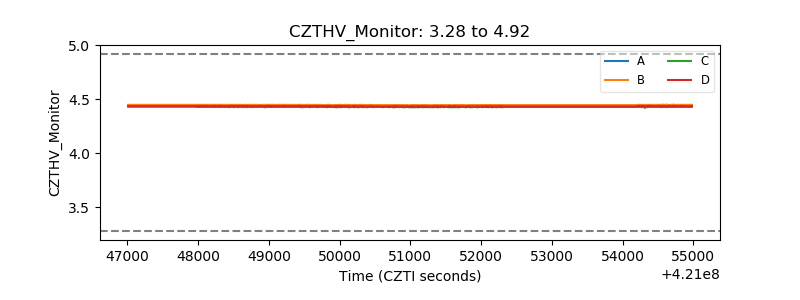 |
| D_VDD | 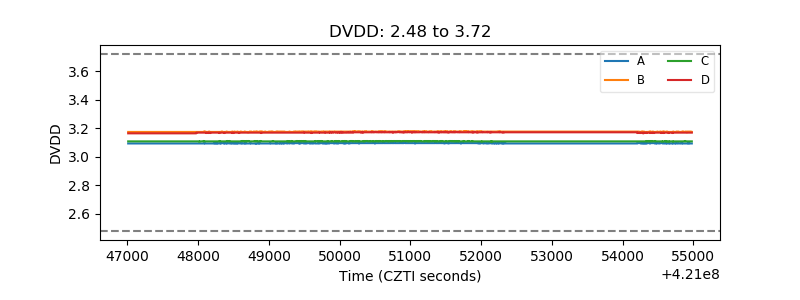 |
| Temperature 1 | 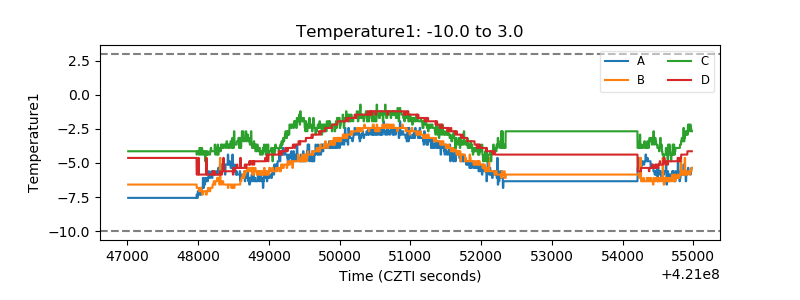 |
| Veto HV Monitor | 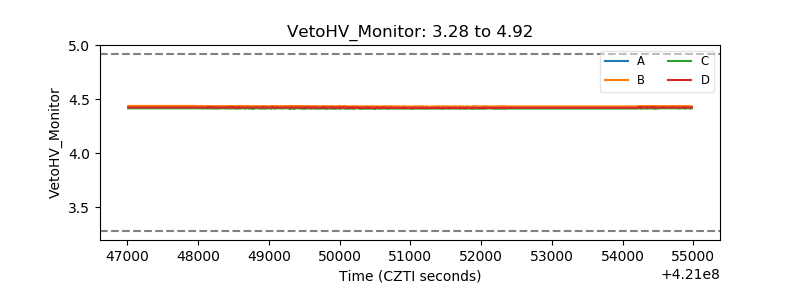 |
| Veto LLD | 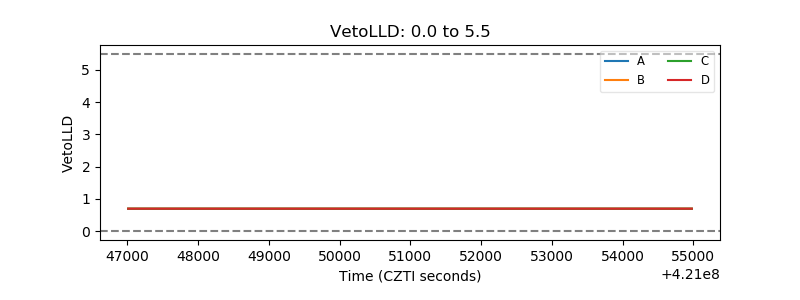 |
| Alpha Counter | 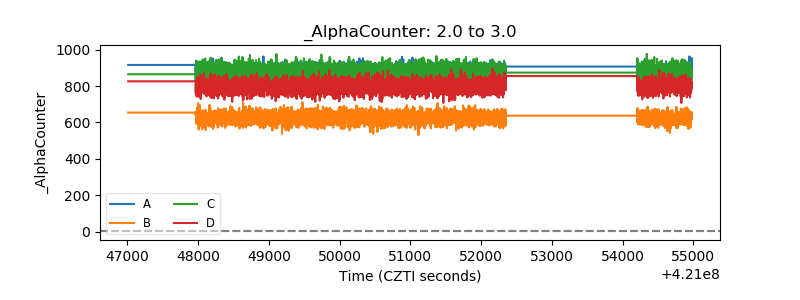 |
| _CPM_Rate |  |
| CZT Counter | 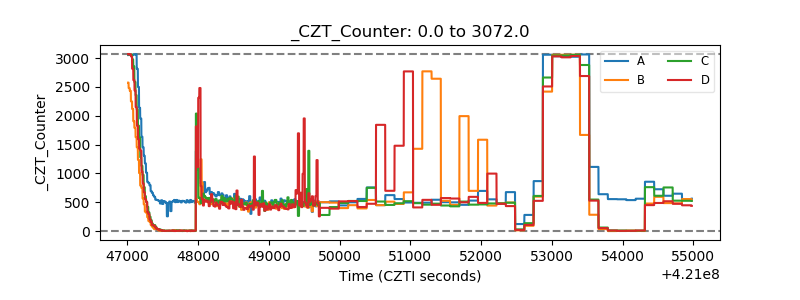 |
| +2.5 Volts monitor | 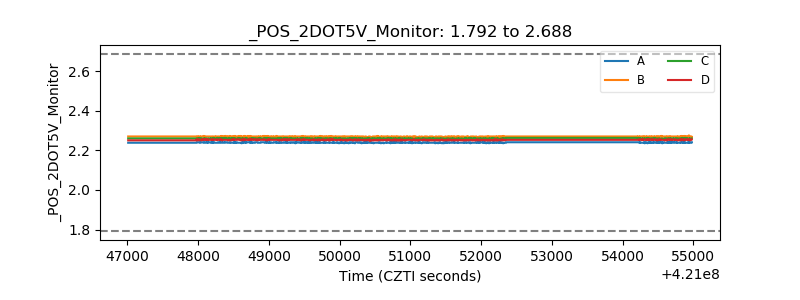 |
| +5 Volts monitor | 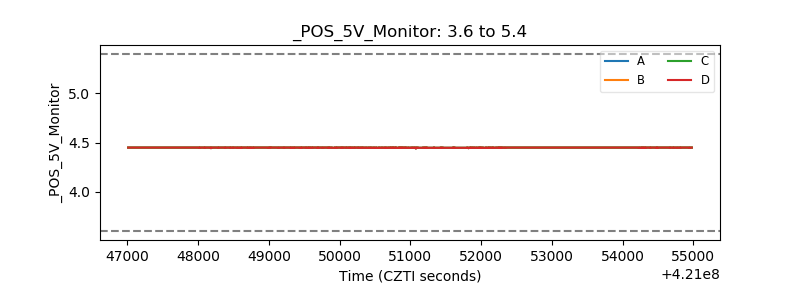 |
| _ROLL_ROT | 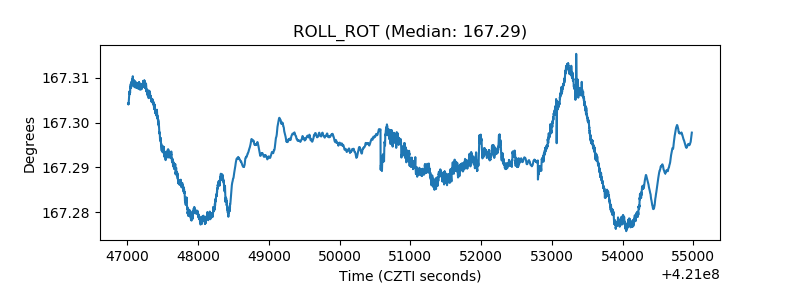 |
| _Roll_DEC | 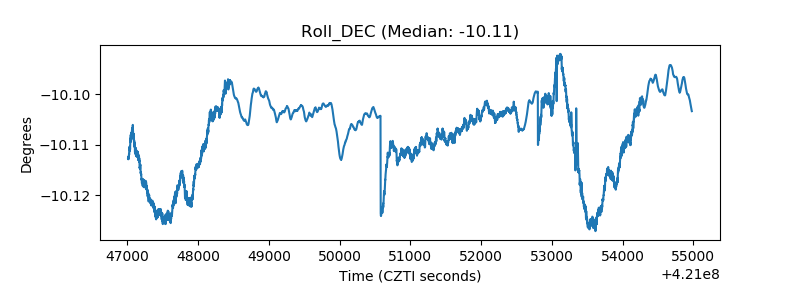 |
| _Roll_RA | 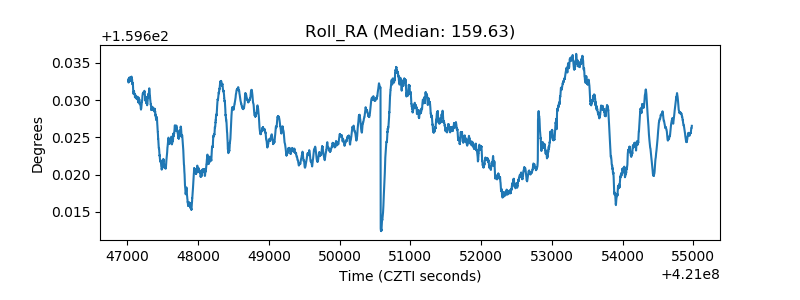 |
| Veto Counter | 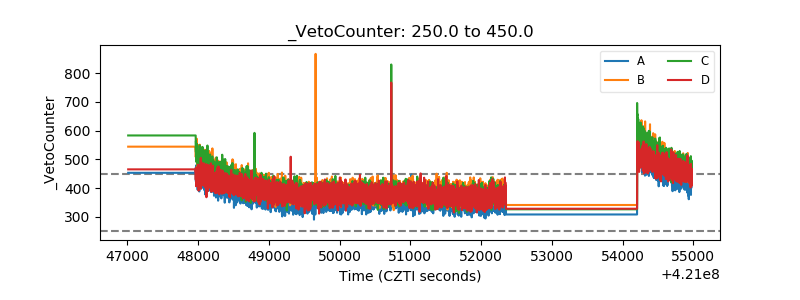 |