| Param | Original file | Final file |
|---|---|---|
| Filename | modeM0/AS1A12_044T19_9000005600_41111cztM0_level2.fits | modeM0/AS1A12_044T19_9000005600_41111cztM0_level2_quad_clean.evt |
| Size (bytes) | 208,172,160 | 60,264,000 |
| Size | 198.5 MB | 57.5 MB |
| Events in quadrant A | 1,870,674 | 413,717 |
| Events in quadrant B | 1,643,497 | 424,248 |
| Events in quadrant C | 1,886,971 | 392,782 |
| Events in quadrant D | 2,045,763 | 359,682 |
| Mode SS | |||
|---|---|---|---|
| Quadrant | BADHDUFLAG | Total packets | Discarded packets |
| A | 0 | 66 | 0 |
| B | 0 | 66 | 0 |
| C | 0 | 66 | 0 |
| D | 0 | 66 | 0 |
| Mode M0 | |||
|---|---|---|---|
| Quadrant | BADHDUFLAG | Total packets | Discarded packets |
| A | 0 | 7365 | 1 |
| B | 0 | 6859 | 1 |
| C | 0 | 7555 | 1 |
| D | 0 | 8173 | 1 |
| Mode M9 | |||
|---|---|---|---|
| Quadrant | BADHDUFLAG | Total packets | Discarded packets |
| A | 0 | 11 | 0 |
| B | 0 | 11 | 0 |
| C | 0 | 11 | 0 |
| D | 0 | 12 | 0 |
| Quadrant | Total seconds | Saturated seconds | Saturation percentage |
|---|---|---|---|
| A | 3305 | 13 | 0.393343% |
| B | 3305 | 15 | 0.453858% |
| C | 3305 | 42 | 1.270802% |
| D | 3305 | 87 | 2.632375% |
Noise dominated data is calculated using 1-second bins in cleaned event files. If a bin has >2000 counts, and if more than 50% of those come from <1% of pixels, then it is considered to be noise-dominated and hence unusable.
| Quadrant | # 1 sec bins | Bins with >0 counts | Bins with >2000 counts | High rate bins dominated by noise | Noise dominated (total time) | Noise dominated (detector-on time) | Marked lightcurve |
|---|---|---|---|---|---|---|---|
| A | 3305 | 3305 | 1 | 1 | 0.03% | 0.03% | 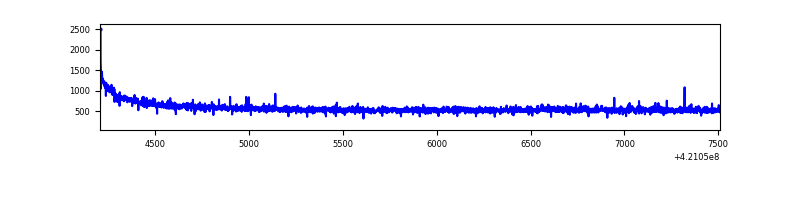 |
| B | 3305 | 3305 | 11 | 11 | 0.33% | 0.33% | 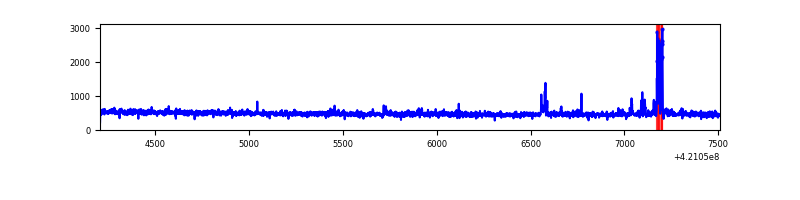 |
| C | 3305 | 3305 | 20 | 20 | 0.61% | 0.61% | 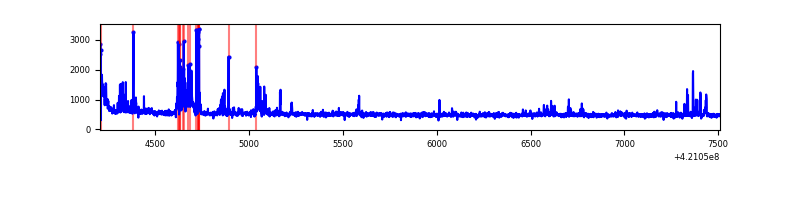 |
| D | 3305 | 3305 | 81 | 81 | 2.45% | 2.45% | 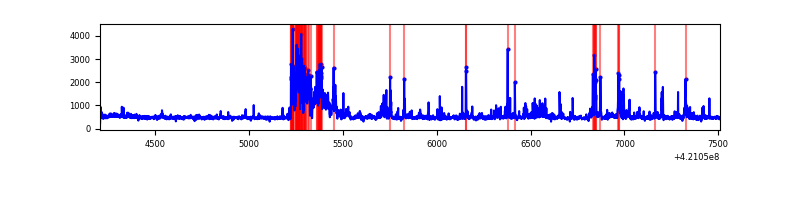 |
Top three noisy pixels from each quadrant. If the there are fewer than three noisy pixels in the level2.evt file, extra rows are filled as -1
| Pixel properties | Quadrant properties | ||||||
|---|---|---|---|---|---|---|---|
| Quadrant | DetID | PixID | Counts | Sigma | Mean | Median | Sigma |
| A | 10 | 83 | 295690 | 3541.97 | 403 | 395 | 83.4 |
| A | 2 | 79 | 13400 | 155.99 | 403 | 395 | 83.4 |
| A | 13 | 254 | 5537 | 61.68 | 403 | 395 | 83.4 |
| B | 0 | 245 | 70375 | 907.84 | 395 | 385 | 77.1 |
| B | 0 | 190 | 11772 | 147.7 | 395 | 385 | 77.1 |
| B | 12 | 111 | 9569 | 119.13 | 395 | 385 | 77.1 |
| C | 14 | 254 | 202612 | 2237.98 | 383 | 385 | 90.4 |
| C | 15 | 214 | 143004 | 1578.32 | 383 | 385 | 90.4 |
| C | 0 | 10 | 35261 | 385.96 | 383 | 385 | 90.4 |
| D | 2 | 249 | 382294 | 4050.83 | 387 | 377 | 94.3 |
| D | 13 | 249 | 70725 | 746.15 | 387 | 377 | 94.3 |
| D | 6 | 239 | 40954 | 430.38 | 387 | 377 | 94.3 |
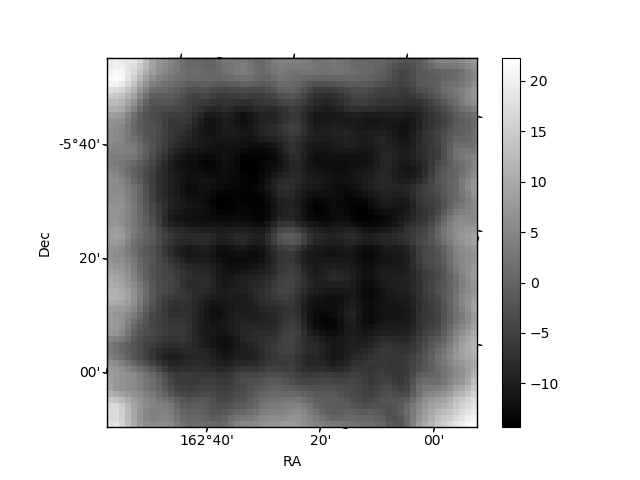
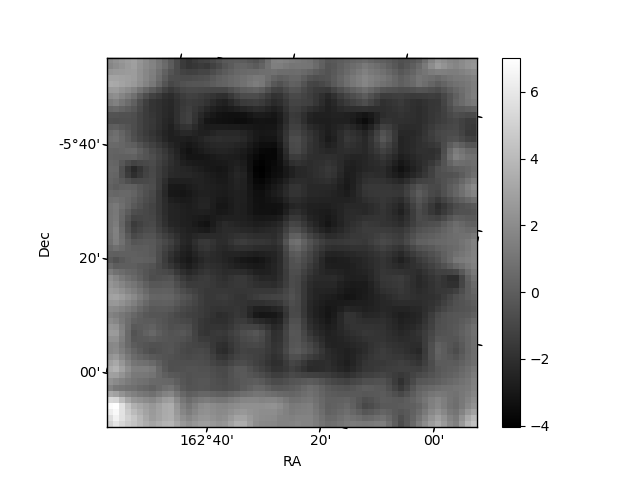
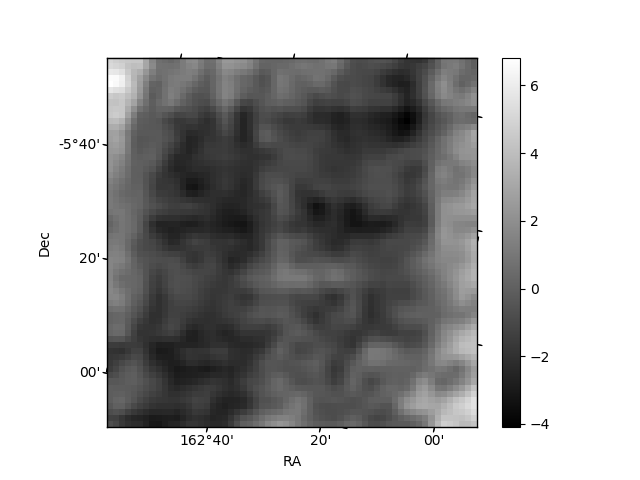
Histogram calculated using DETX and DETY for each event in the final _common_clean file
| Quadrant A | 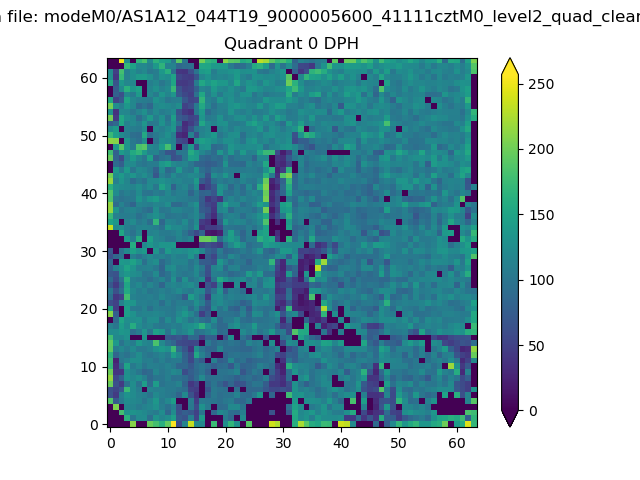 |
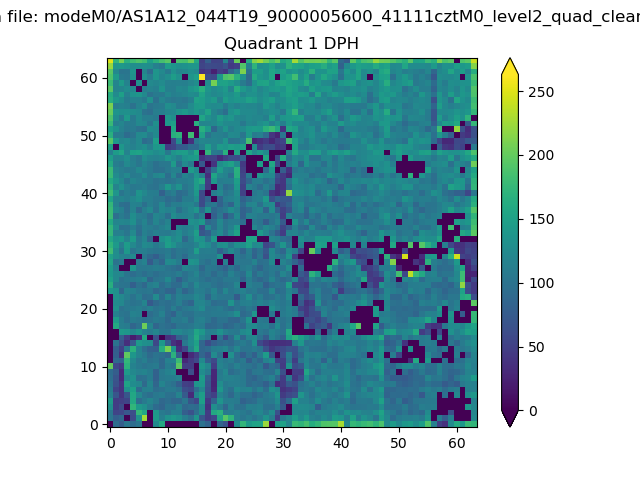 |
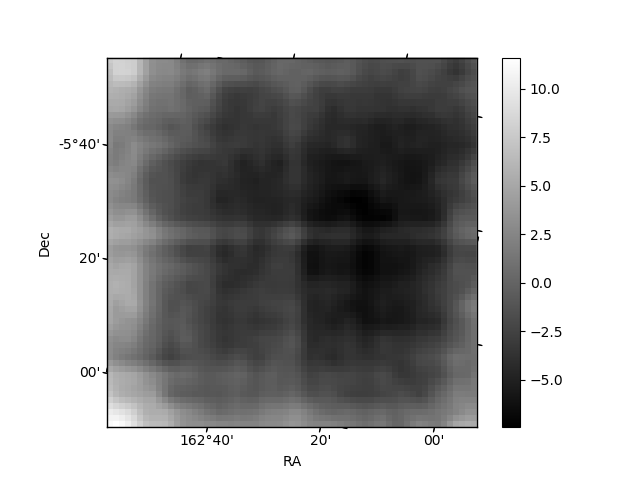
Quadrant B |
|---|---|---|---|
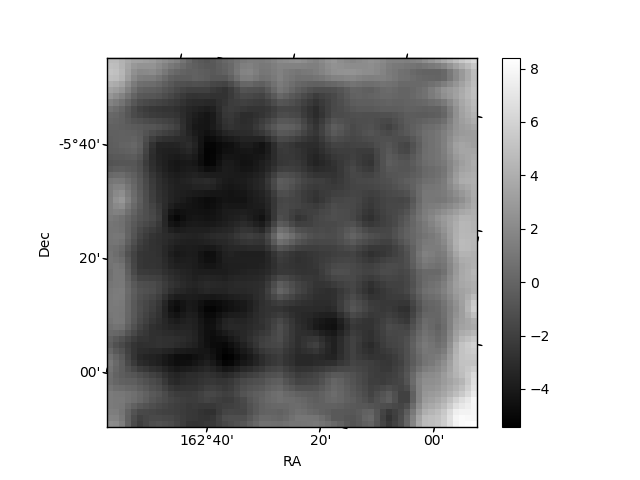
| Quadrant D | 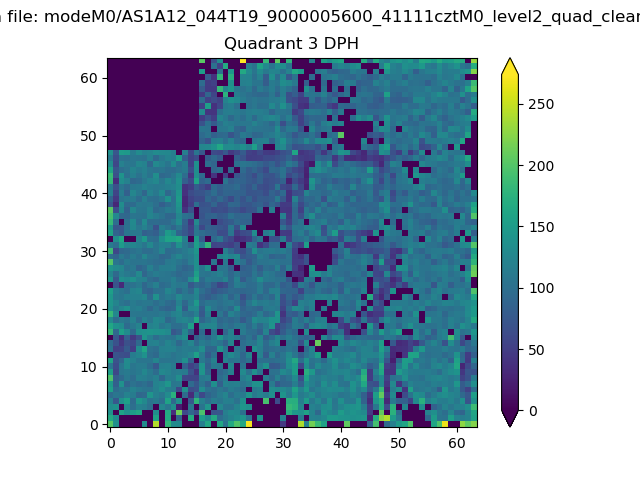 |
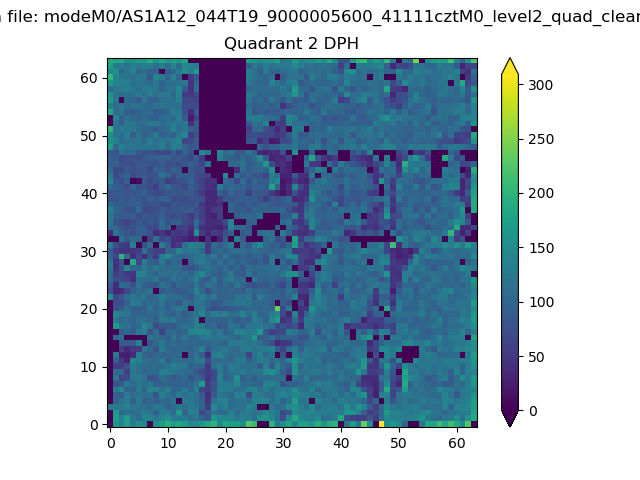 |
Quadrant C |
| Plot type | Count rate plots | Images |
|---|---|---|
| Comparison with Poisson distribution Blue bars denote a histogram of data divided into 1 sec bins. Red curve is a Poisson curve with rate = median count rate of data. |
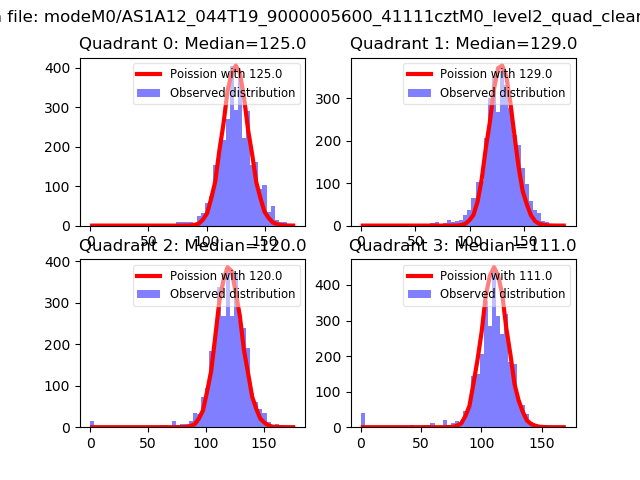 |
 |
| Quadrant-wise count rates Data is divided into 100 sec bins |
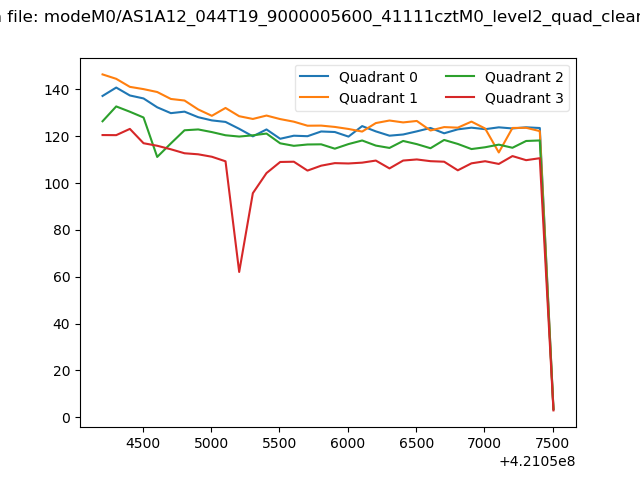 |
|
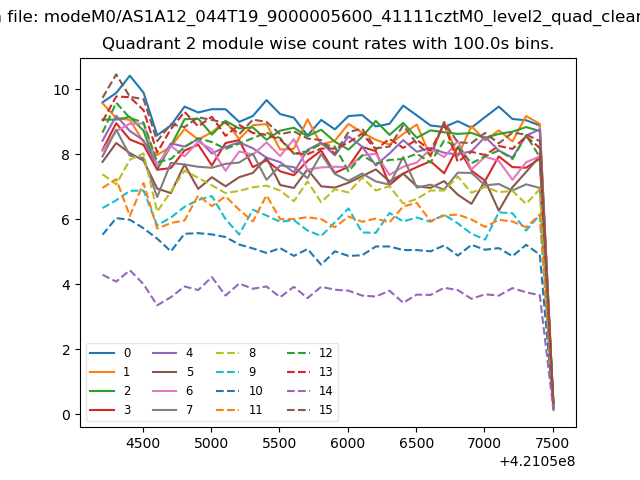
| Module-wise count rates for Quadrant A Data is divided into 100 sec bins |
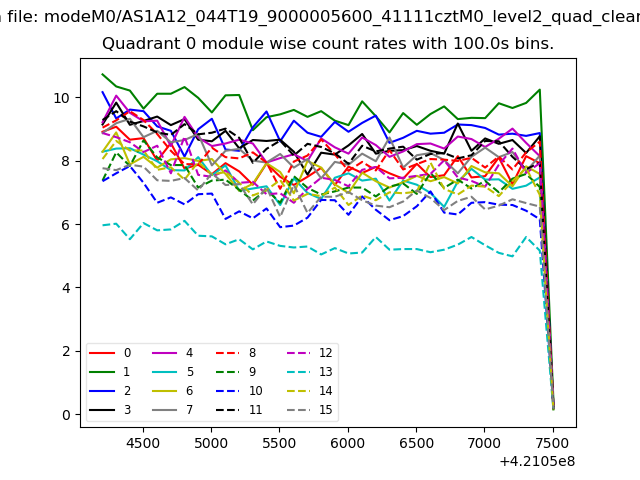 |
 |
| Module-wise count rates for Quadrant B Data is divided into 100 sec bins |
 |
 |
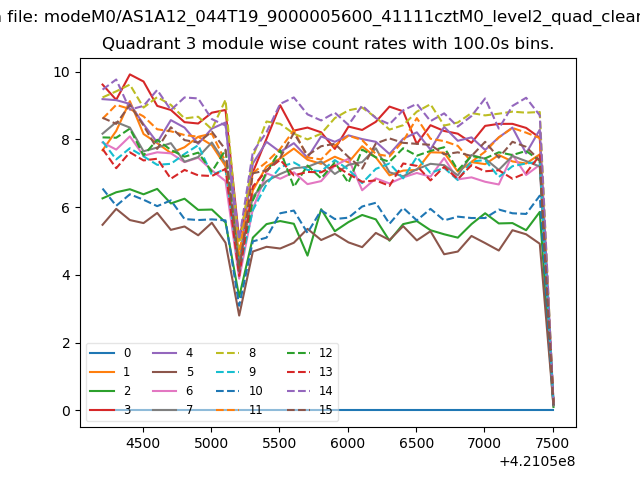
| Module-wise count rates for Quadrant C Data is divided into 100 sec bins |
 |
 |
| Module-wise count rates for Quadrant D Data is divided into 100 sec bins |
 |
 |
| Parameter | Plot |
|---|---|
| CZT HV Monitor | 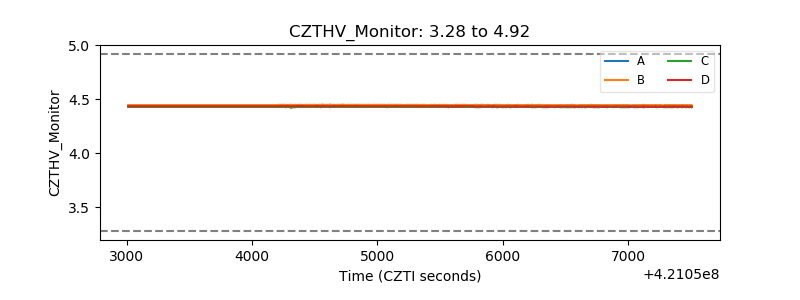 |
| D_VDD | 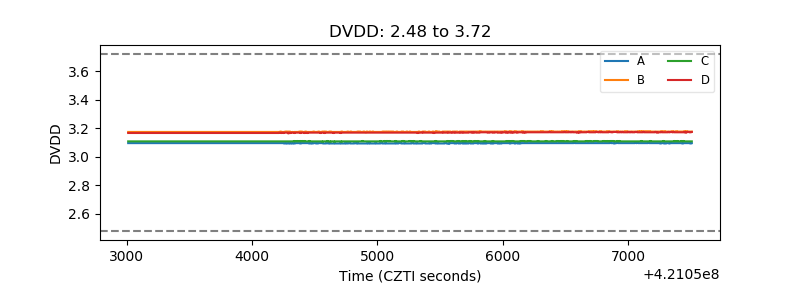 |
| Temperature 1 | 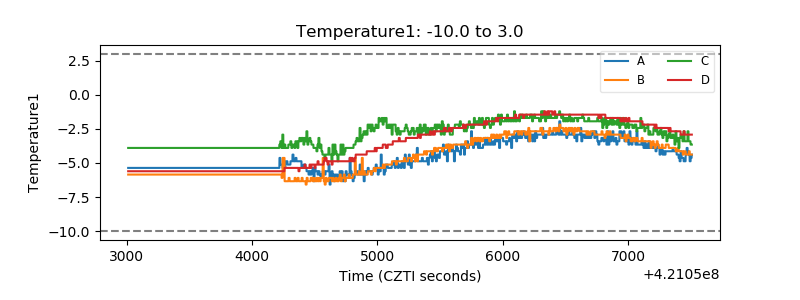 |
| Veto HV Monitor | 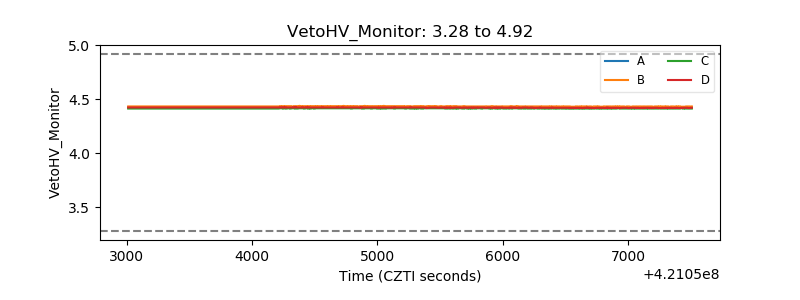 |
| Veto LLD | 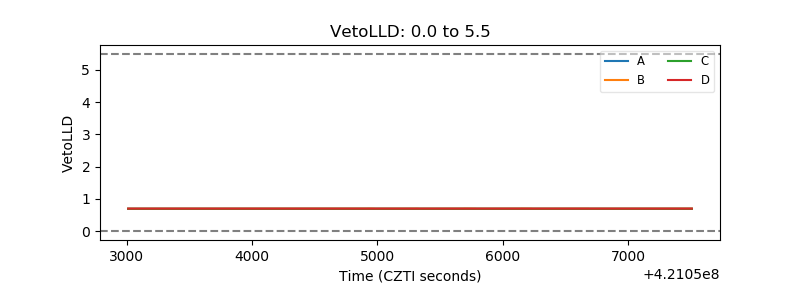 |
| Alpha Counter |  |
| _CPM_Rate | 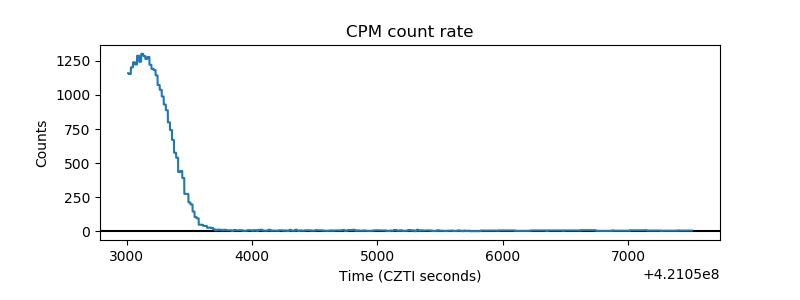 |
| CZT Counter | 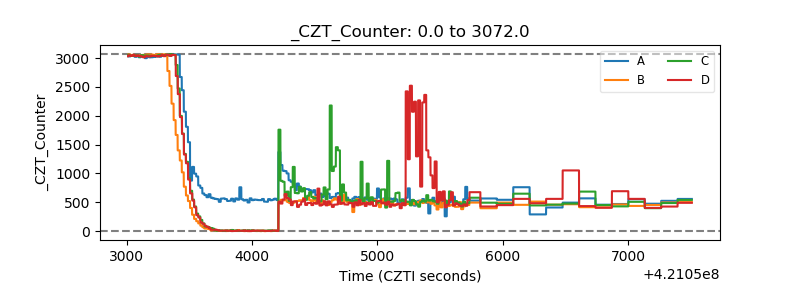 |
| +2.5 Volts monitor | 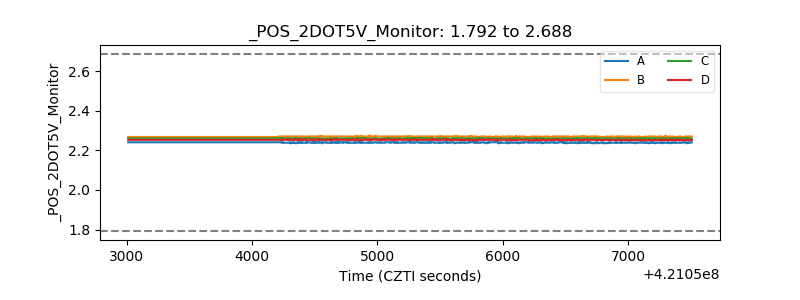 |
| +5 Volts monitor |  |
| _ROLL_ROT | 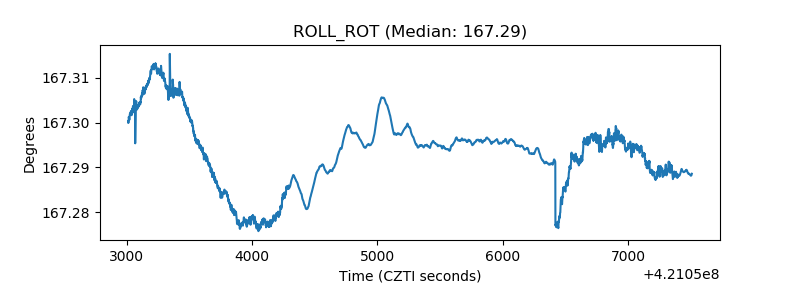 |
| _Roll_DEC | 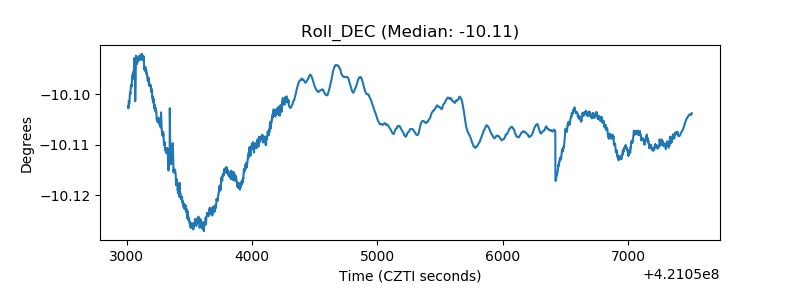 |
| _Roll_RA | 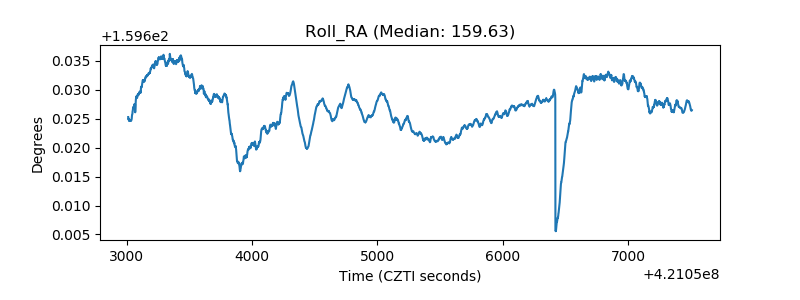 |
| Veto Counter | 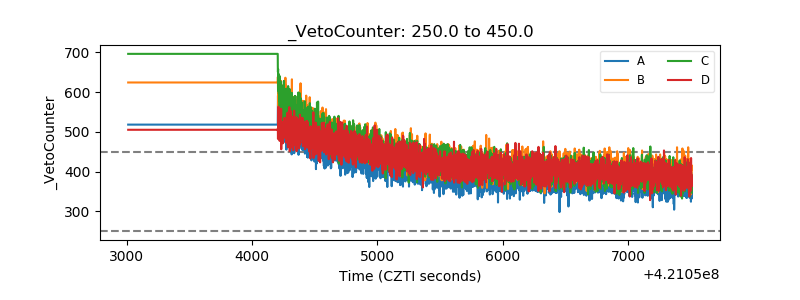 |