| Param | Original file | Final file |
|---|---|---|
| Filename | modeM0/AS1A12_052T04_9000005602_41112cztM0_level2.fits | modeM0/AS1A12_052T04_9000005602_41112cztM0_level2_quad_clean.evt |
| Size (bytes) | 324,017,280 | 97,695,360 |
| Size | 309.0 MB | 93.2 MB |
| Events in quadrant A | 3,058,357 | 667,268 |
| Events in quadrant B | 2,736,892 | 676,651 |
| Events in quadrant C | 2,780,822 | 644,818 |
| Events in quadrant D | 3,006,385 | 599,746 |
| Mode M0 | |||
|---|---|---|---|
| Quadrant | BADHDUFLAG | Total packets | Discarded packets |
| A | 0 | 12118 | 3 |
| B | 0 | 11379 | 2 |
| C | 0 | 11234 | 2 |
| D | 0 | 12224 | 2 |
| Mode M9 | |||
|---|---|---|---|
| Quadrant | BADHDUFLAG | Total packets | Discarded packets |
| A | 0 | 21 | 0 |
| B | 0 | 21 | 0 |
| C | 0 | 21 | 0 |
| D | 0 | 22 | 0 |
| Mode SS | |||
|---|---|---|---|
| Quadrant | BADHDUFLAG | Total packets | Discarded packets |
| A | 0 | 108 | 0 |
| B | 0 | 108 | 0 |
| C | 0 | 108 | 0 |
| D | 0 | 108 | 0 |
| Quadrant | Total seconds | Saturated seconds | Saturation percentage |
|---|---|---|---|
| A | 5283 | 10 | 0.189286% |
| B | 5283 | 40 | 0.757146% |
| C | 5283 | 27 | 0.511073% |
| D | 5283 | 62 | 1.173576% |
Noise dominated data is calculated using 1-second bins in cleaned event files. If a bin has >2000 counts, and if more than 50% of those come from <1% of pixels, then it is considered to be noise-dominated and hence unusable.
| Quadrant | # 1 sec bins | Bins with >0 counts | Bins with >2000 counts | High rate bins dominated by noise | Noise dominated (total time) | Noise dominated (detector-on time) | Marked lightcurve |
|---|---|---|---|---|---|---|---|
| A | 7346 | 5284 | 4 | 4 | 0.05% | 0.08% | 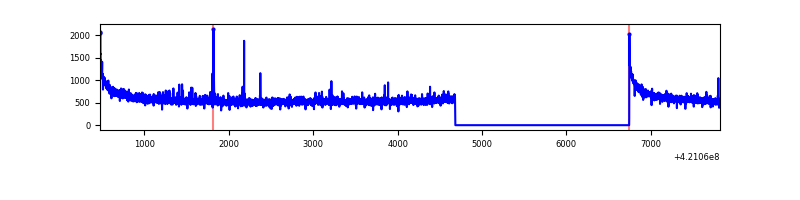 |
| B | 7346 | 5284 | 24 | 24 | 0.33% | 0.45% | 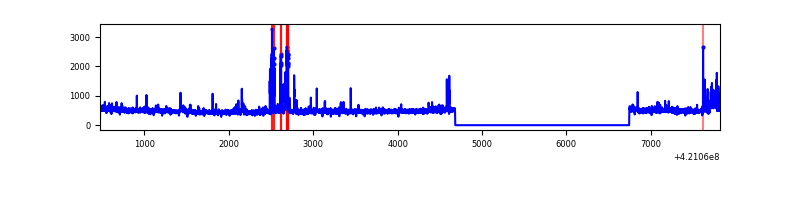 |
| C | 7346 | 5284 | 19 | 19 | 0.26% | 0.36% | 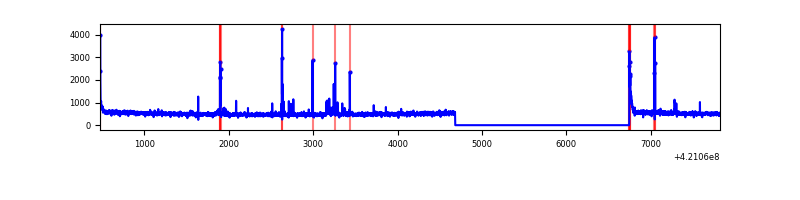 |
| D | 7346 | 5284 | 45 | 45 | 0.61% | 0.85% | 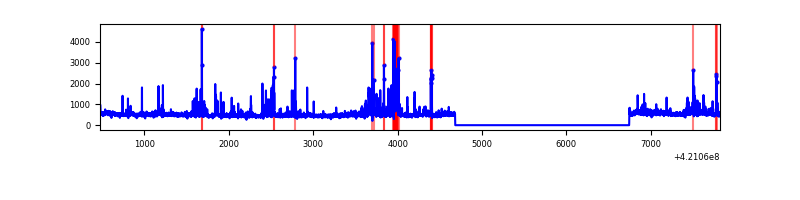 |
Top three noisy pixels from each quadrant. If the there are fewer than three noisy pixels in the level2.evt file, extra rows are filled as -1
| Pixel properties | Quadrant properties | ||||||
|---|---|---|---|---|---|---|---|
| Quadrant | DetID | PixID | Counts | Sigma | Mean | Median | Sigma |
| A | 10 | 83 | 518302 | 4010.47 | 638 | 628 | 129.1 |
| A | 2 | 79 | 38200 | 291.07 | 638 | 628 | 129.1 |
| A | 14 | 235 | 12664 | 93.24 | 638 | 628 | 129.1 |
| B | 0 | 245 | 186496 | 1574.73 | 625 | 610 | 118.0 |
| B | 0 | 190 | 54336 | 455.14 | 625 | 610 | 118.0 |
| B | 0 | 186 | 26154 | 216.4 | 625 | 610 | 118.0 |
| C | 15 | 214 | 229358 | 1639.98 | 611 | 616 | 139.5 |
| C | 14 | 254 | 91980 | 655.04 | 611 | 616 | 139.5 |
| C | 0 | 10 | 58058 | 411.83 | 611 | 616 | 139.5 |
| D | 2 | 249 | 303531 | 2027.14 | 620 | 605 | 149.4 |
| D | 13 | 249 | 115238 | 767.11 | 620 | 605 | 149.4 |
| D | 9 | 49 | 75112 | 498.59 | 620 | 605 | 149.4 |
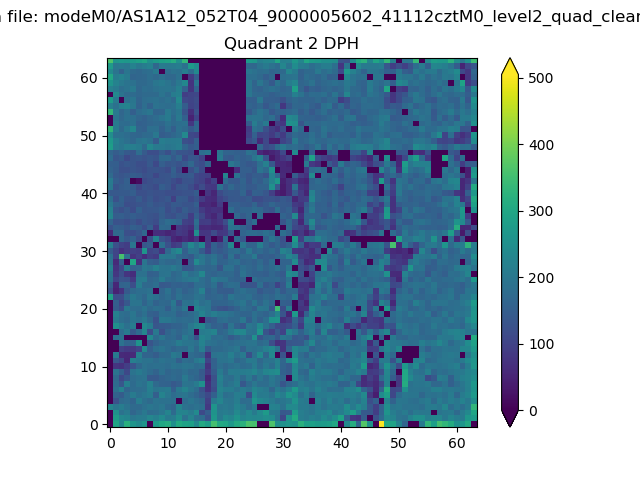
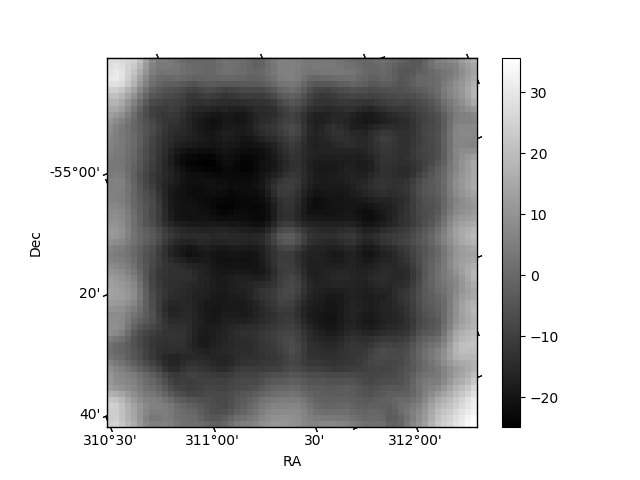
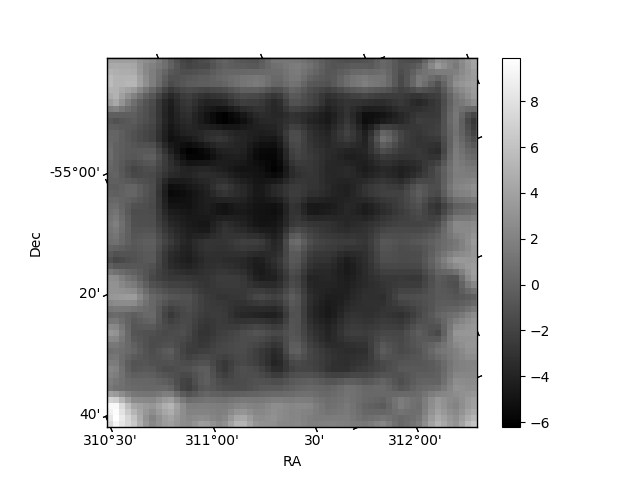
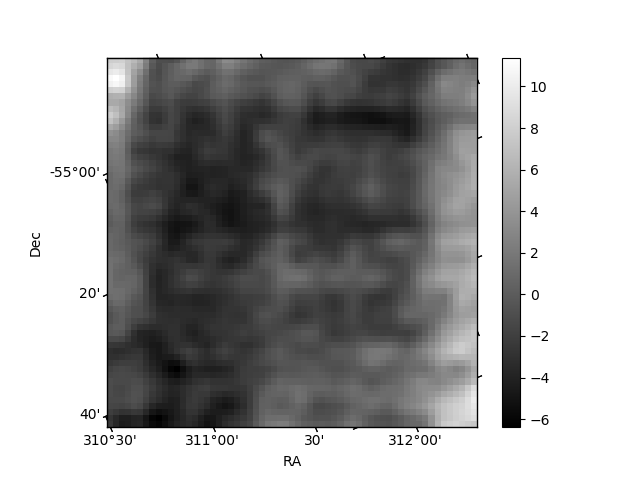
Histogram calculated using DETX and DETY for each event in the final _common_clean file
| Quadrant A | 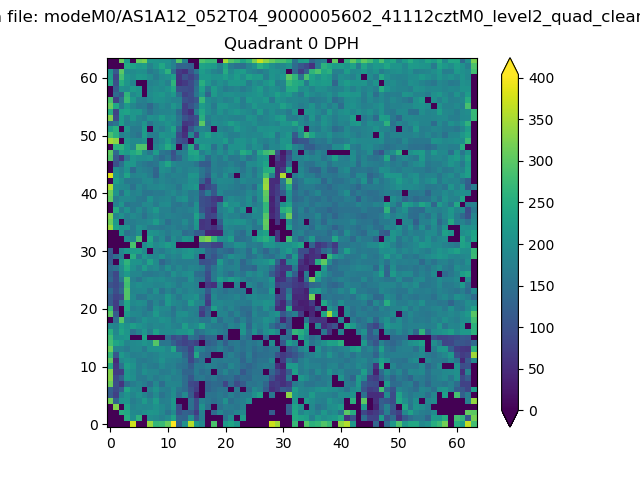 |
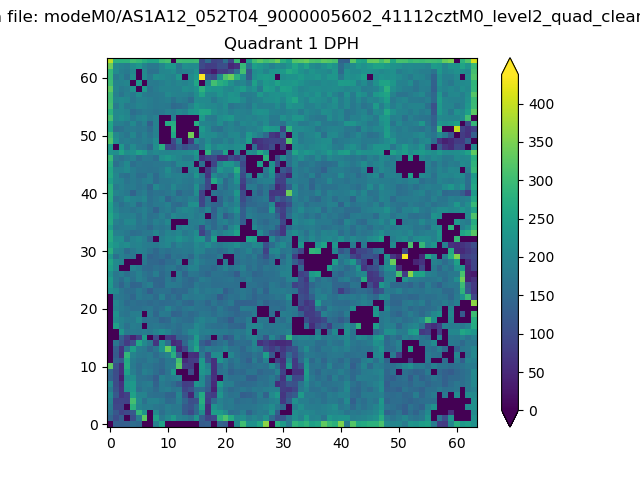 |
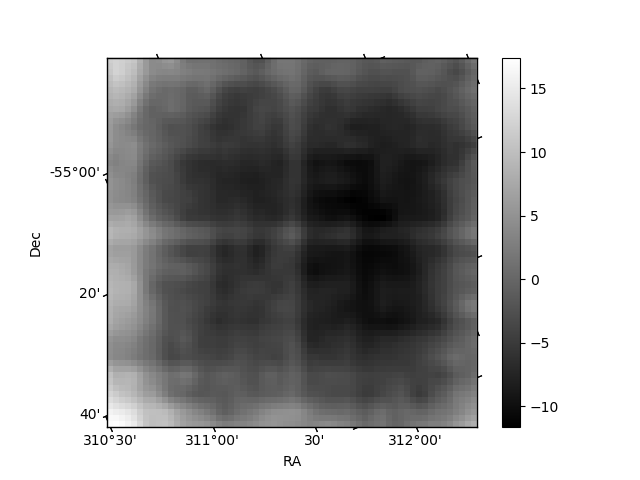
Quadrant B |
|---|---|---|---|
| Quadrant D | 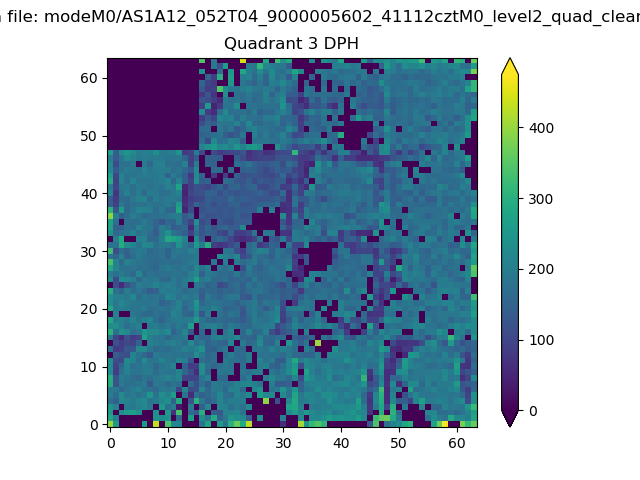 |
 |
Quadrant C |
| Plot type | Count rate plots | Images |
|---|---|---|
| Comparison with Poisson distribution Blue bars denote a histogram of data divided into 1 sec bins. Red curve is a Poisson curve with rate = median count rate of data. |
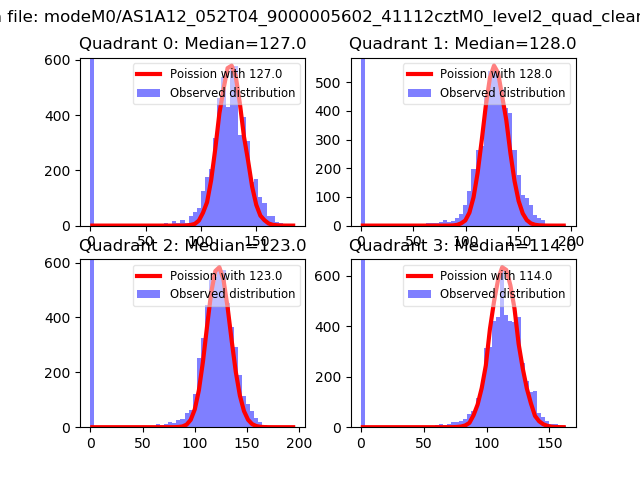 |
 |
| Quadrant-wise count rates Data is divided into 100 sec bins |
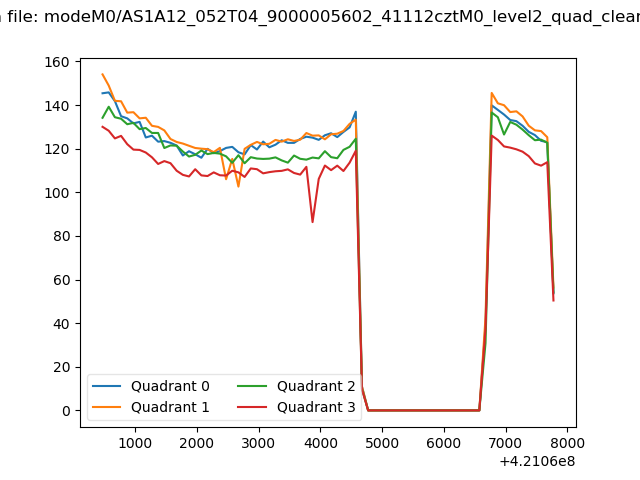 |
|
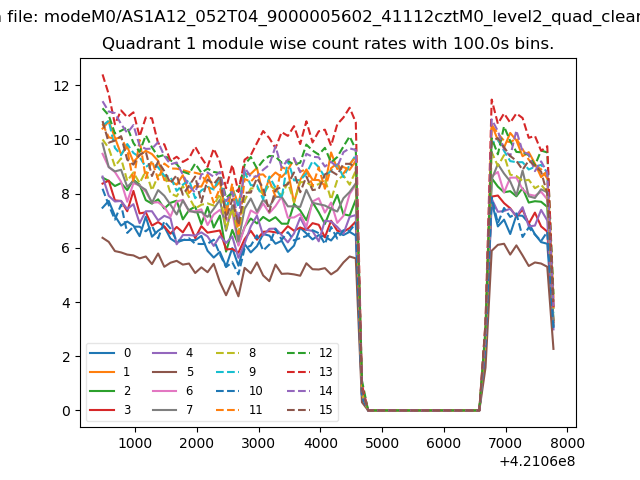
| Module-wise count rates for Quadrant A Data is divided into 100 sec bins |
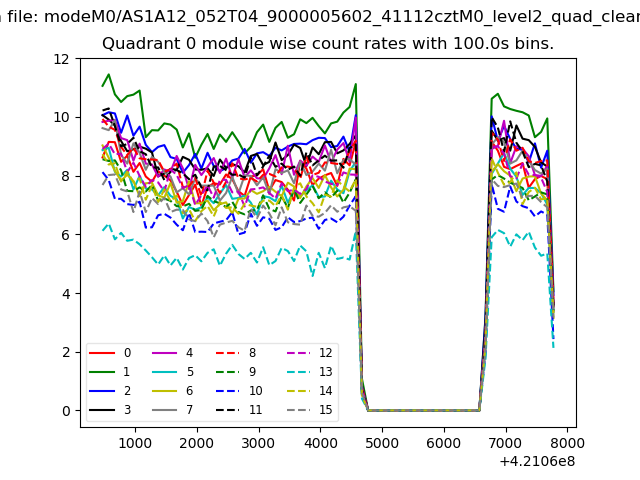 |
 |
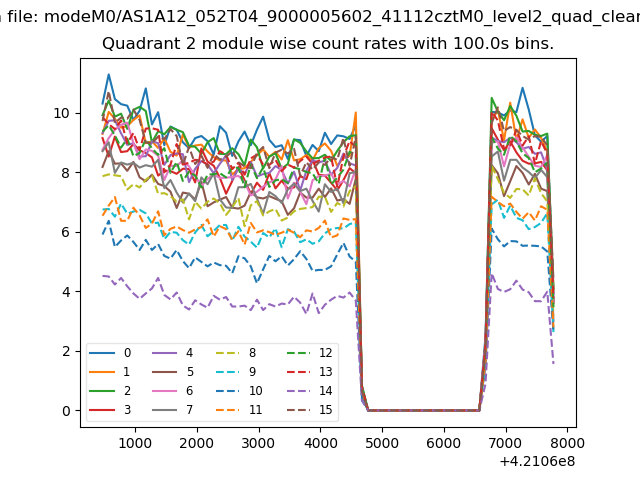
| Module-wise count rates for Quadrant B Data is divided into 100 sec bins |
 |
 |
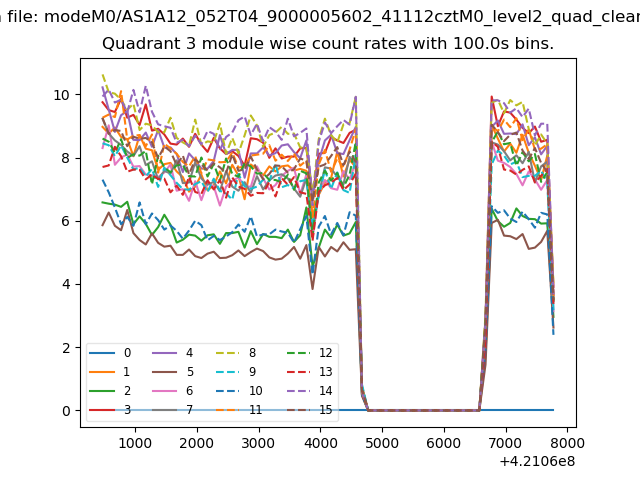
| Module-wise count rates for Quadrant C Data is divided into 100 sec bins |
 |
 |
| Module-wise count rates for Quadrant D Data is divided into 100 sec bins |
 |
 |
| Parameter | Plot |
|---|---|
| CZT HV Monitor | 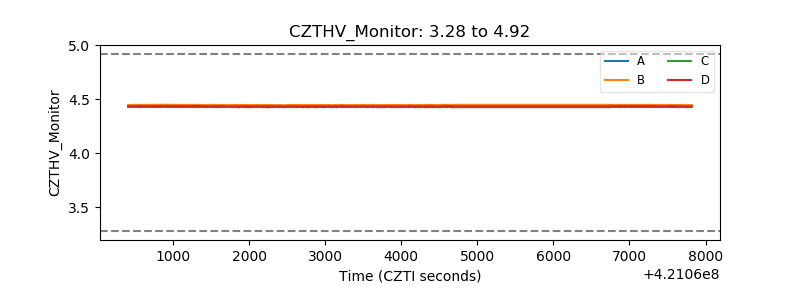 |
| D_VDD | 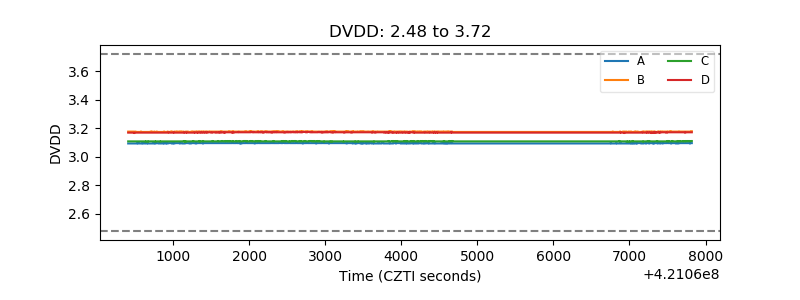 |
| Temperature 1 | 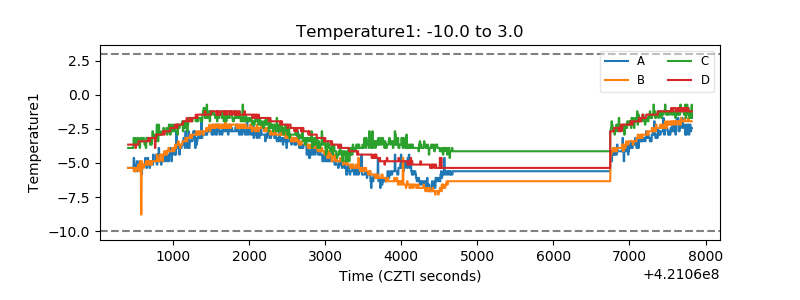 |
| Veto HV Monitor |  |
| Veto LLD | 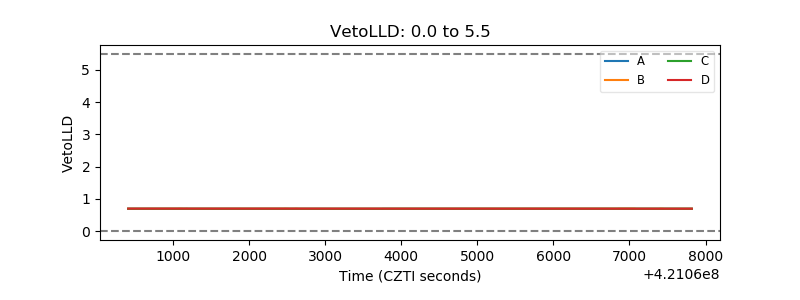 |
| Alpha Counter | 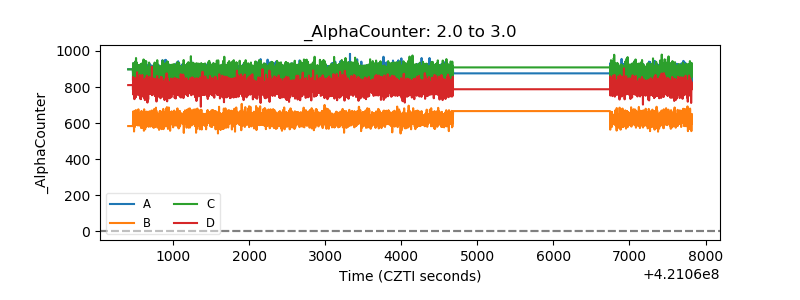 |
| _CPM_Rate | 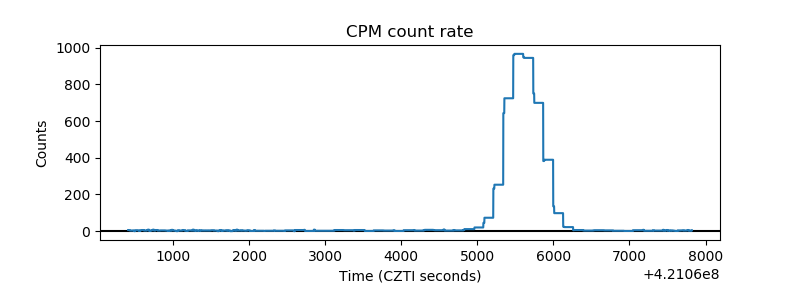 |
| CZT Counter | 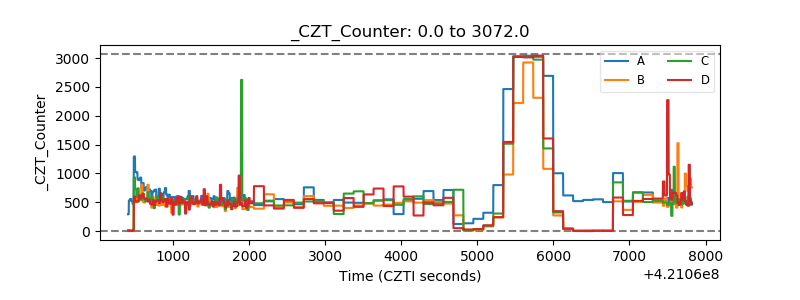 |
| +2.5 Volts monitor | 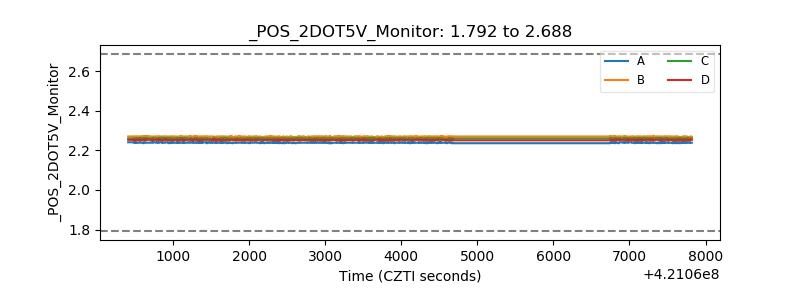 |
| +5 Volts monitor |  |
| _ROLL_ROT | 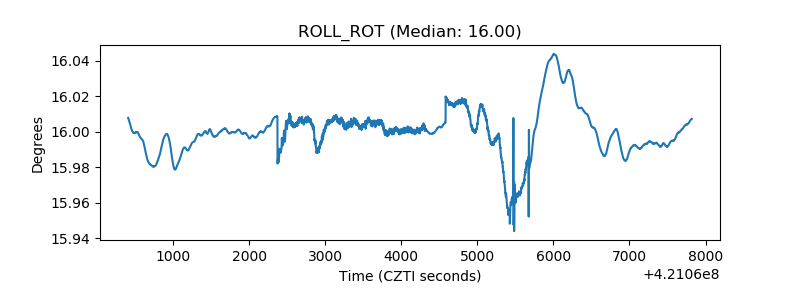 |
| _Roll_DEC | 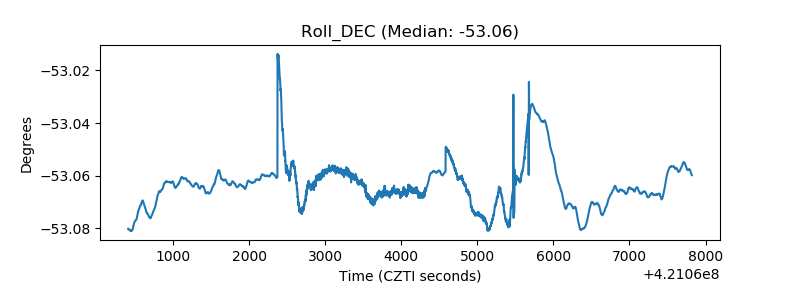 |
| _Roll_RA | 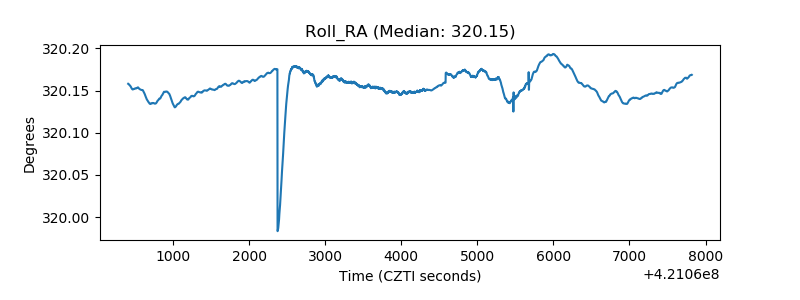 |
| Veto Counter | 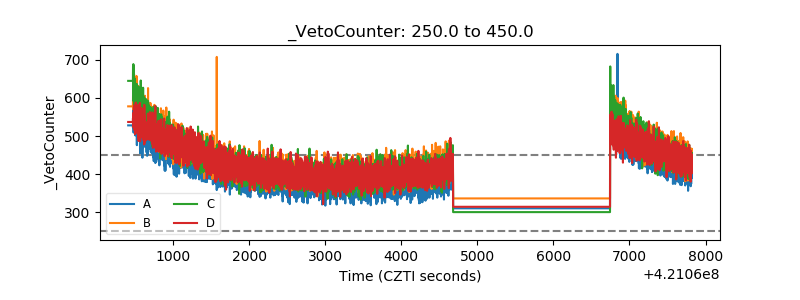 |