| Param | Original file | Final file |
|---|---|---|
| Filename | modeM0/AS1A12_052T04_9000005602_41113cztM0_level2.fits | modeM0/AS1A12_052T04_9000005602_41113cztM0_level2_quad_clean.evt |
| Size (bytes) | 349,464,960 | 94,334,400 |
| Size | 333.3 MB | 90.0 MB |
| Events in quadrant A | 2,965,635 | 648,679 |
| Events in quadrant B | 3,455,861 | 636,351 |
| Events in quadrant C | 2,760,080 | 623,985 |
| Events in quadrant D | 3,347,405 | 581,891 |
| Mode M0 | |||
|---|---|---|---|
| Quadrant | BADHDUFLAG | Total packets | Discarded packets |
| A | 0 | 11773 | 3 |
| B | 0 | 13541 | 2 |
| C | 0 | 11233 | 2 |
| D | 0 | 13253 | 2 |
| Mode M9 | |||
|---|---|---|---|
| Quadrant | BADHDUFLAG | Total packets | Discarded packets |
| A | 0 | 22 | 0 |
| B | 0 | 22 | 0 |
| C | 0 | 22 | 0 |
| D | 0 | 22 | 0 |
| Mode SS | |||
|---|---|---|---|
| Quadrant | BADHDUFLAG | Total packets | Discarded packets |
| A | 0 | 104 | 0 |
| B | 0 | 104 | 0 |
| C | 0 | 104 | 0 |
| D | 0 | 104 | 0 |
| Quadrant | Total seconds | Saturated seconds | Saturation percentage |
|---|---|---|---|
| A | 5231 | 14 | 0.267635% |
| B | 5231 | 239 | 4.568916% |
| C | 5231 | 21 | 0.401453% |
| D | 5231 | 82 | 1.567578% |
Noise dominated data is calculated using 1-second bins in cleaned event files. If a bin has >2000 counts, and if more than 50% of those come from <1% of pixels, then it is considered to be noise-dominated and hence unusable.
| Quadrant | # 1 sec bins | Bins with >0 counts | Bins with >2000 counts | High rate bins dominated by noise | Noise dominated (total time) | Noise dominated (detector-on time) | Marked lightcurve |
|---|---|---|---|---|---|---|---|
| A | 7354 | 5232 | 4 | 4 | 0.05% | 0.08% | 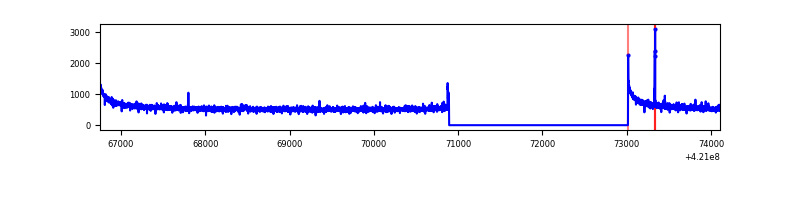 |
| B | 7354 | 5232 | 169 | 169 | 2.30% | 3.23% | 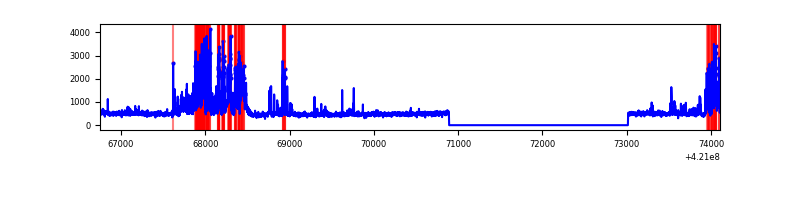 |
| C | 7354 | 5232 | 15 | 15 | 0.20% | 0.29% | 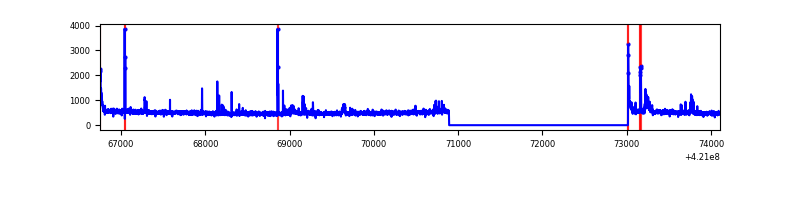 |
| D | 7354 | 5232 | 68 | 68 | 0.92% | 1.30% | 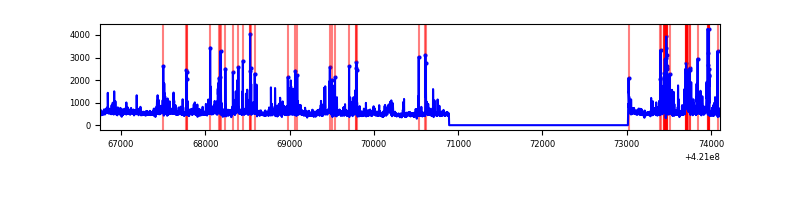 |
Top three noisy pixels from each quadrant. If the there are fewer than three noisy pixels in the level2.evt file, extra rows are filled as -1
| Pixel properties | Quadrant properties | ||||||
|---|---|---|---|---|---|---|---|
| Quadrant | DetID | PixID | Counts | Sigma | Mean | Median | Sigma |
| A | 10 | 83 | 514619 | 4080.02 | 623 | 611 | 126.0 |
| A | 2 | 79 | 19018 | 146.11 | 623 | 611 | 126.0 |
| A | 13 | 254 | 9761 | 72.63 | 623 | 611 | 126.0 |
| B | 0 | 245 | 625789 | 5462.03 | 603 | 588 | 114.5 |
| B | 0 | 186 | 413223 | 3604.96 | 603 | 588 | 114.5 |
| B | 0 | 190 | 16783 | 141.49 | 603 | 588 | 114.5 |
| C | 15 | 214 | 227637 | 1653.1 | 594 | 596 | 137.3 |
| C | 14 | 254 | 157690 | 1143.81 | 594 | 596 | 137.3 |
| C | 0 | 10 | 49568 | 356.57 | 594 | 596 | 137.3 |
| D | 2 | 249 | 311686 | 2133.81 | 602 | 586 | 145.8 |
| D | 13 | 249 | 275628 | 1886.49 | 602 | 586 | 145.8 |
| D | 9 | 49 | 252532 | 1728.08 | 602 | 586 | 145.8 |
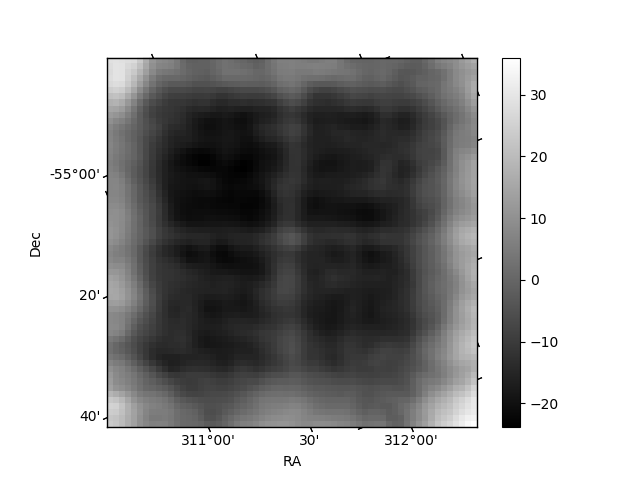
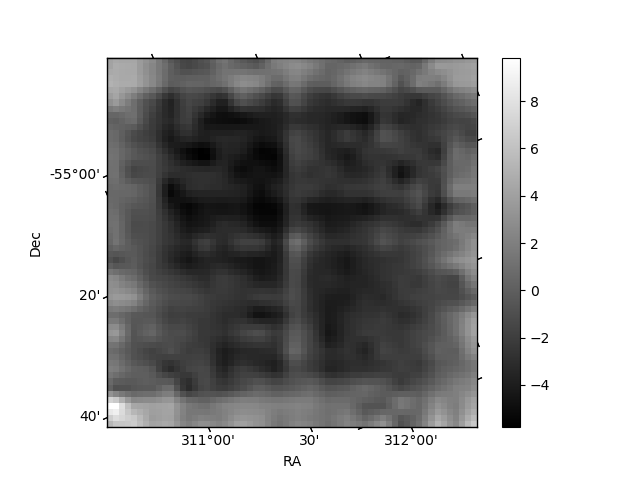
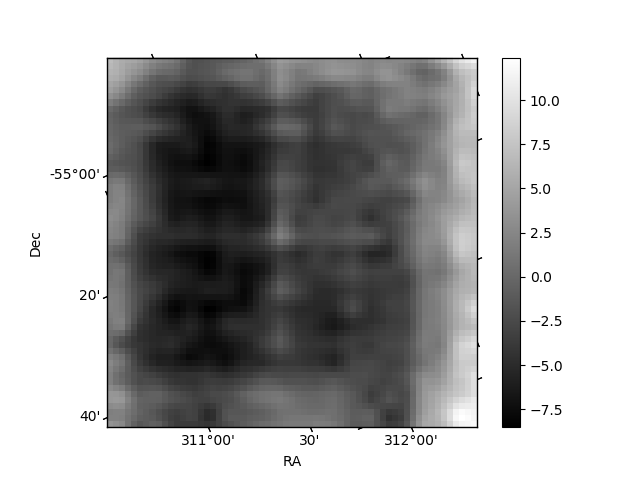
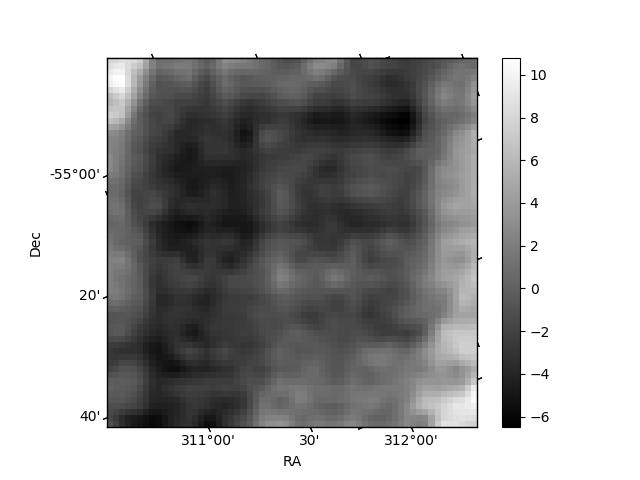
Histogram calculated using DETX and DETY for each event in the final _common_clean file
| Quadrant A | 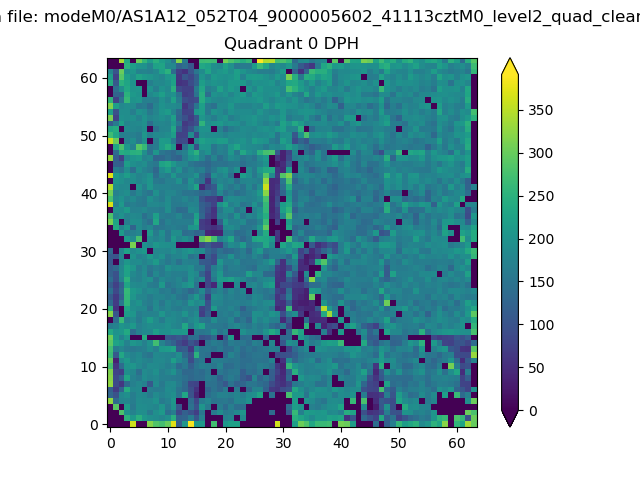 |
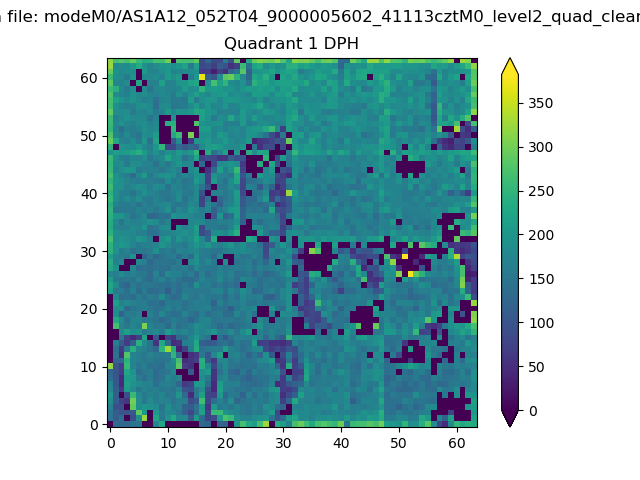 |
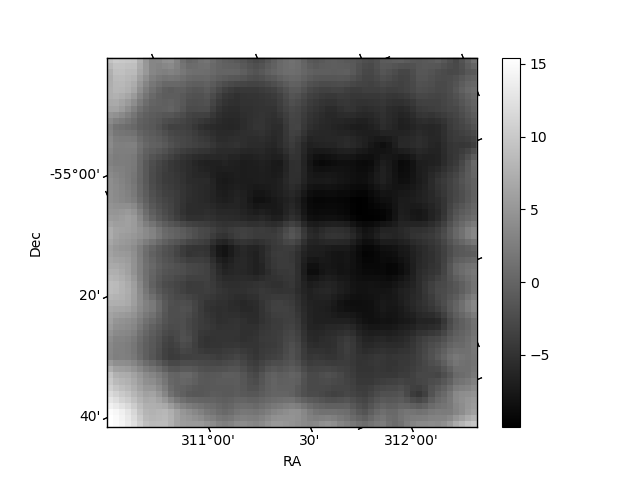
Quadrant B |
|---|---|---|---|
| Quadrant D | 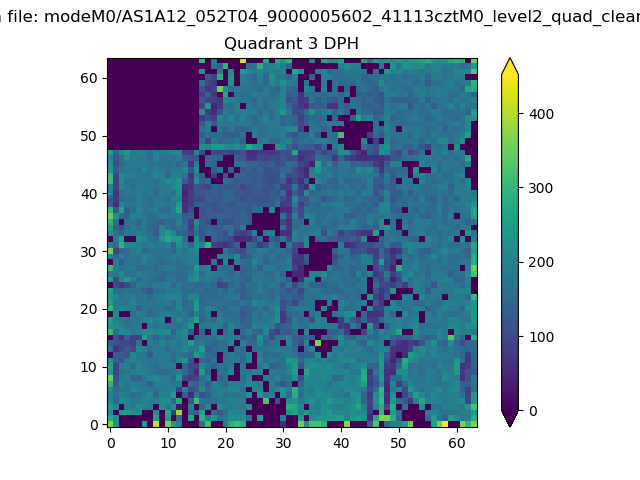 |
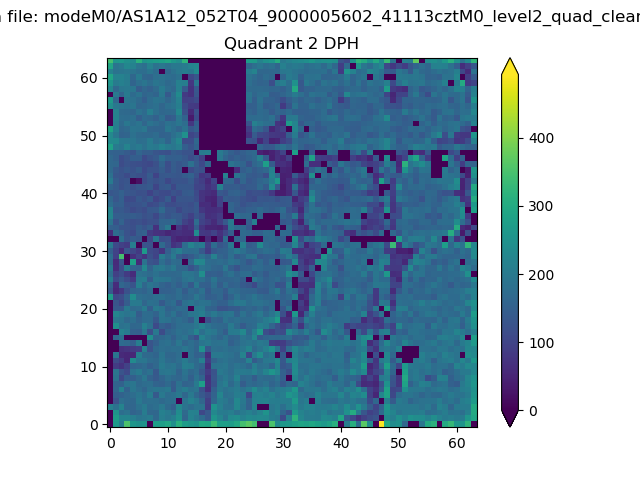 |
Quadrant C |
| Plot type | Count rate plots | Images |
|---|---|---|
| Comparison with Poisson distribution Blue bars denote a histogram of data divided into 1 sec bins. Red curve is a Poisson curve with rate = median count rate of data. |
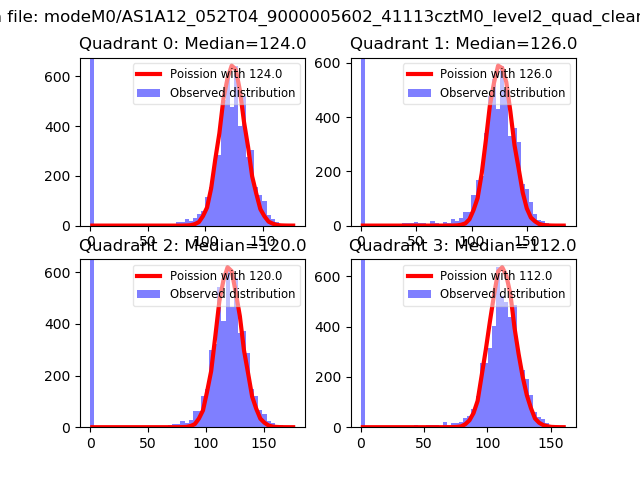 |
 |
| Quadrant-wise count rates Data is divided into 100 sec bins |
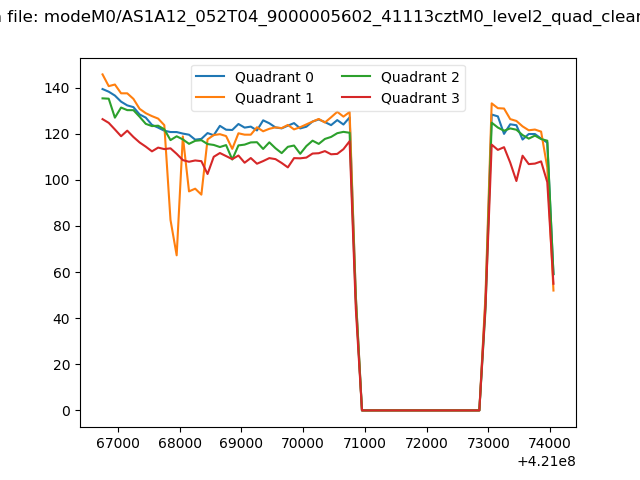 |
|
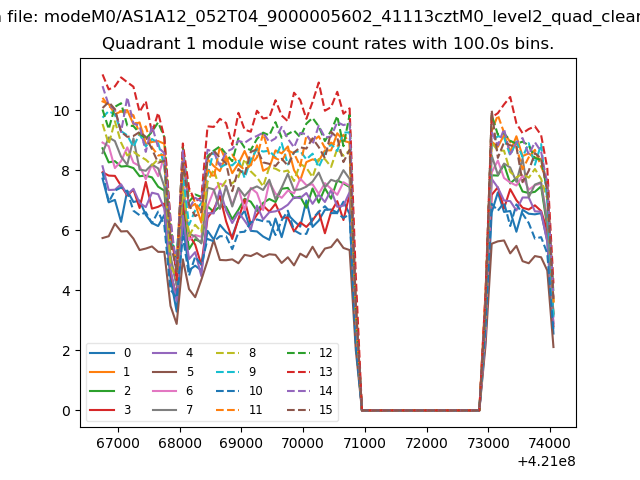
| Module-wise count rates for Quadrant A Data is divided into 100 sec bins |
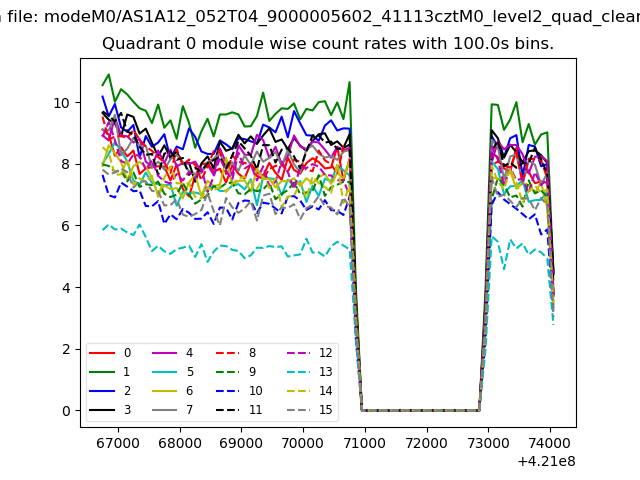 |
 |
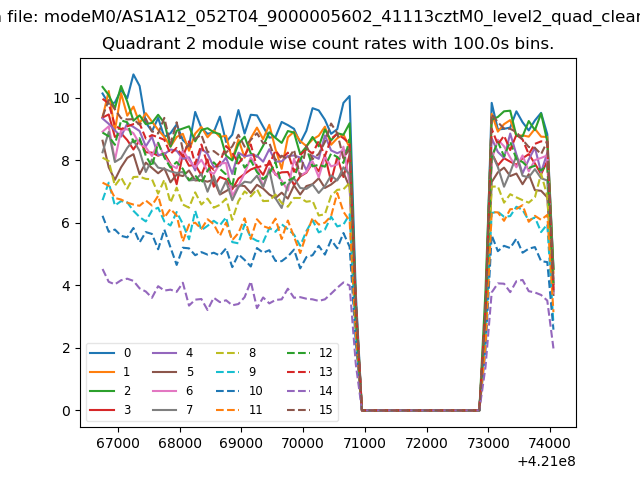
| Module-wise count rates for Quadrant B Data is divided into 100 sec bins |
 |
 |
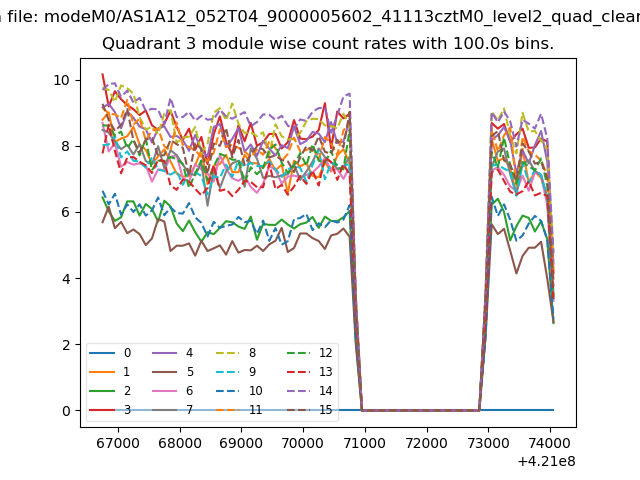
| Module-wise count rates for Quadrant C Data is divided into 100 sec bins |
 |
 |
| Module-wise count rates for Quadrant D Data is divided into 100 sec bins |
 |
 |
| Parameter | Plot |
|---|---|
| CZT HV Monitor | 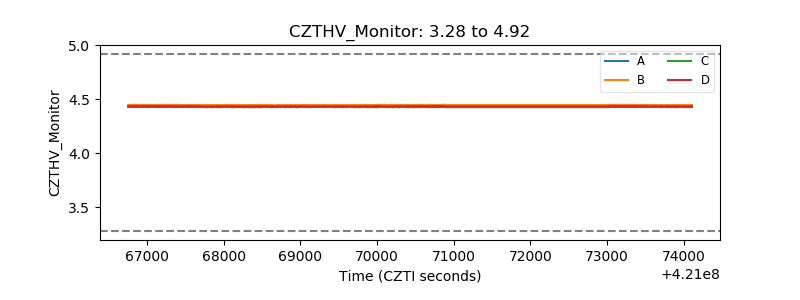 |
| D_VDD | 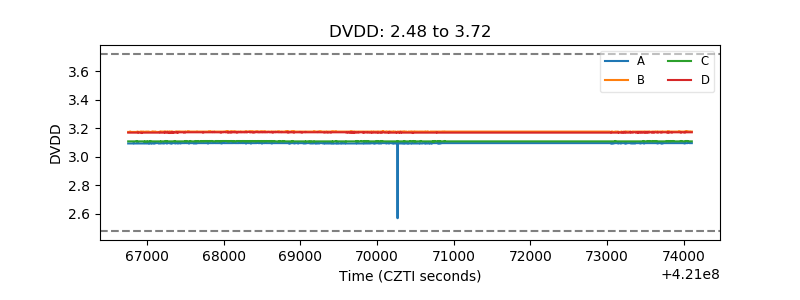 |
| Temperature 1 | 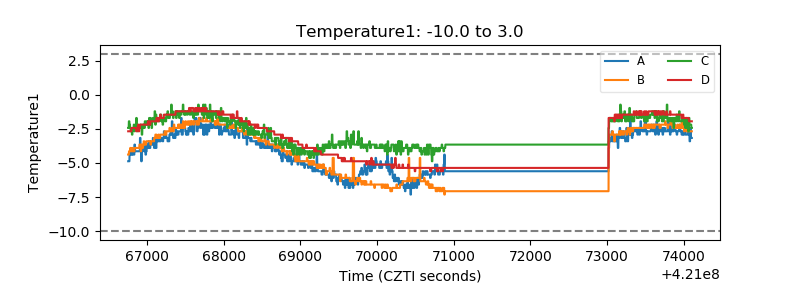 |
| Veto HV Monitor | 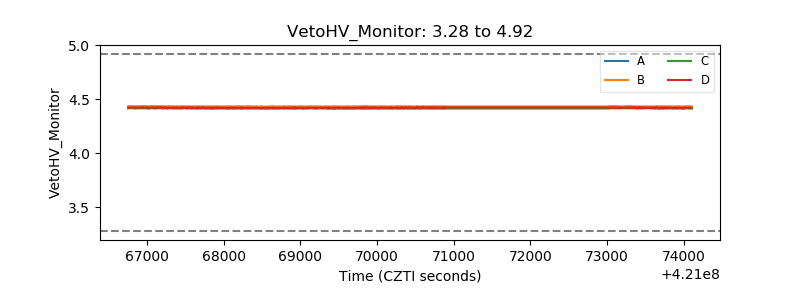 |
| Veto LLD | 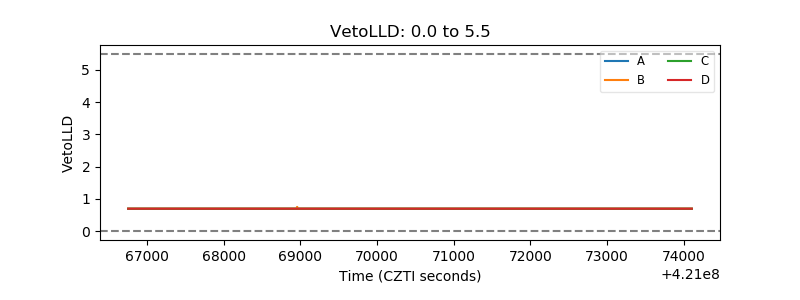 |
| Alpha Counter | 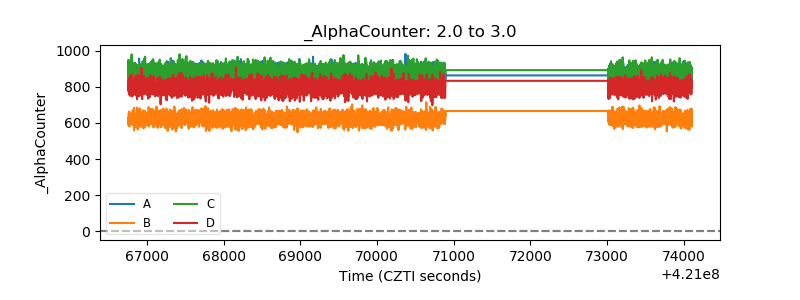 |
| _CPM_Rate | 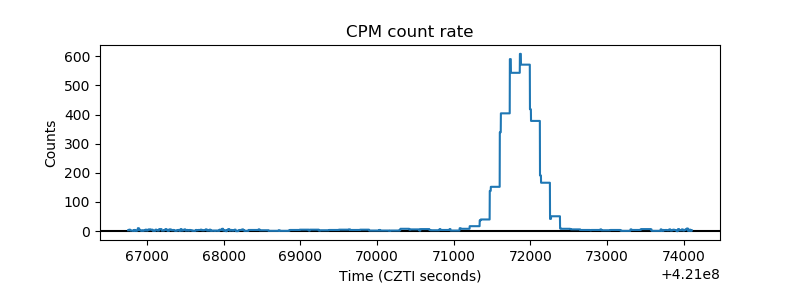 |
| CZT Counter | 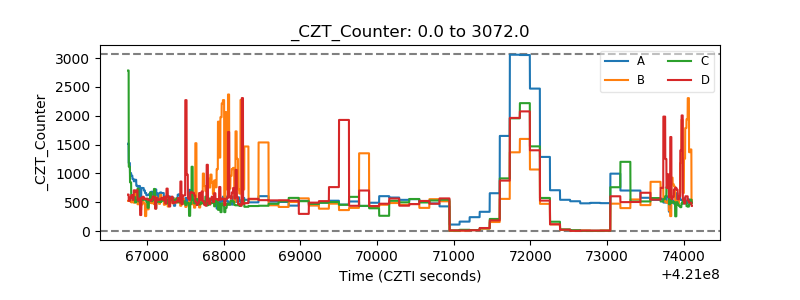 |
| +2.5 Volts monitor | 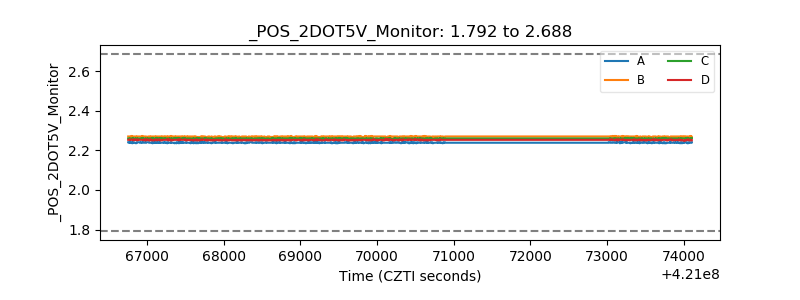 |
| +5 Volts monitor |  |
| _ROLL_ROT | 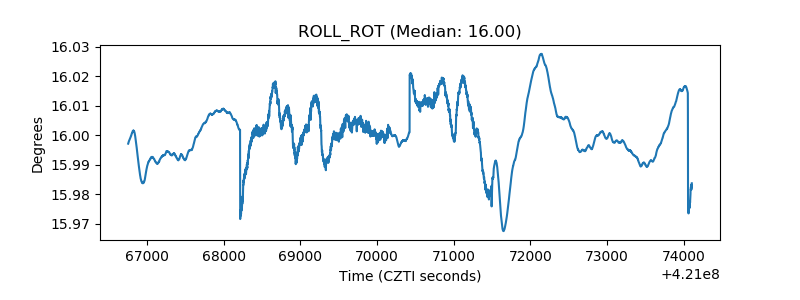 |
| _Roll_DEC | 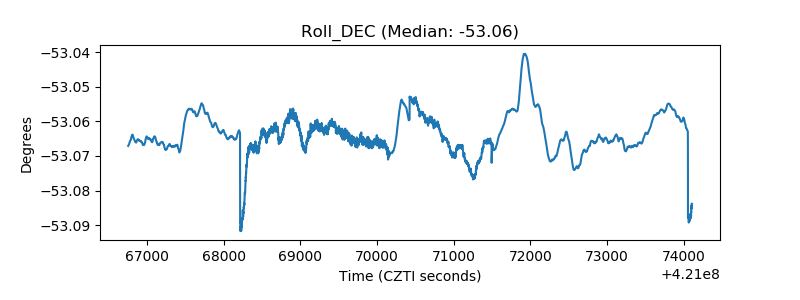 |
| _Roll_RA | 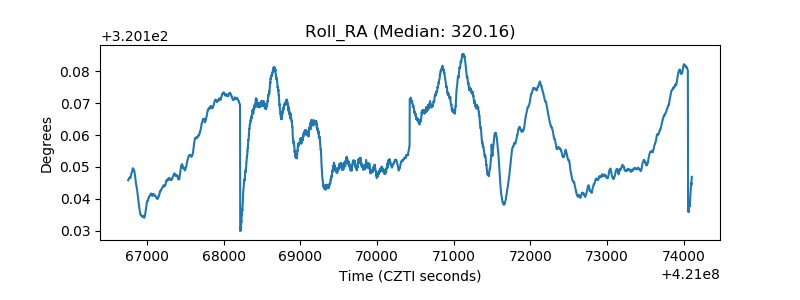 |
| Veto Counter | 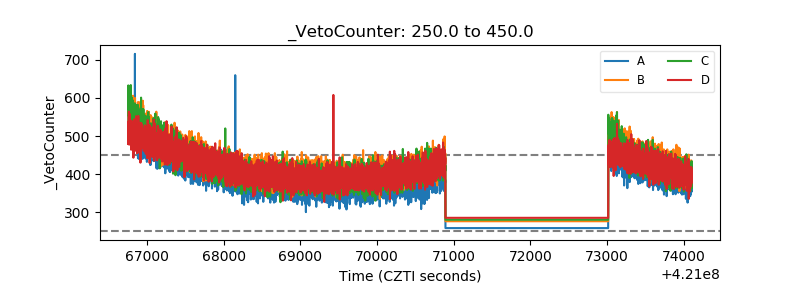 |