| Param | Original file | Final file |
|---|---|---|
| Filename | modeM0/AS1A12_052T04_9000005602_41114cztM0_level2.fits | modeM0/AS1A12_052T04_9000005602_41114cztM0_level2_quad_clean.evt |
| Size (bytes) | 341,637,120 | 88,032,960 |
| Size | 325.8 MB | 84.0 MB |
| Events in quadrant A | 2,935,938 | 604,921 |
| Events in quadrant B | 3,080,049 | 596,213 |
| Events in quadrant C | 2,650,261 | 581,510 |
| Events in quadrant D | 3,582,736 | 525,708 |
| Mode M0 | |||
|---|---|---|---|
| Quadrant | BADHDUFLAG | Total packets | Discarded packets |
| A | 0 | 11683 | 3 |
| B | 0 | 12537 | 2 |
| C | 0 | 10999 | 2 |
| D | 0 | 13999 | 2 |
| Mode M9 | |||
|---|---|---|---|
| Quadrant | BADHDUFLAG | Total packets | Discarded packets |
| A | 0 | 29 | 0 |
| B | 0 | 29 | 0 |
| C | 0 | 29 | 0 |
| D | 0 | 30 | 0 |
| Mode SS | |||
|---|---|---|---|
| Quadrant | BADHDUFLAG | Total packets | Discarded packets |
| A | 0 | 104 | 0 |
| B | 0 | 104 | 0 |
| C | 0 | 104 | 0 |
| D | 0 | 104 | 0 |
| Quadrant | Total seconds | Saturated seconds | Saturation percentage |
|---|---|---|---|
| A | 5099 | 50 | 0.980584% |
| B | 5099 | 202 | 3.961561% |
| C | 5099 | 28 | 0.549127% |
| D | 5099 | 278 | 5.452049% |
Noise dominated data is calculated using 1-second bins in cleaned event files. If a bin has >2000 counts, and if more than 50% of those come from <1% of pixels, then it is considered to be noise-dominated and hence unusable.
| Quadrant | # 1 sec bins | Bins with >0 counts | Bins with >2000 counts | High rate bins dominated by noise | Noise dominated (total time) | Noise dominated (detector-on time) | Marked lightcurve |
|---|---|---|---|---|---|---|---|
| A | 7222 | 5100 | 34 | 34 | 0.47% | 0.67% | 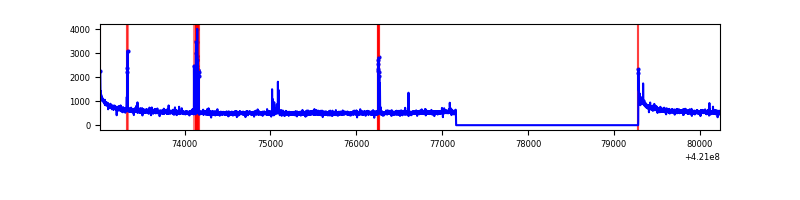 |
| B | 7222 | 5100 | 124 | 124 | 1.72% | 2.43% | 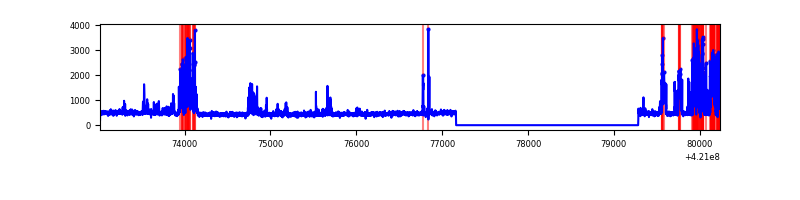 |
| C | 7222 | 5100 | 23 | 23 | 0.32% | 0.45% | 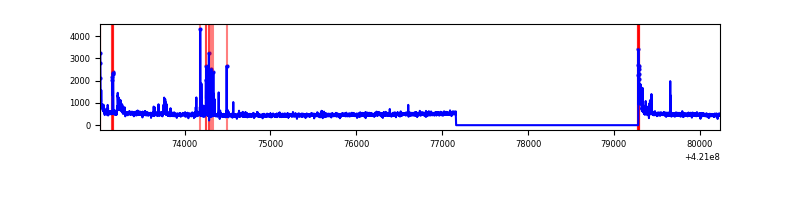 |
| D | 7222 | 5100 | 246 | 246 | 3.41% | 4.82% | 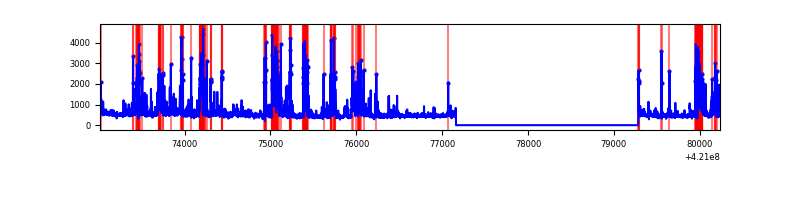 |
Top three noisy pixels from each quadrant. If the there are fewer than three noisy pixels in the level2.evt file, extra rows are filled as -1
| Pixel properties | Quadrant properties | ||||||
|---|---|---|---|---|---|---|---|
| Quadrant | DetID | PixID | Counts | Sigma | Mean | Median | Sigma |
| A | 10 | 83 | 511176 | 4292.95 | 586 | 575 | 118.9 |
| A | 2 | 79 | 131129 | 1097.65 | 586 | 575 | 118.9 |
| A | 12 | 189 | 22001 | 180.14 | 586 | 575 | 118.9 |
| B | 0 | 245 | 647530 | 5834.35 | 572 | 556 | 110.9 |
| B | 0 | 186 | 138346 | 1242.58 | 572 | 556 | 110.9 |
| B | 4 | 81 | 29558 | 261.54 | 572 | 556 | 110.9 |
| C | 15 | 214 | 221287 | 1692.04 | 561 | 563 | 130.4 |
| C | 14 | 254 | 164627 | 1257.7 | 561 | 563 | 130.4 |
| C | 0 | 10 | 71794 | 546.05 | 561 | 563 | 130.4 |
| D | 2 | 249 | 737583 | 5375.78 | 557 | 540 | 137.1 |
| D | 13 | 249 | 480843 | 3503.2 | 557 | 540 | 137.1 |
| D | 9 | 49 | 108007 | 783.83 | 557 | 540 | 137.1 |
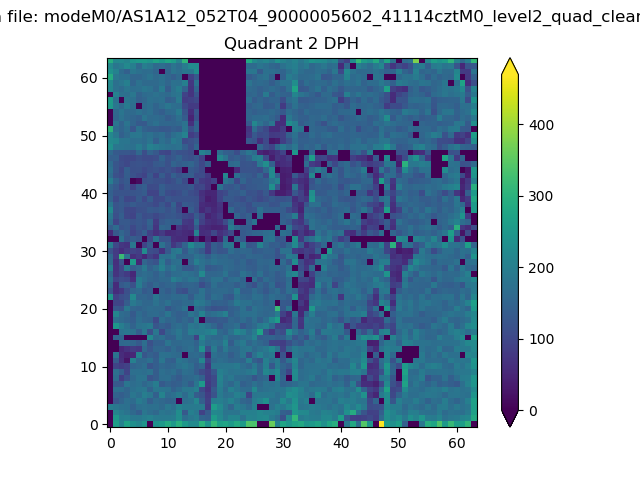
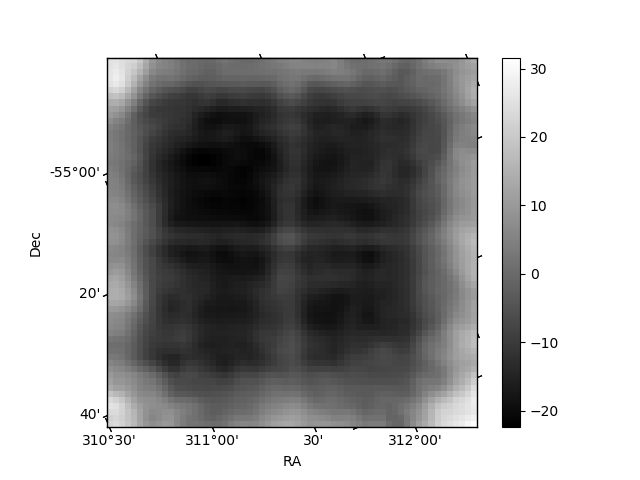
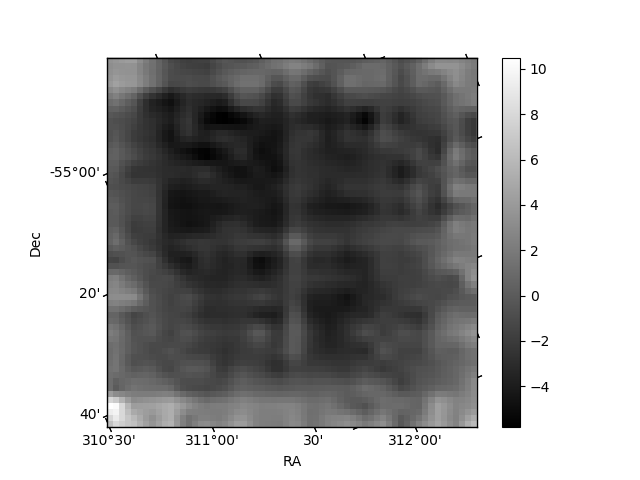
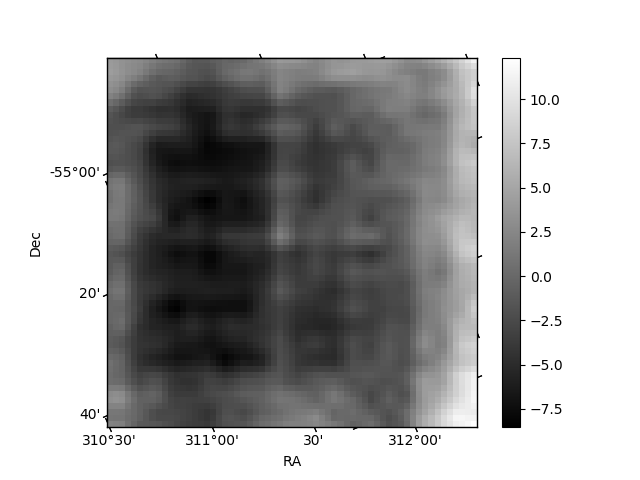
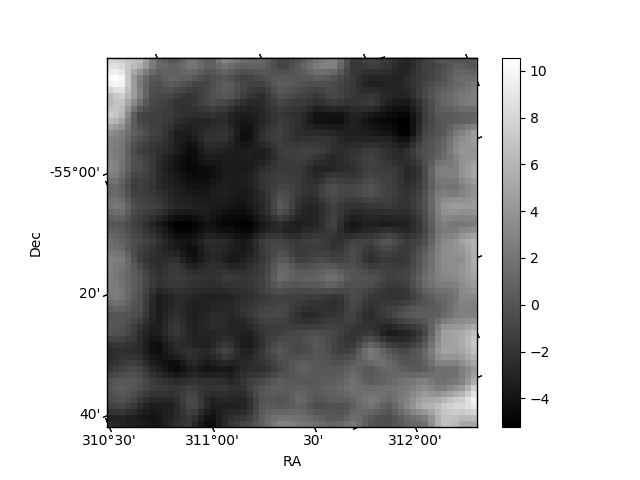
Histogram calculated using DETX and DETY for each event in the final _common_clean file
| Quadrant A | 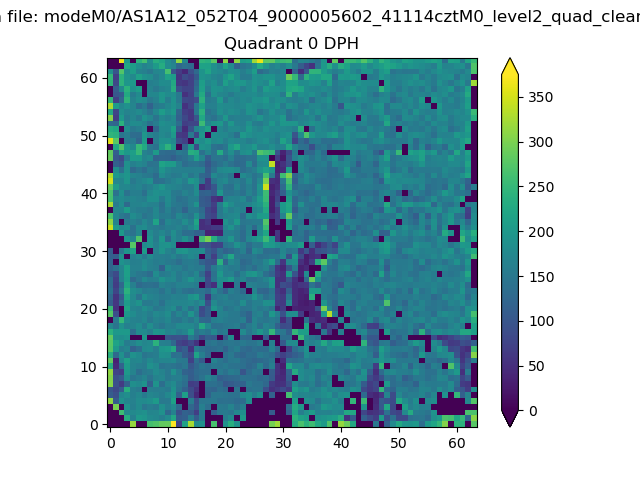 |
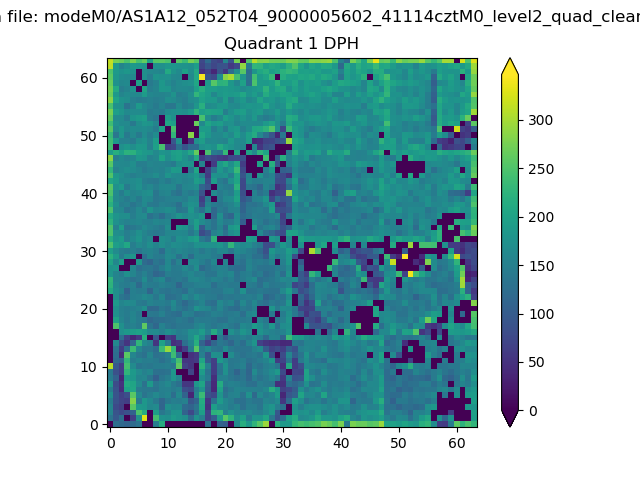 |
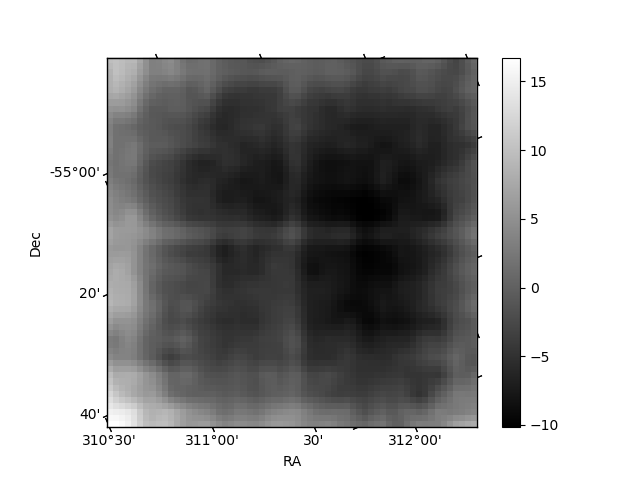
Quadrant B |
|---|---|---|---|
| Quadrant D | 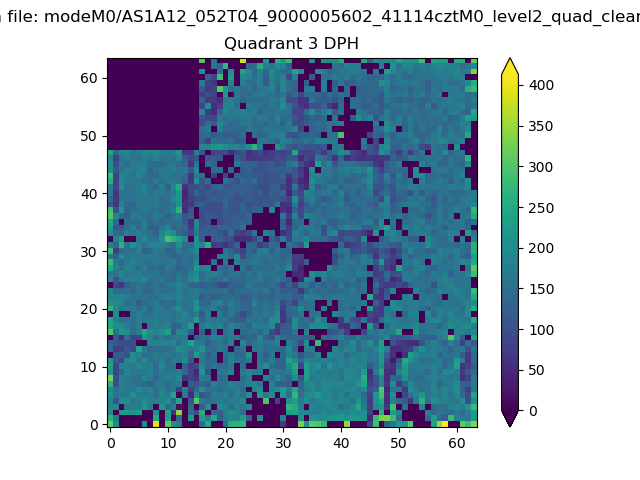 |
 |
Quadrant C |
| Plot type | Count rate plots | Images |
|---|---|---|
| Comparison with Poisson distribution Blue bars denote a histogram of data divided into 1 sec bins. Red curve is a Poisson curve with rate = median count rate of data. |
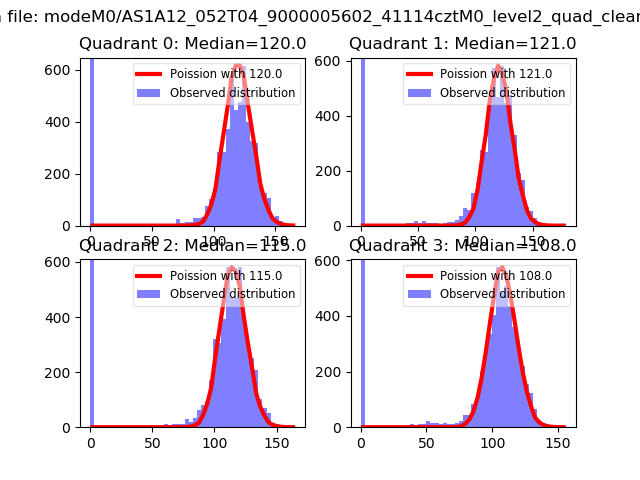 |
 |
| Quadrant-wise count rates Data is divided into 100 sec bins |
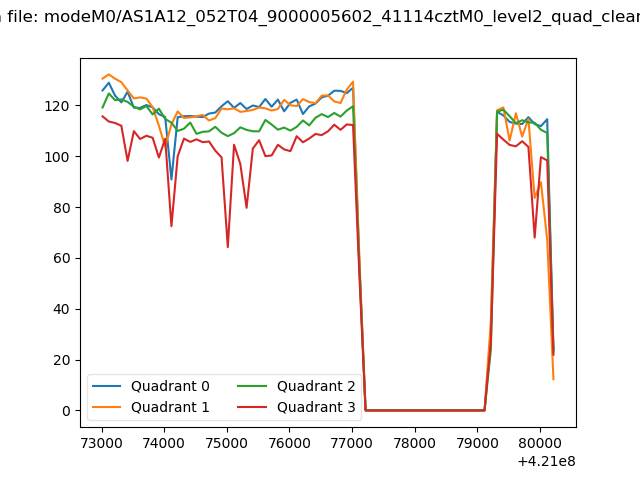 |
|
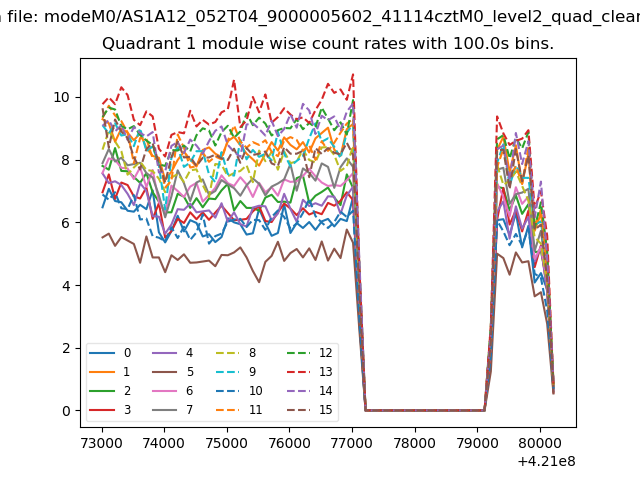
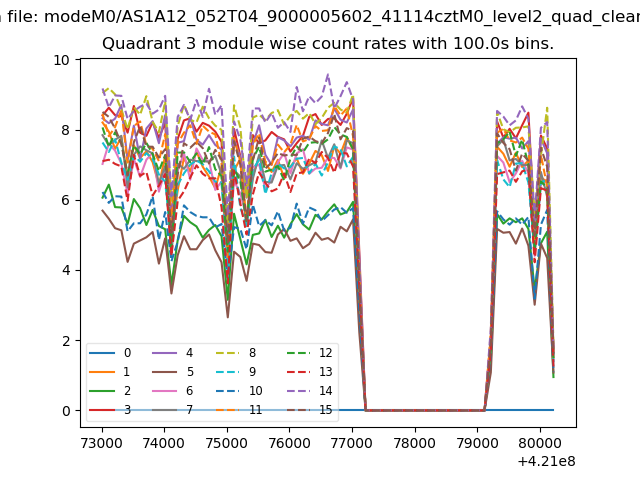
| Module-wise count rates for Quadrant A Data is divided into 100 sec bins |
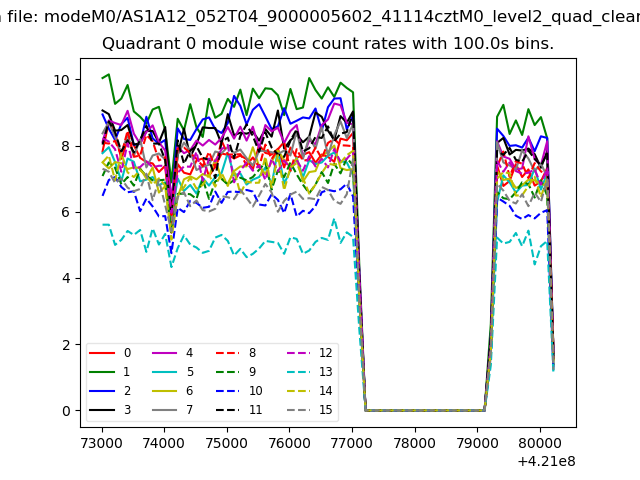 |
 |
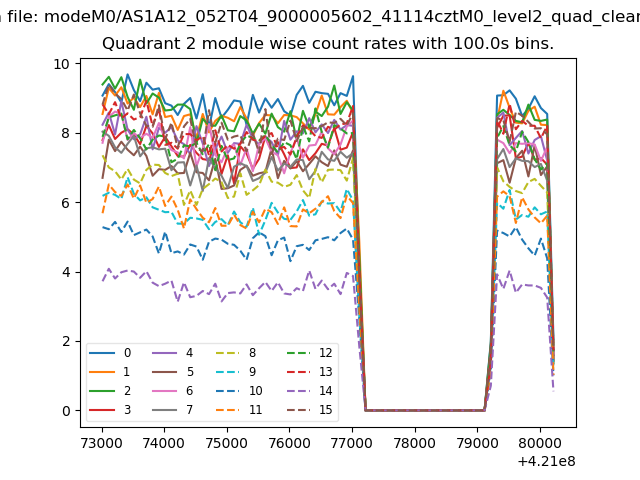
| Module-wise count rates for Quadrant B Data is divided into 100 sec bins |
 |
 |
| Module-wise count rates for Quadrant C Data is divided into 100 sec bins |
 |
 |
| Module-wise count rates for Quadrant D Data is divided into 100 sec bins |
 |
 |
| Parameter | Plot |
|---|---|
| CZT HV Monitor | 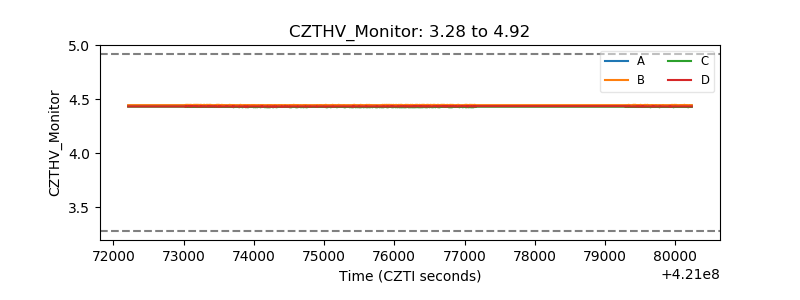 |
| D_VDD | 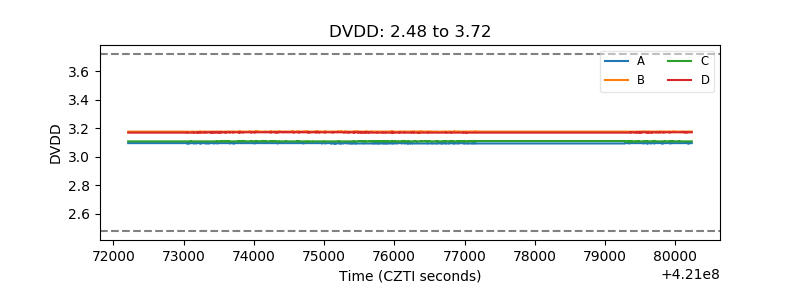 |
| Temperature 1 | 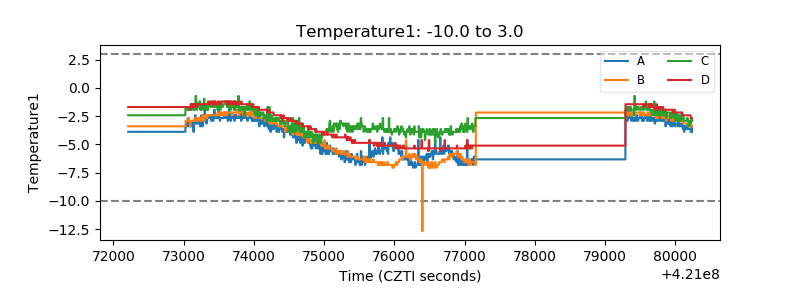 |
| Veto HV Monitor |  |
| Veto LLD | 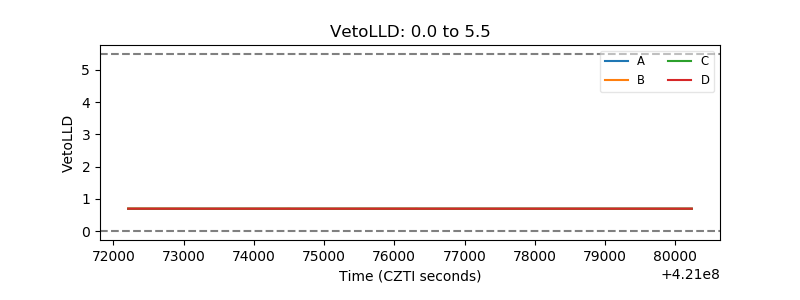 |
| Alpha Counter | 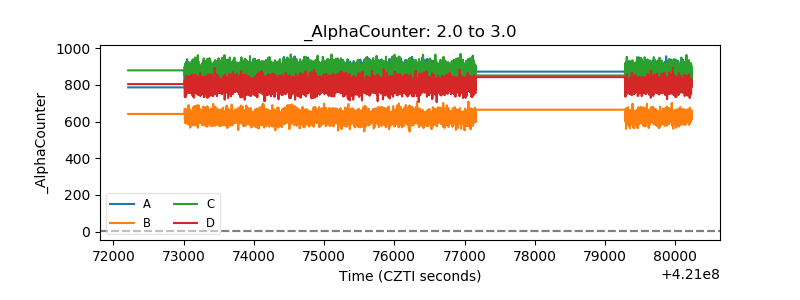 |
| _CPM_Rate | 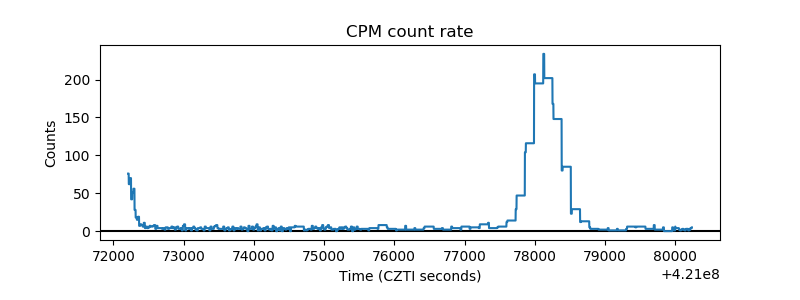 |
| CZT Counter | 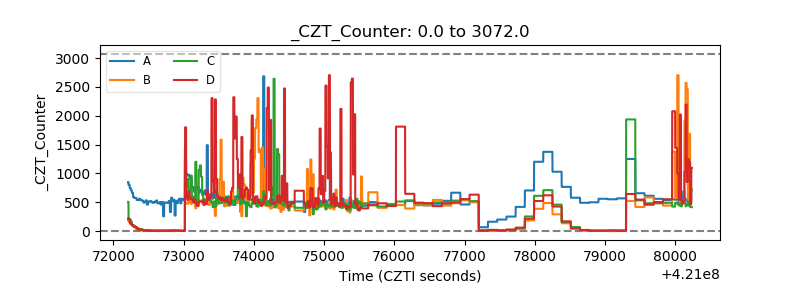 |
| +2.5 Volts monitor | 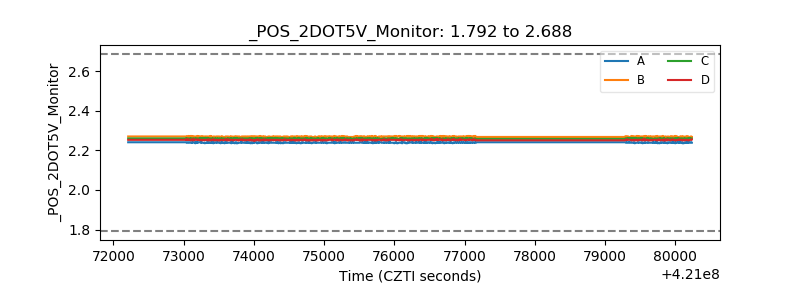 |
| +5 Volts monitor | 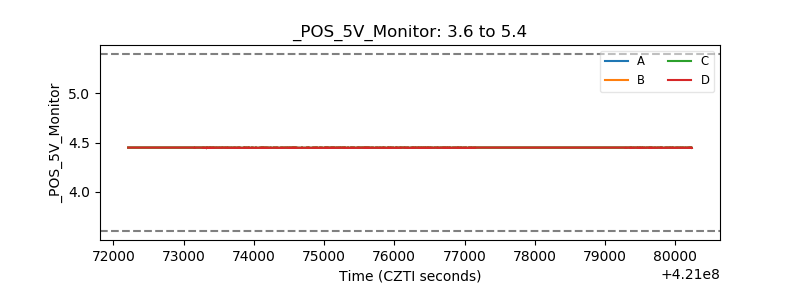 |
| _ROLL_ROT | 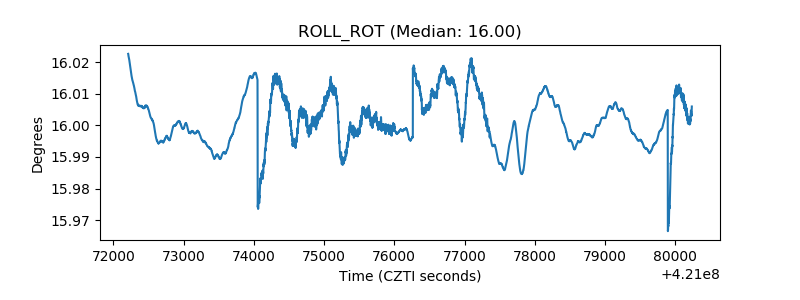 |
| _Roll_DEC | 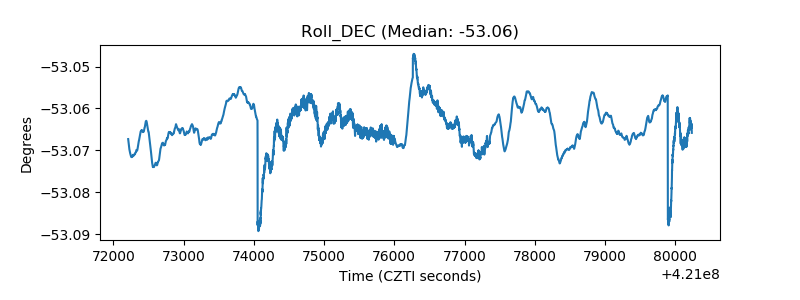 |
| _Roll_RA | 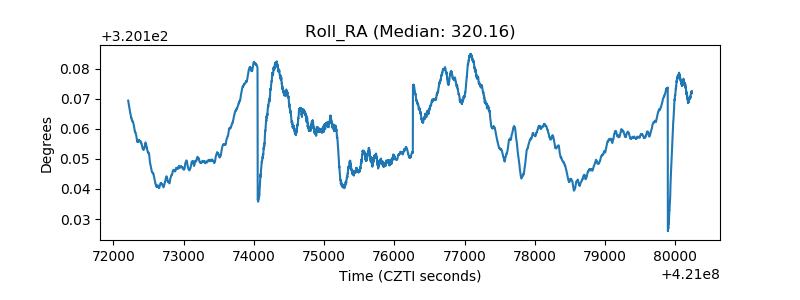 |
| Veto Counter | 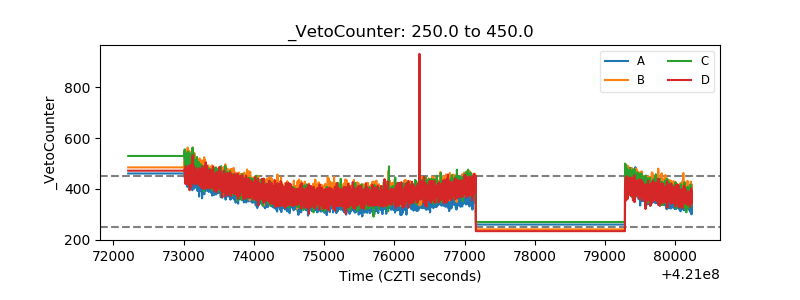 |