| Param | Original file | Final file |
|---|---|---|
| Filename | modeM0/AS1A12_052T04_9000005602_41115cztM0_level2.fits | modeM0/AS1A12_052T04_9000005602_41115cztM0_level2_quad_clean.evt |
| Size (bytes) | 340,565,760 | 85,682,880 |
| Size | 324.8 MB | 81.7 MB |
| Events in quadrant A | 2,767,590 | 587,314 |
| Events in quadrant B | 3,411,114 | 568,082 |
| Events in quadrant C | 2,545,012 | 563,462 |
| Events in quadrant D | 3,483,432 | 516,089 |
| Mode M0 | |||
|---|---|---|---|
| Quadrant | BADHDUFLAG | Total packets | Discarded packets |
| A | 0 | 11340 | 53 |
| B | 0 | 13658 | 74 |
| C | 0 | 10827 | 34 |
| D | 0 | 13994 | 58 |
| Mode M9 | |||
|---|---|---|---|
| Quadrant | BADHDUFLAG | Total packets | Discarded packets |
| A | 0 | 26 | 0 |
| B | 0 | 26 | 0 |
| C | 0 | 26 | 0 |
| D | 0 | 27 | 0 |
| Mode SS | |||
|---|---|---|---|
| Quadrant | BADHDUFLAG | Total packets | Discarded packets |
| A | 0 | 106 | 0 |
| B | 0 | 106 | 0 |
| C | 0 | 106 | 0 |
| D | 0 | 106 | 0 |
| Quadrant | Total seconds | Saturated seconds | Saturation percentage |
|---|---|---|---|
| A | 5118 | 14 | 0.273544% |
| B | 5122 | 277 | 5.408044% |
| C | 5130 | 42 | 0.818713% |
| D | 5134 | 227 | 4.421504% |
Noise dominated data is calculated using 1-second bins in cleaned event files. If a bin has >2000 counts, and if more than 50% of those come from <1% of pixels, then it is considered to be noise-dominated and hence unusable.
| Quadrant | # 1 sec bins | Bins with >0 counts | Bins with >2000 counts | High rate bins dominated by noise | Noise dominated (total time) | Noise dominated (detector-on time) | Marked lightcurve |
|---|---|---|---|---|---|---|---|
| A | 7126 | 5141 | 4 | 4 | 0.06% | 0.08% | 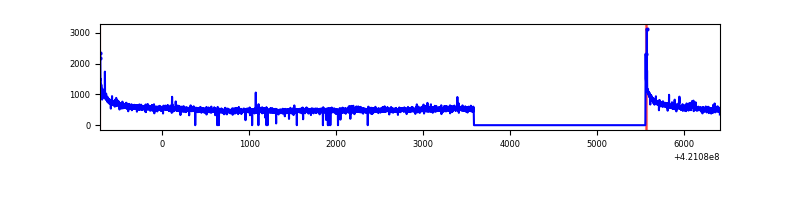 |
| B | 7126 | 5142 | 181 | 181 | 2.54% | 3.52% | 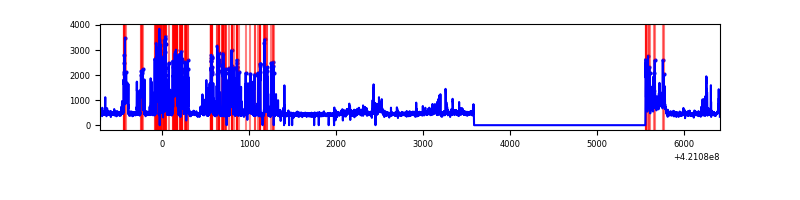 |
| C | 7126 | 5147 | 36 | 36 | 0.51% | 0.70% | 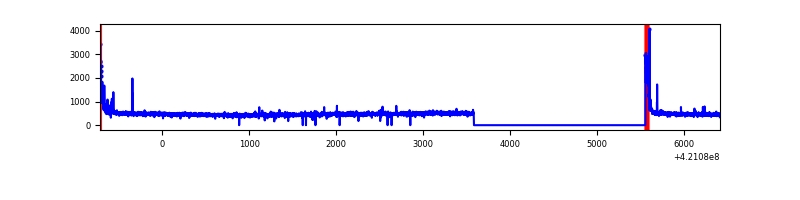 |
| D | 7126 | 5148 | 212 | 212 | 2.98% | 4.12% | 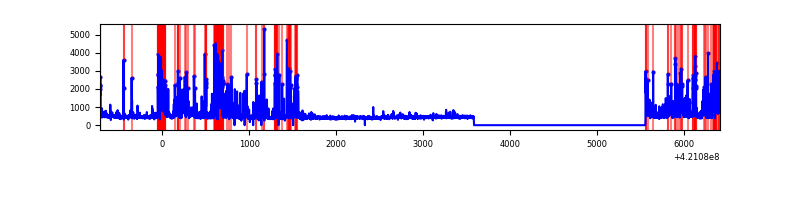 |
Top three noisy pixels from each quadrant. If the there are fewer than three noisy pixels in the level2.evt file, extra rows are filled as -1
| Pixel properties | Quadrant properties | ||||||
|---|---|---|---|---|---|---|---|
| Quadrant | DetID | PixID | Counts | Sigma | Mean | Median | Sigma |
| A | 10 | 83 | 510341 | 4401.01 | 571 | 560 | 115.8 |
| A | 2 | 79 | 18362 | 153.69 | 571 | 560 | 115.8 |
| A | 13 | 248 | 14171 | 117.51 | 571 | 560 | 115.8 |
| B | 0 | 245 | 1044693 | 9708.86 | 556 | 540 | 107.5 |
| B | 0 | 186 | 149048 | 1380.87 | 556 | 540 | 107.5 |
| B | 12 | 111 | 13658 | 121.98 | 556 | 540 | 107.5 |
| C | 15 | 214 | 223340 | 1733.22 | 551 | 553 | 128.5 |
| C | 0 | 10 | 134494 | 1042.02 | 551 | 553 | 128.5 |
| C | 14 | 254 | 27865 | 212.48 | 551 | 553 | 128.5 |
| D | 12 | 217 | 676509 | 5003.74 | 548 | 532 | 135.1 |
| D | 2 | 249 | 534666 | 3953.79 | 548 | 532 | 135.1 |
| D | 2 | 16 | 64904 | 476.5 | 548 | 532 | 135.1 |
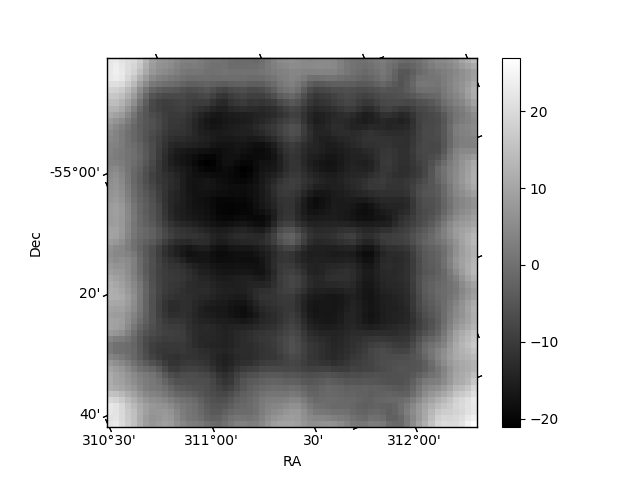
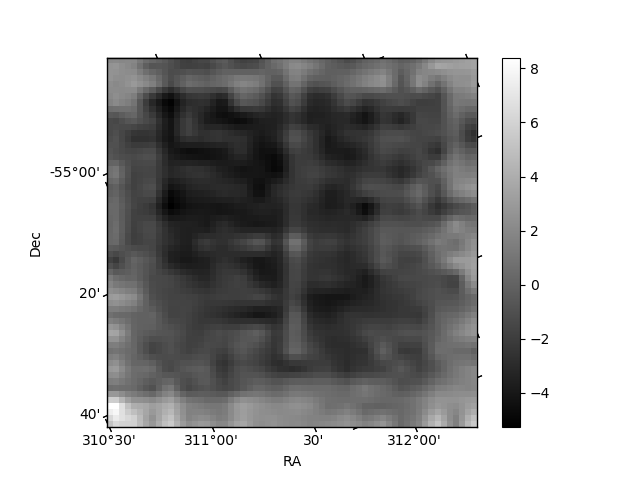
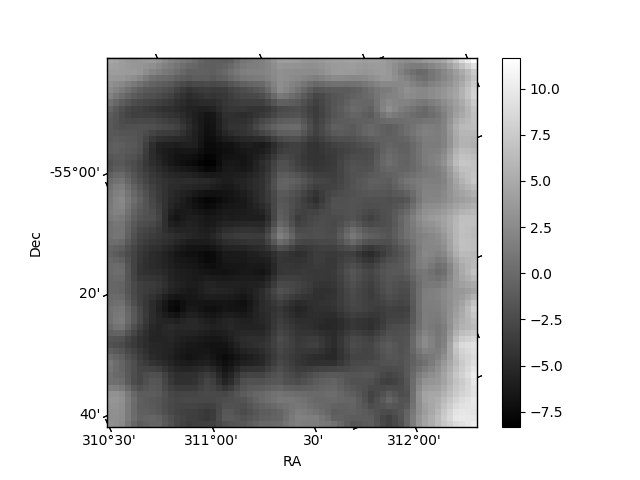
Histogram calculated using DETX and DETY for each event in the final _common_clean file
| Quadrant A | 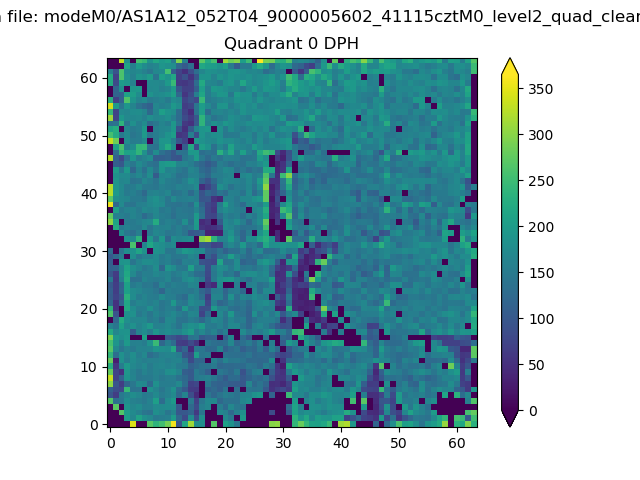 |
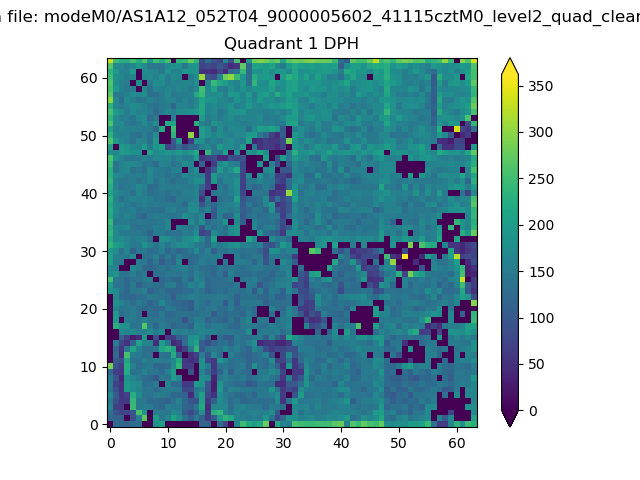 |
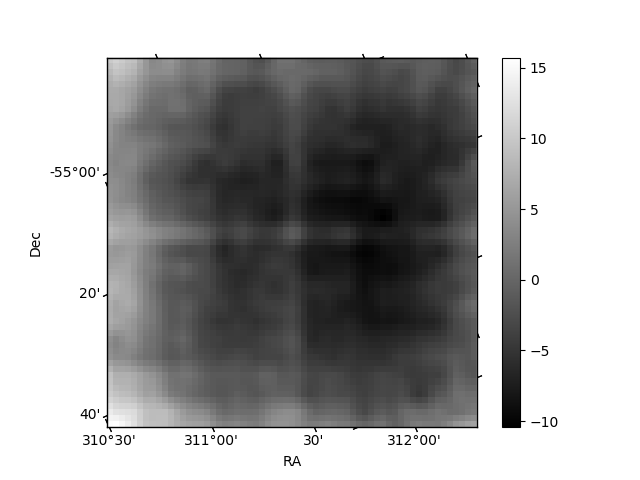
Quadrant B |
|---|---|---|---|
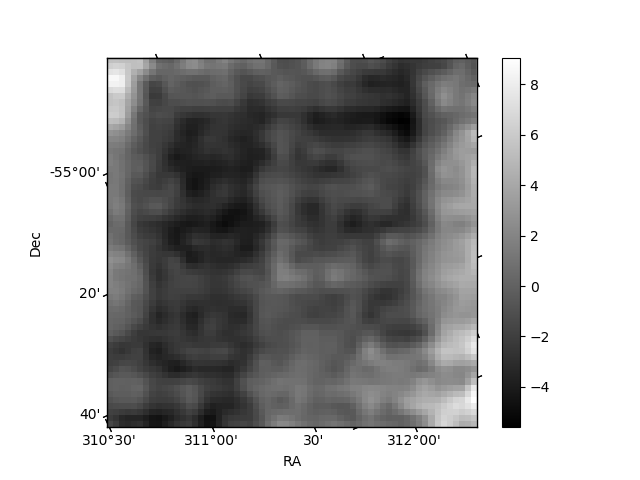
| Quadrant D | 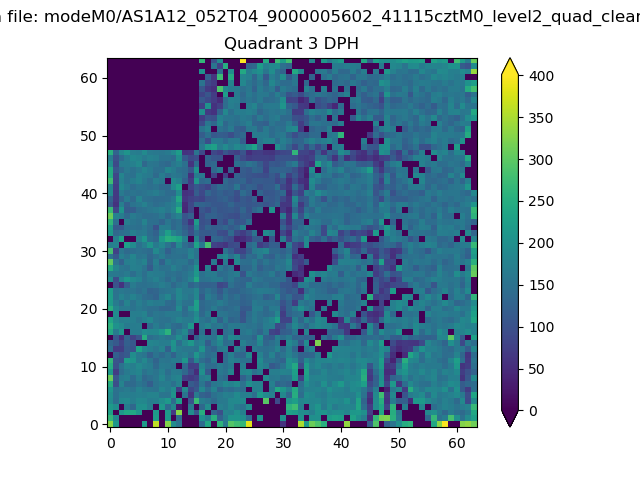 |
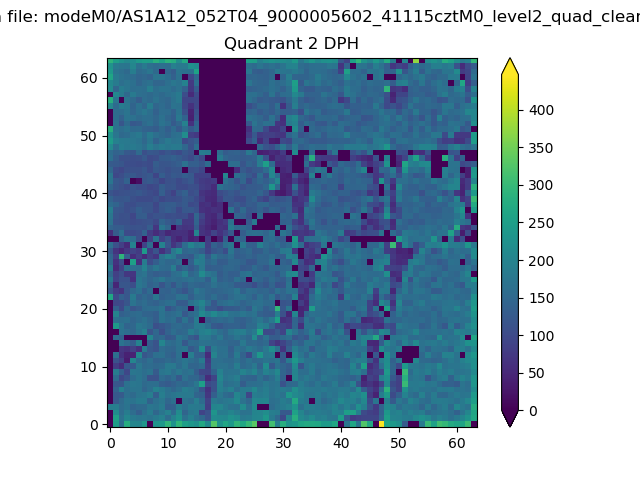 |
Quadrant C |
| Plot type | Count rate plots | Images |
|---|---|---|
| Comparison with Poisson distribution Blue bars denote a histogram of data divided into 1 sec bins. Red curve is a Poisson curve with rate = median count rate of data. |
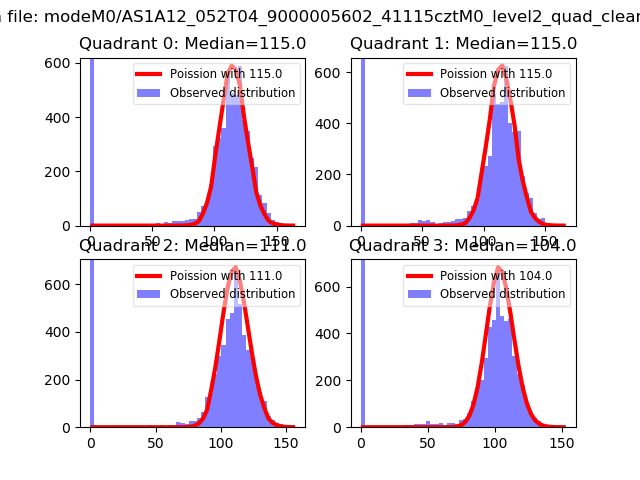 |
 |
| Quadrant-wise count rates Data is divided into 100 sec bins |
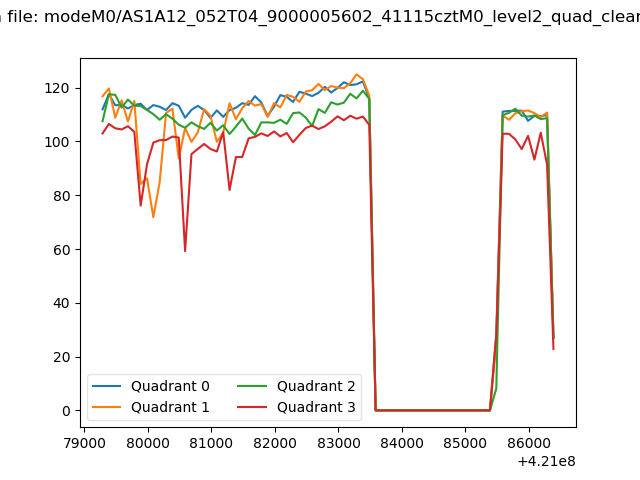 |
|
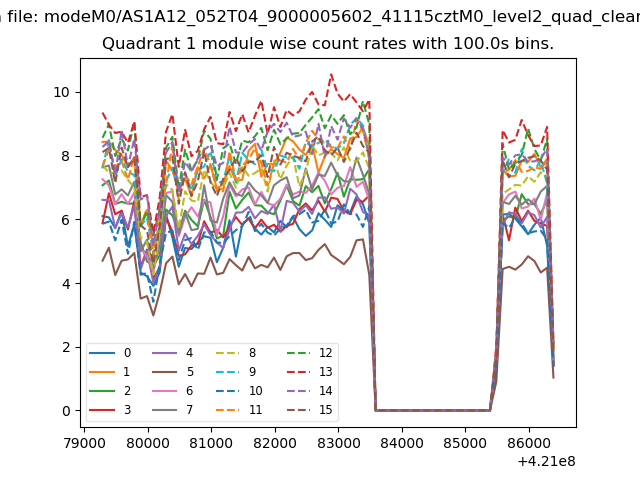
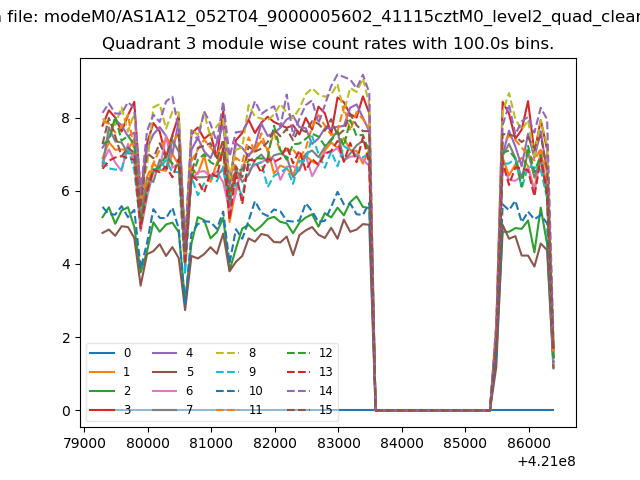
| Module-wise count rates for Quadrant A Data is divided into 100 sec bins |
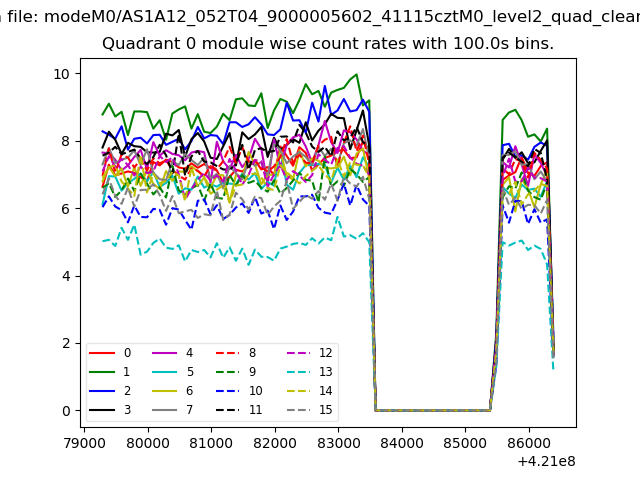 |
 |
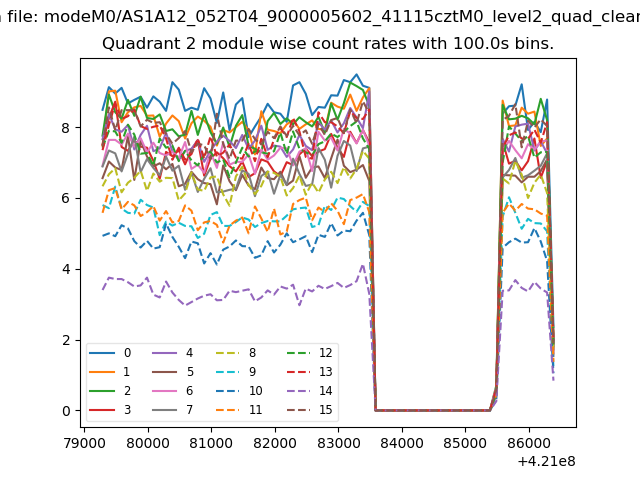
| Module-wise count rates for Quadrant B Data is divided into 100 sec bins |
 |
 |
| Module-wise count rates for Quadrant C Data is divided into 100 sec bins |
 |
 |
| Module-wise count rates for Quadrant D Data is divided into 100 sec bins |
 |
 |
| Parameter | Plot |
|---|---|
| CZT HV Monitor | 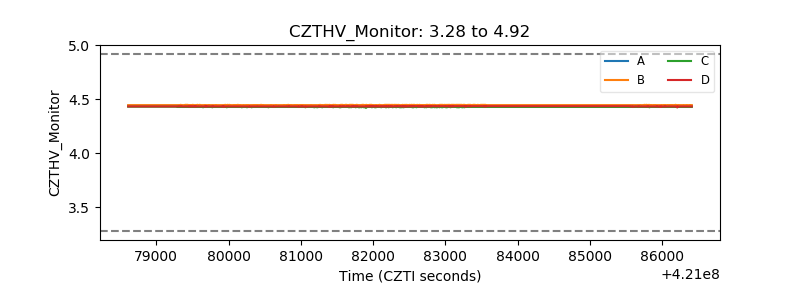 |
| D_VDD | 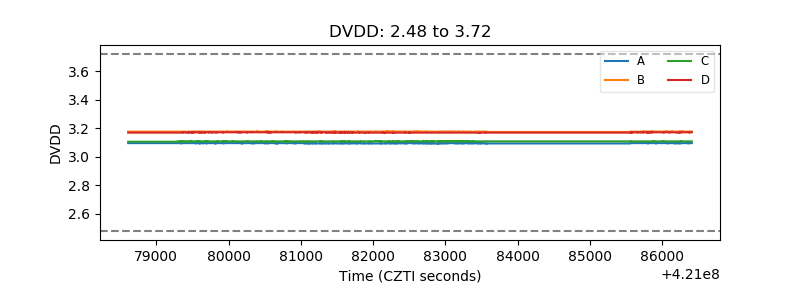 |
| Temperature 1 | 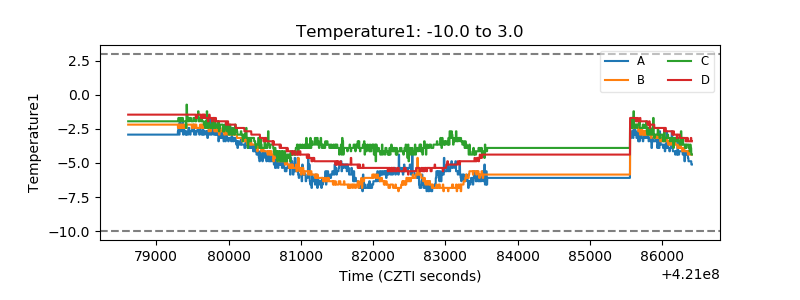 |
| Veto HV Monitor | 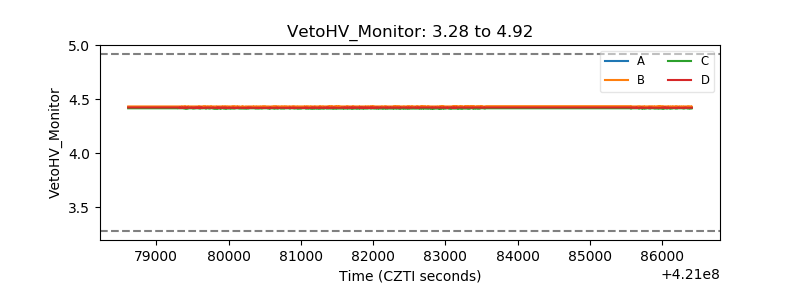 |
| Veto LLD | 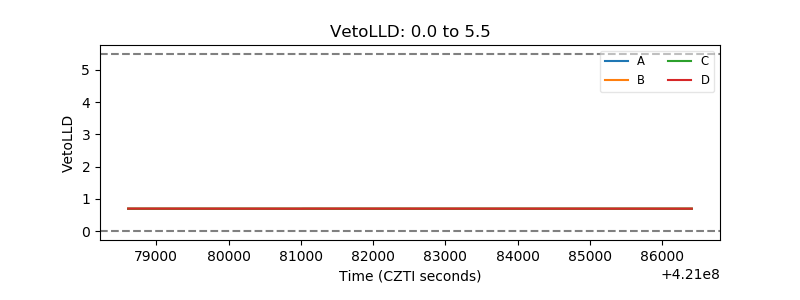 |
| Alpha Counter | 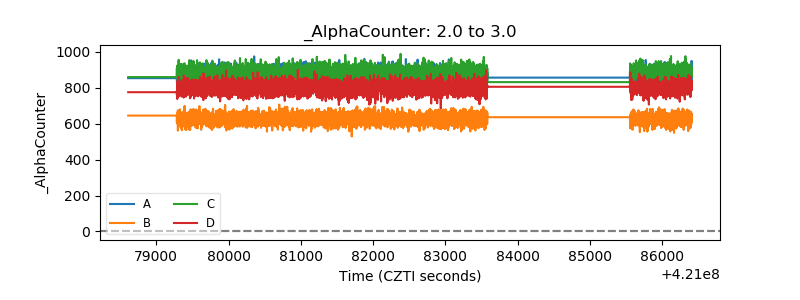 |
| _CPM_Rate | 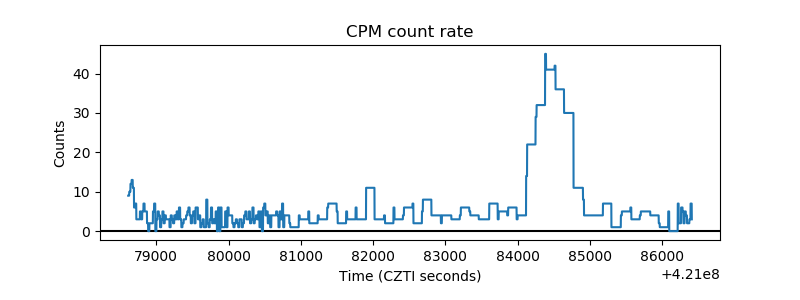 |
| CZT Counter | 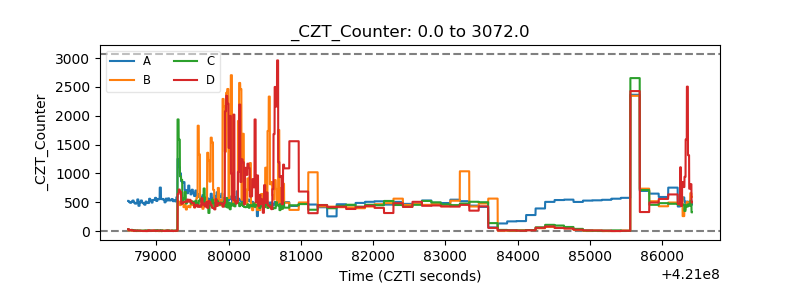 |
| +2.5 Volts monitor | 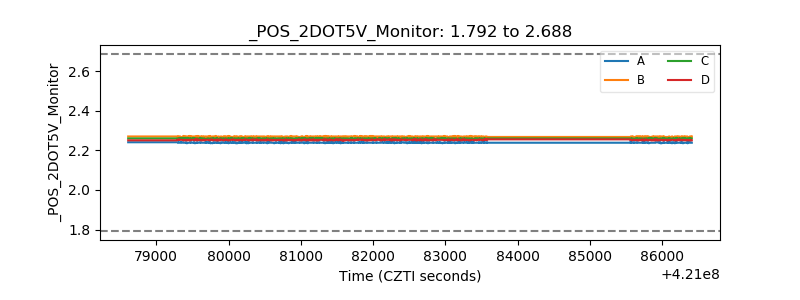 |
| +5 Volts monitor | 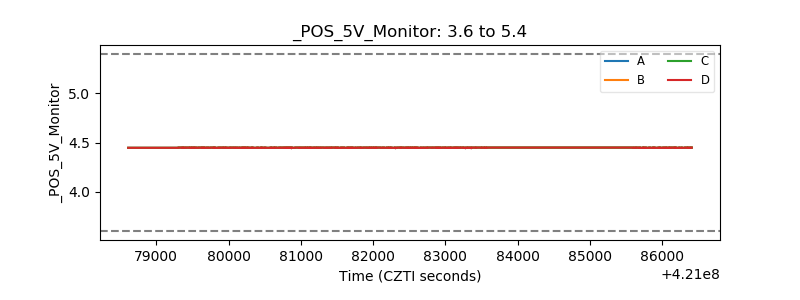 |
| _ROLL_ROT | 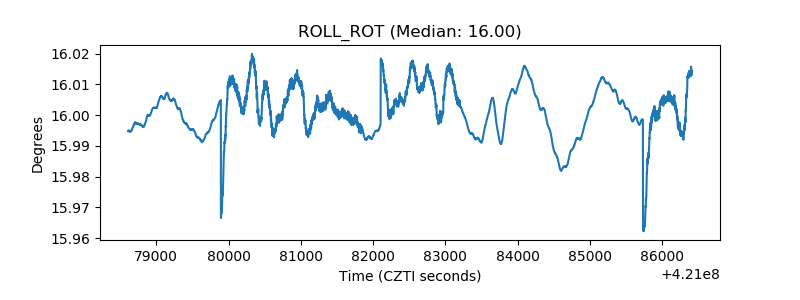 |
| _Roll_DEC | 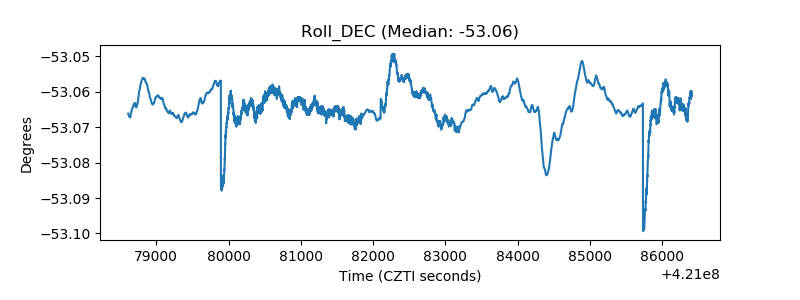 |
| _Roll_RA | 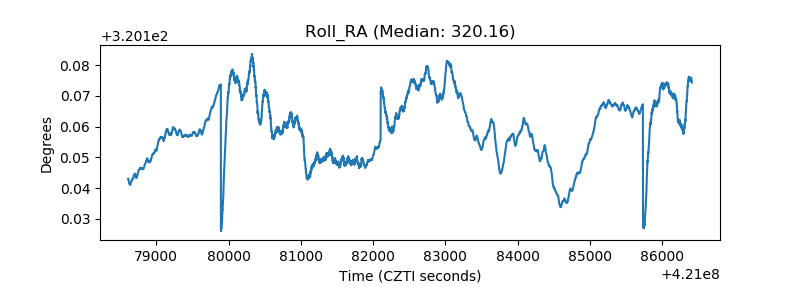 |
| Veto Counter | 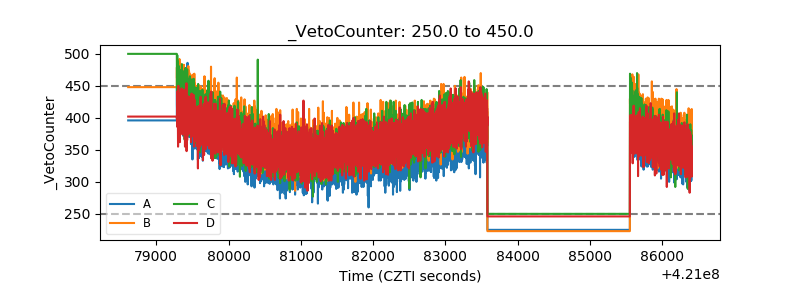 |