| Param | Original file | Final file |
|---|---|---|
| Filename | modeM0/AS1A12_052T04_9000005602_41116cztM0_level2.fits | modeM0/AS1A12_052T04_9000005602_41116cztM0_level2_quad_clean.evt |
| Size (bytes) | 352,255,680 | 89,521,920 |
| Size | 335.9 MB | 85.4 MB |
| Events in quadrant A | 2,923,534 | 606,133 |
| Events in quadrant B | 3,352,842 | 606,522 |
| Events in quadrant C | 2,676,402 | 577,668 |
| Events in quadrant D | 3,665,602 | 541,798 |
| Mode M0 | |||
|---|---|---|---|
| Quadrant | BADHDUFLAG | Total packets | Discarded packets |
| A | 0 | 11964 | 3 |
| B | 0 | 13581 | 2 |
| C | 0 | 11400 | 2 |
| D | 0 | 14593 | 2 |
| Mode M9 | |||
|---|---|---|---|
| Quadrant | BADHDUFLAG | Total packets | Discarded packets |
| A | 0 | 22 | 0 |
| B | 0 | 22 | 0 |
| C | 0 | 22 | 0 |
| D | 0 | 23 | 0 |
| Mode SS | |||
|---|---|---|---|
| Quadrant | BADHDUFLAG | Total packets | Discarded packets |
| A | 0 | 110 | 0 |
| B | 0 | 110 | 0 |
| C | 0 | 110 | 0 |
| D | 0 | 110 | 0 |
| Quadrant | Total seconds | Saturated seconds | Saturation percentage |
|---|---|---|---|
| A | 5408 | 17 | 0.314349% |
| B | 5408 | 101 | 1.867604% |
| C | 5408 | 65 | 1.201923% |
| D | 5408 | 133 | 2.459320% |
Noise dominated data is calculated using 1-second bins in cleaned event files. If a bin has >2000 counts, and if more than 50% of those come from <1% of pixels, then it is considered to be noise-dominated and hence unusable.
| Quadrant | # 1 sec bins | Bins with >0 counts | Bins with >2000 counts | High rate bins dominated by noise | Noise dominated (total time) | Noise dominated (detector-on time) | Marked lightcurve |
|---|---|---|---|---|---|---|---|
| A | 7020 | 5409 | 4 | 4 | 0.06% | 0.07% | 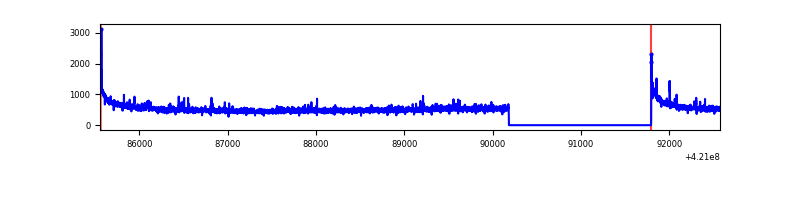 |
| B | 7020 | 5409 | 55 | 55 | 0.78% | 1.02% | 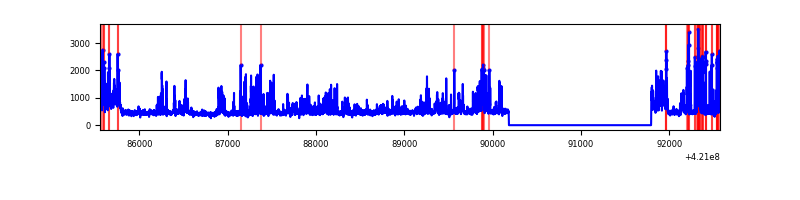 |
| C | 7020 | 5409 | 61 | 61 | 0.87% | 1.13% | 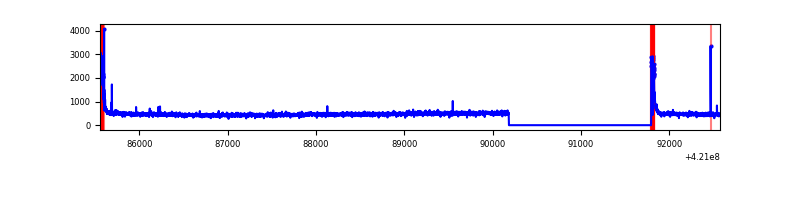 |
| D | 7020 | 5409 | 142 | 142 | 2.02% | 2.63% | 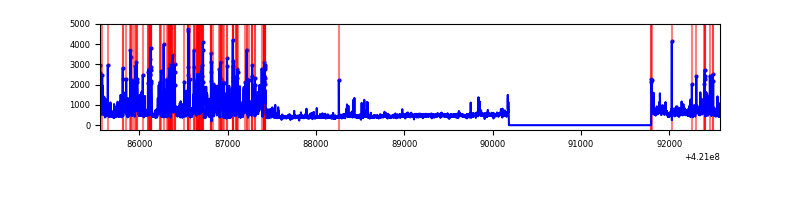 |
Top three noisy pixels from each quadrant. If the there are fewer than three noisy pixels in the level2.evt file, extra rows are filled as -1
| Pixel properties | Quadrant properties | ||||||
|---|---|---|---|---|---|---|---|
| Quadrant | DetID | PixID | Counts | Sigma | Mean | Median | Sigma |
| A | 10 | 83 | 528768 | 4330.35 | 596 | 584 | 122.0 |
| A | 13 | 248 | 40065 | 323.69 | 596 | 584 | 122.0 |
| A | 2 | 79 | 30261 | 243.31 | 596 | 584 | 122.0 |
| B | 0 | 245 | 688924 | 6059.49 | 586 | 568 | 113.6 |
| B | 0 | 186 | 255011 | 2239.82 | 586 | 568 | 113.6 |
| B | 0 | 190 | 65317 | 569.98 | 586 | 568 | 113.6 |
| C | 15 | 214 | 232938 | 1736.06 | 576 | 579 | 133.8 |
| C | 0 | 10 | 175451 | 1306.55 | 576 | 579 | 133.8 |
| C | 14 | 254 | 8802 | 61.44 | 576 | 579 | 133.8 |
| D | 12 | 217 | 905854 | 6491.35 | 576 | 560 | 139.5 |
| D | 9 | 49 | 164834 | 1177.92 | 576 | 560 | 139.5 |
| D | 13 | 249 | 152479 | 1089.32 | 576 | 560 | 139.5 |
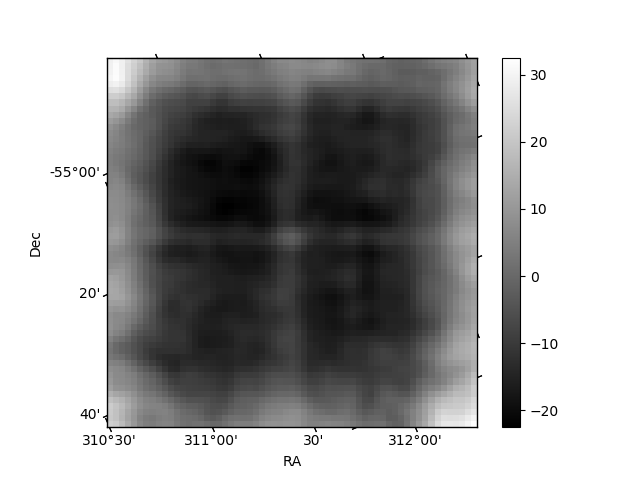
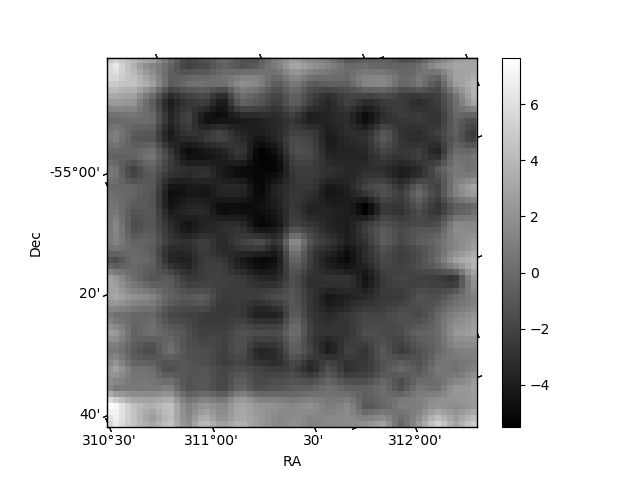
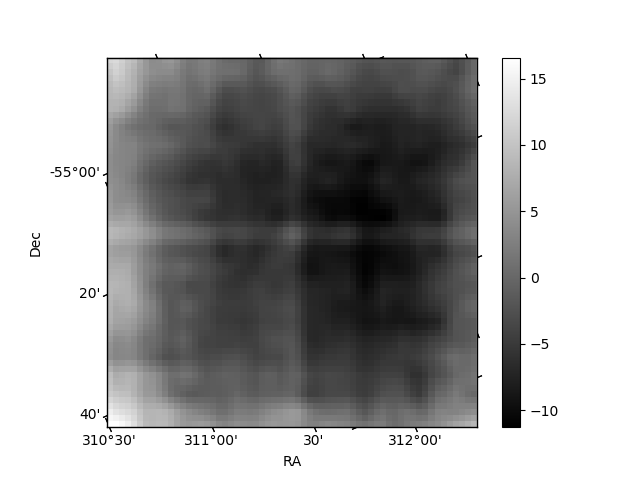
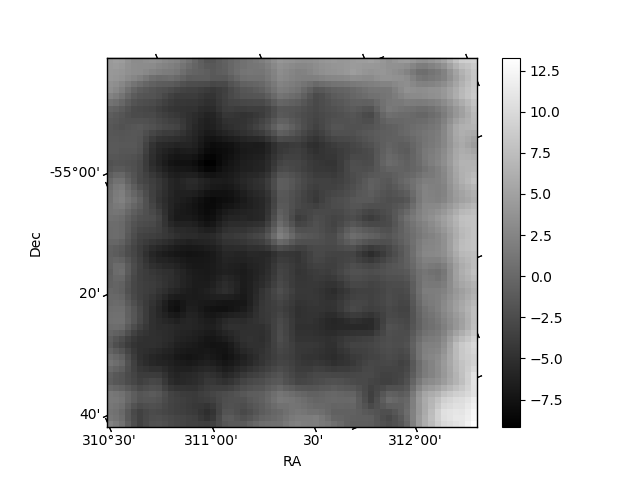
Histogram calculated using DETX and DETY for each event in the final _common_clean file
| Quadrant A | 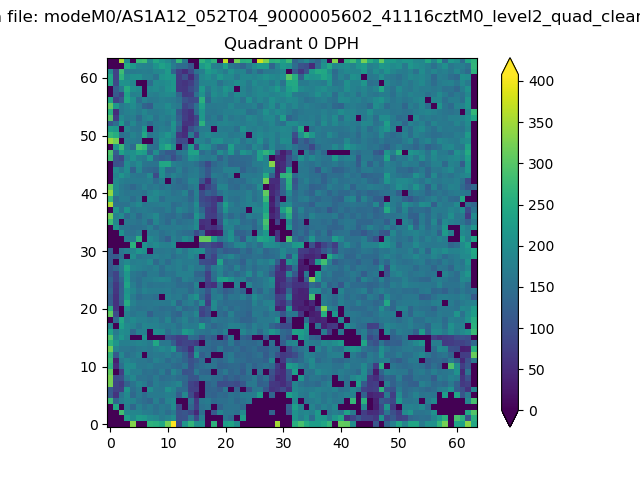 |
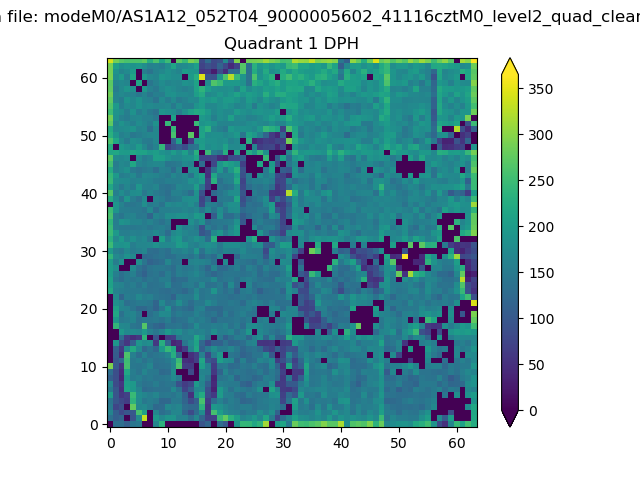 |
Quadrant B |
|---|---|---|---|
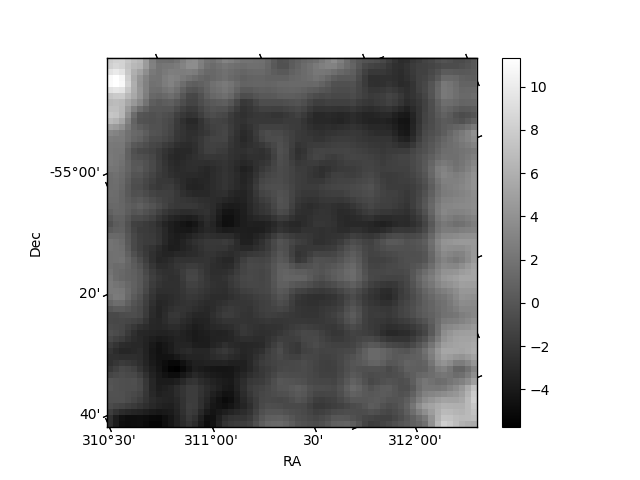
| Quadrant D | 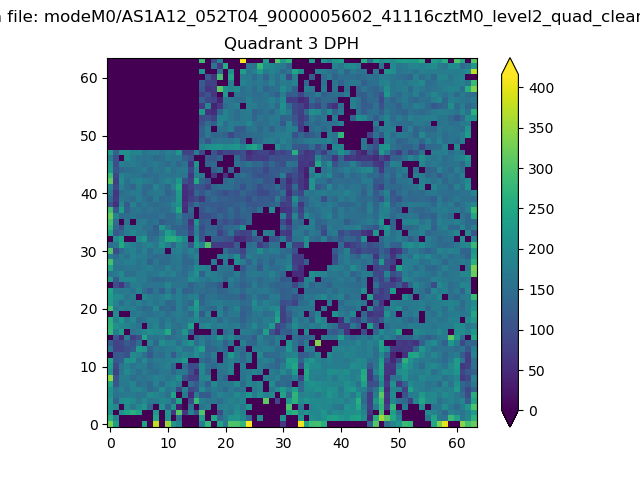 |
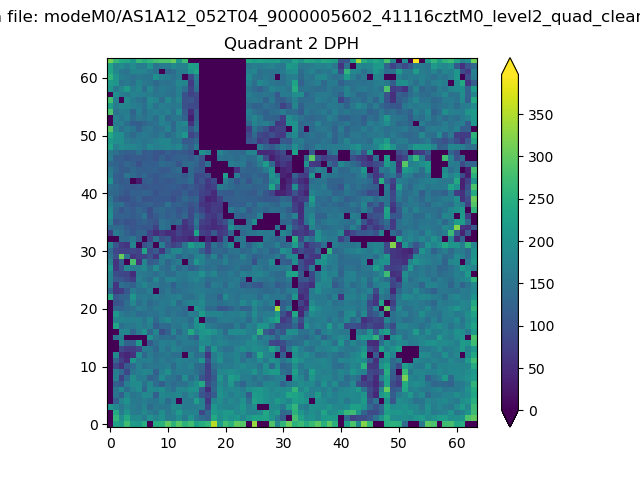 |
Quadrant C |
| Plot type | Count rate plots | Images |
|---|---|---|
| Comparison with Poisson distribution Blue bars denote a histogram of data divided into 1 sec bins. Red curve is a Poisson curve with rate = median count rate of data. |
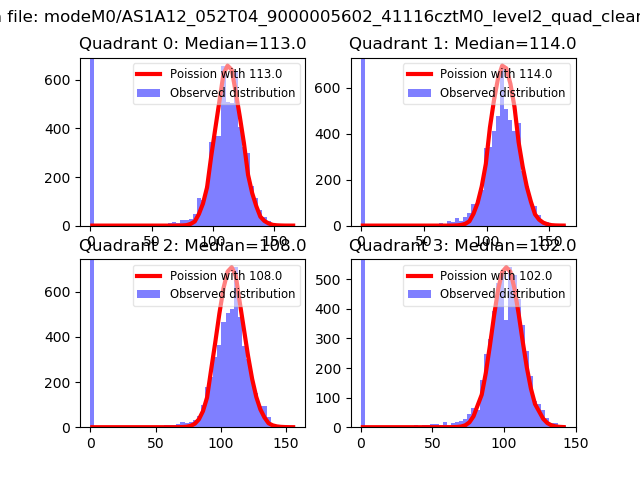 |
 |
| Quadrant-wise count rates Data is divided into 100 sec bins |
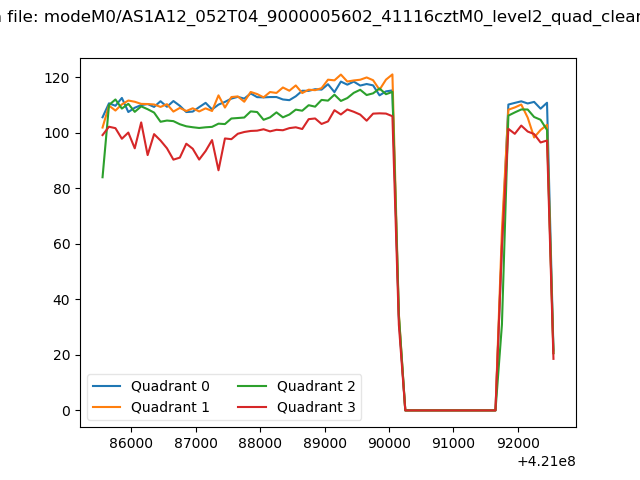 |
|
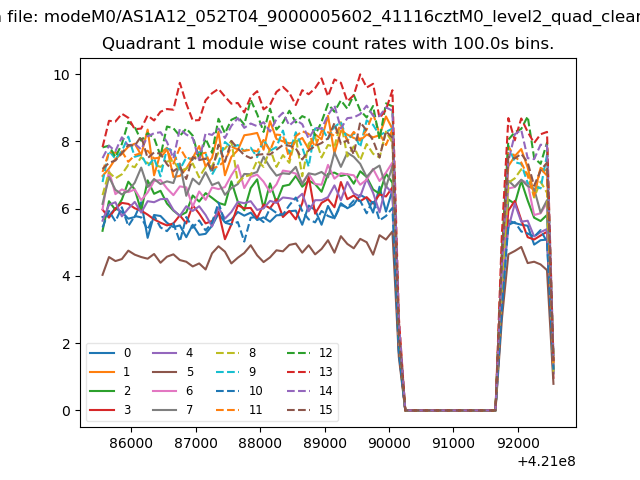
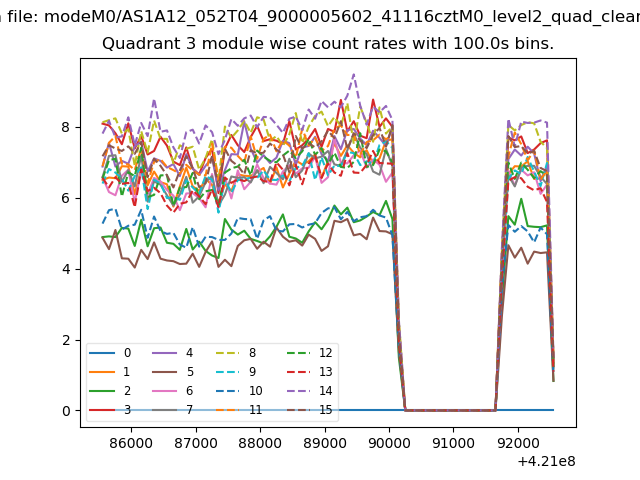
| Module-wise count rates for Quadrant A Data is divided into 100 sec bins |
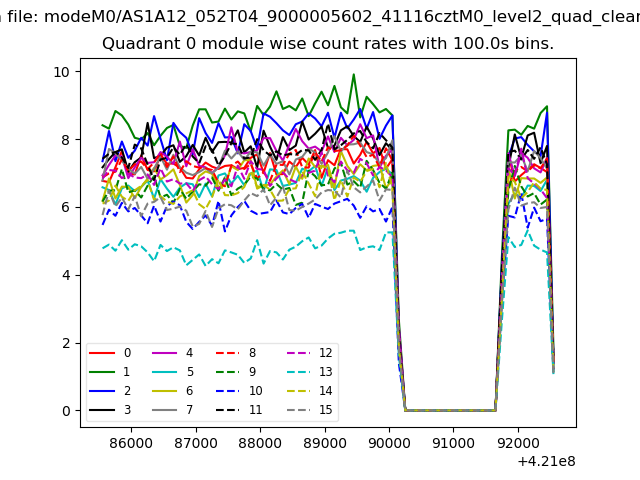 |
 |
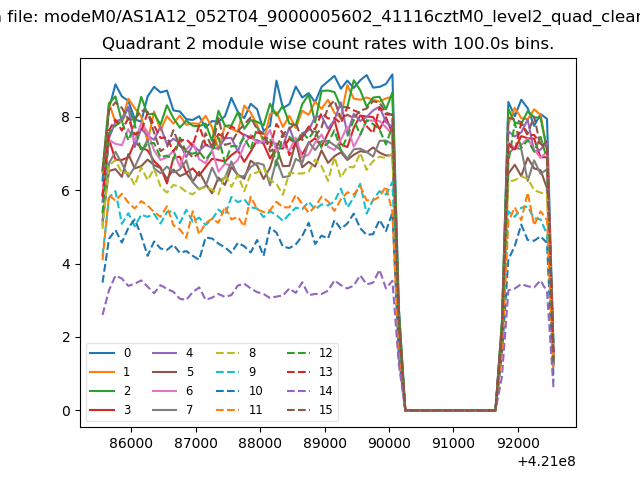
| Module-wise count rates for Quadrant B Data is divided into 100 sec bins |
 |
 |
| Module-wise count rates for Quadrant C Data is divided into 100 sec bins |
 |
 |
| Module-wise count rates for Quadrant D Data is divided into 100 sec bins |
 |
 |
| Parameter | Plot |
|---|---|
| CZT HV Monitor | 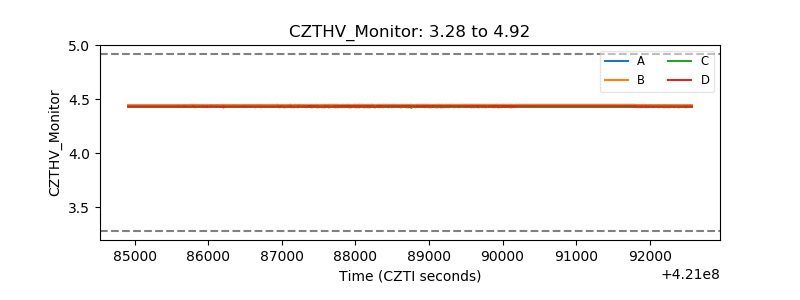 |
| D_VDD | 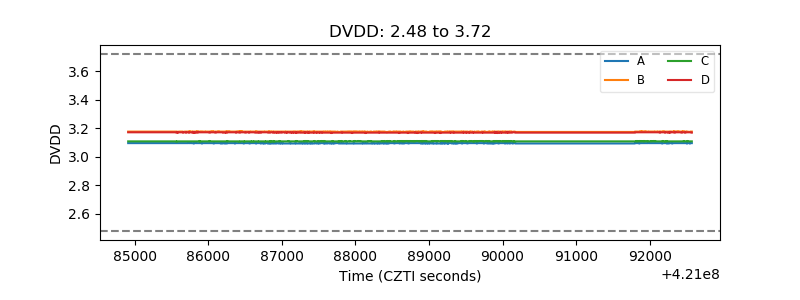 |
| Temperature 1 | 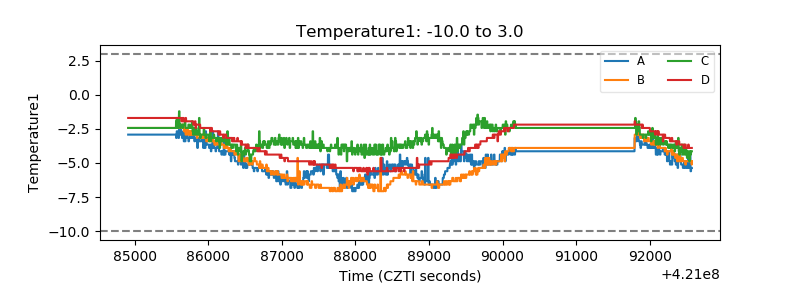 |
| Veto HV Monitor | 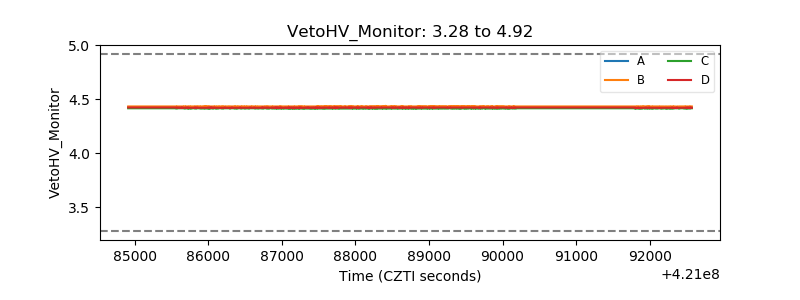 |
| Veto LLD | 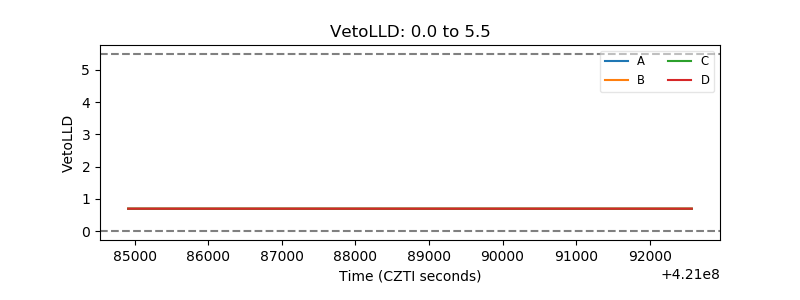 |
| Alpha Counter | 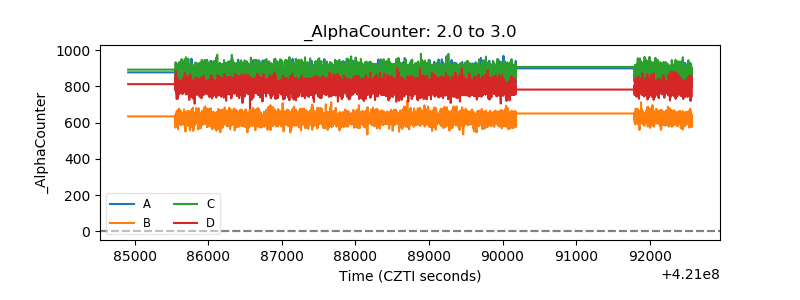 |
| _CPM_Rate | 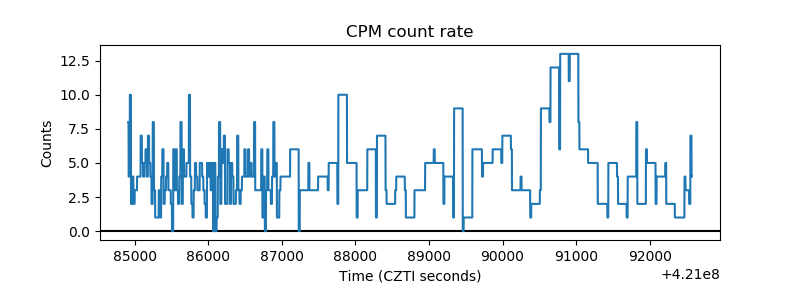 |
| CZT Counter | 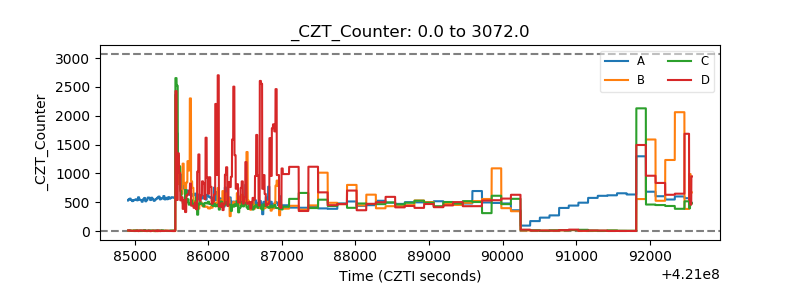 |
| +2.5 Volts monitor | 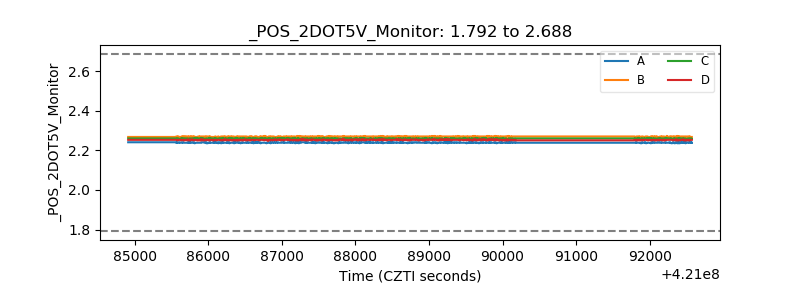 |
| +5 Volts monitor |  |
| _ROLL_ROT | 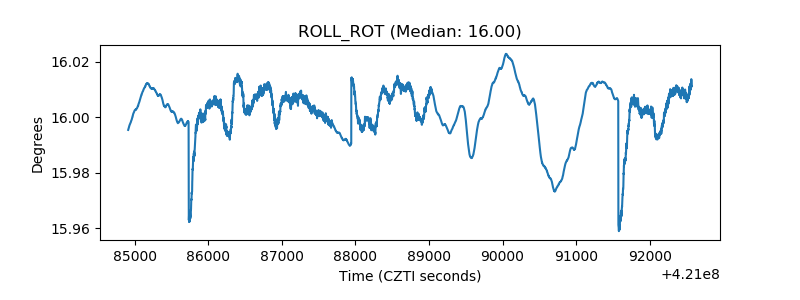 |
| _Roll_DEC | 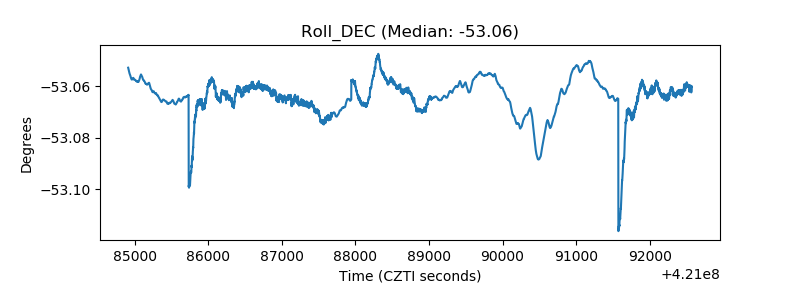 |
| _Roll_RA | 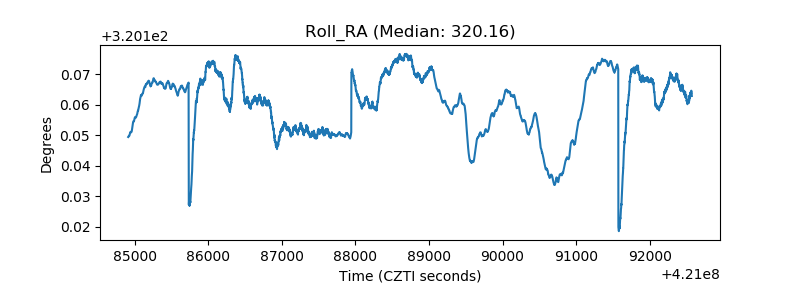 |
| Veto Counter | 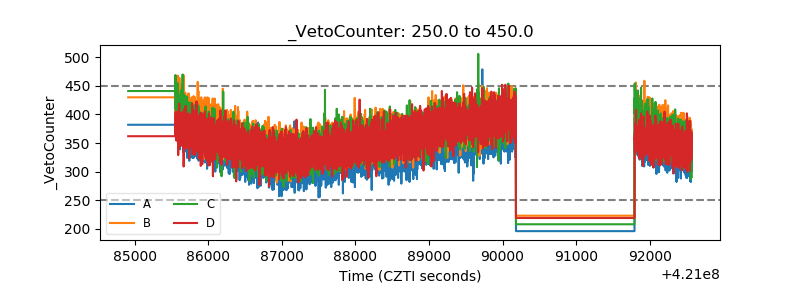 |