| Param | Original file | Final file |
|---|---|---|
| Filename | modeM0/AS1A12_052T04_9000005602_41117cztM0_level2.fits | modeM0/AS1A12_052T04_9000005602_41117cztM0_level2_quad_clean.evt |
| Size (bytes) | 414,057,600 | 92,528,640 |
| Size | 394.9 MB | 88.2 MB |
| Events in quadrant A | 3,140,821 | 642,250 |
| Events in quadrant B | 5,482,241 | 570,827 |
| Events in quadrant C | 2,806,815 | 612,175 |
| Events in quadrant D | 3,448,929 | 573,362 |
| Mode M0 | |||
|---|---|---|---|
| Quadrant | BADHDUFLAG | Total packets | Discarded packets |
| A | 0 | 12745 | 3 |
| B | 0 | 20181 | 2 |
| C | 0 | 12017 | 2 |
| D | 0 | 14218 | 2 |
| Mode M9 | |||
|---|---|---|---|
| Quadrant | BADHDUFLAG | Total packets | Discarded packets |
| A | 0 | 14 | 0 |
| B | 0 | 14 | 0 |
| C | 0 | 14 | 0 |
| D | 0 | 14 | 0 |
| Mode SS | |||
|---|---|---|---|
| Quadrant | BADHDUFLAG | Total packets | Discarded packets |
| A | 0 | 118 | 0 |
| B | 0 | 118 | 0 |
| C | 0 | 118 | 0 |
| D | 0 | 118 | 0 |
| Quadrant | Total seconds | Saturated seconds | Saturation percentage |
|---|---|---|---|
| A | 5762 | 15 | 0.260326% |
| B | 5762 | 898 | 15.584866% |
| C | 5762 | 54 | 0.937175% |
| D | 5763 | 94 | 1.631095% |
Noise dominated data is calculated using 1-second bins in cleaned event files. If a bin has >2000 counts, and if more than 50% of those come from <1% of pixels, then it is considered to be noise-dominated and hence unusable.
| Quadrant | # 1 sec bins | Bins with >0 counts | Bins with >2000 counts | High rate bins dominated by noise | Noise dominated (total time) | Noise dominated (detector-on time) | Marked lightcurve |
|---|---|---|---|---|---|---|---|
| A | 7134 | 5763 | 5 | 5 | 0.07% | 0.09% | 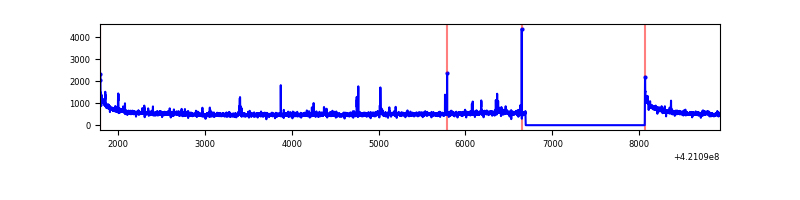 |
| B | 7134 | 5763 | 720 | 720 | 10.09% | 12.49% | 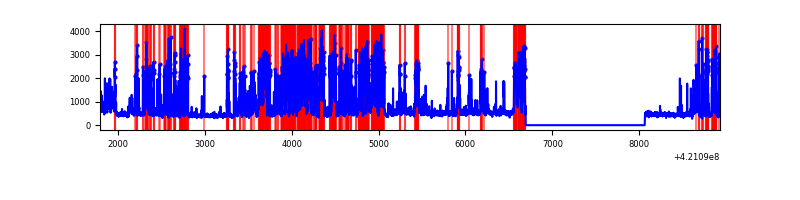 |
| C | 7134 | 5763 | 46 | 46 | 0.64% | 0.80% | 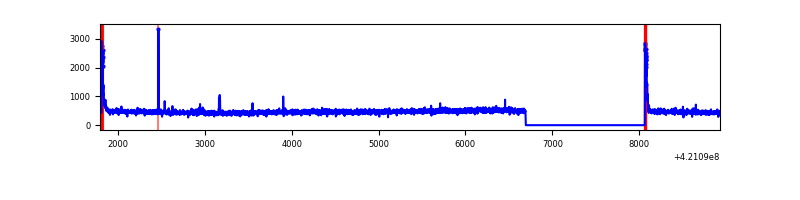 |
| D | 7135 | 5764 | 92 | 92 | 1.29% | 1.60% | 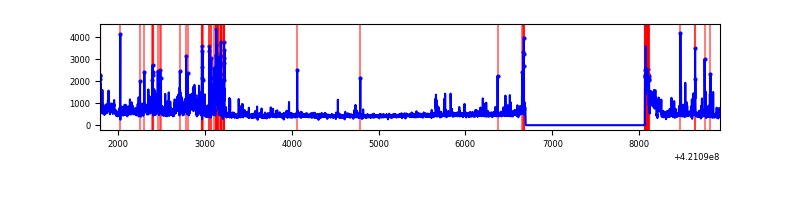 |
Top three noisy pixels from each quadrant. If the there are fewer than three noisy pixels in the level2.evt file, extra rows are filled as -1
| Pixel properties | Quadrant properties | ||||||
|---|---|---|---|---|---|---|---|
| Quadrant | DetID | PixID | Counts | Sigma | Mean | Median | Sigma |
| A | 10 | 83 | 541860 | 4140.78 | 636 | 623 | 130.7 |
| A | 2 | 79 | 60044 | 454.61 | 636 | 623 | 130.7 |
| A | 13 | 248 | 55588 | 420.51 | 636 | 623 | 130.7 |
| B | 0 | 245 | 2950061 | 25146.25 | 600 | 581 | 117.3 |
| B | 0 | 186 | 106451 | 902.61 | 600 | 581 | 117.3 |
| B | 0 | 190 | 47564 | 400.56 | 600 | 581 | 117.3 |
| C | 15 | 214 | 246374 | 1728.76 | 614 | 620 | 142.2 |
| C | 0 | 10 | 142381 | 997.22 | 614 | 620 | 142.2 |
| C | 14 | 254 | 11439 | 76.11 | 614 | 620 | 142.2 |
| D | 12 | 217 | 246082 | 1631.82 | 616 | 596 | 150.4 |
| D | 2 | 16 | 207066 | 1372.47 | 616 | 596 | 150.4 |
| D | 9 | 49 | 202821 | 1344.25 | 616 | 596 | 150.4 |
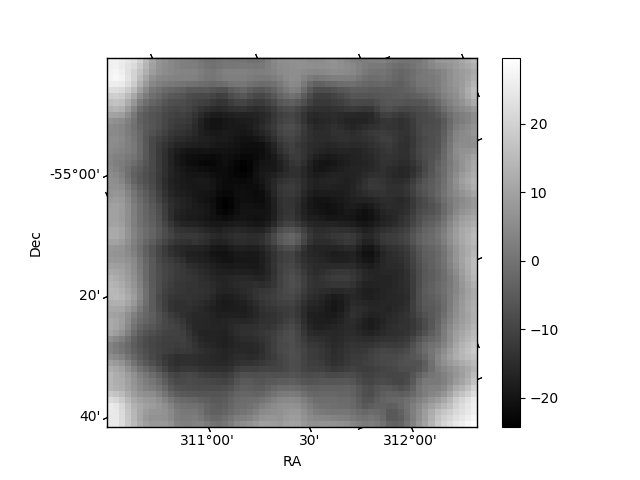
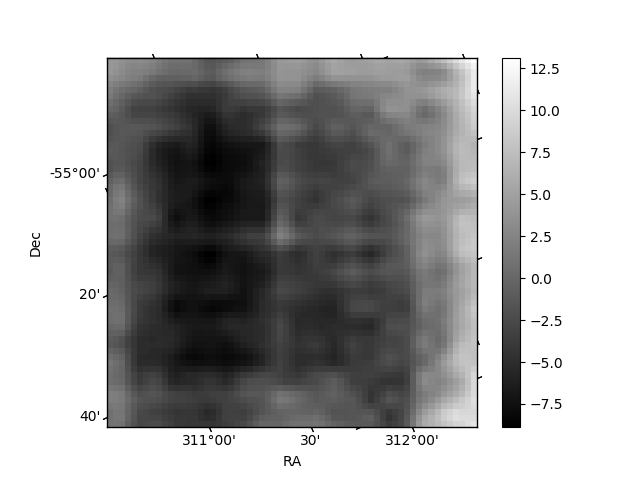
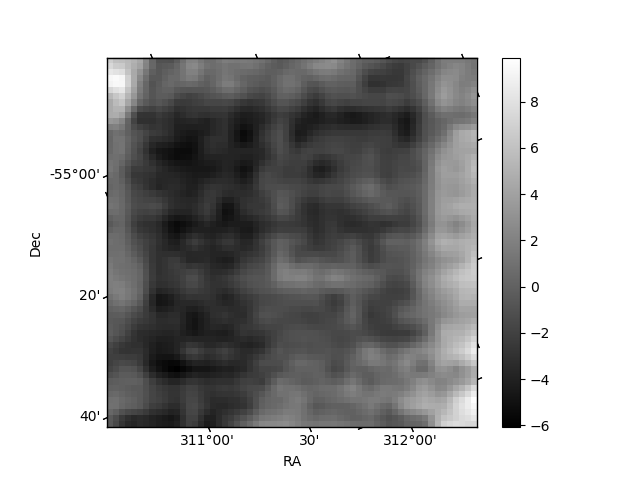
Histogram calculated using DETX and DETY for each event in the final _common_clean file
| Quadrant A | 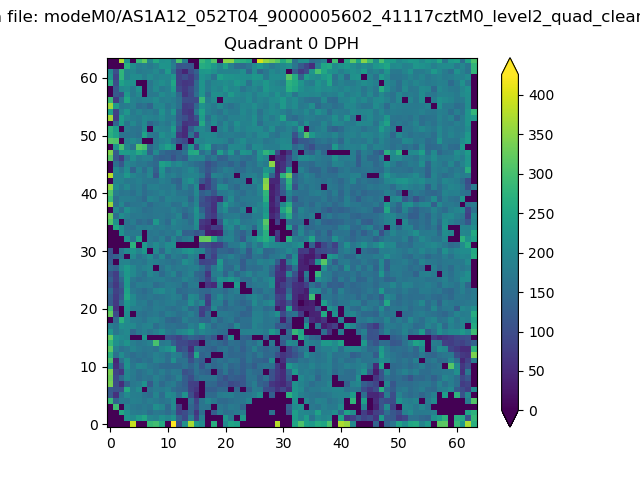 |
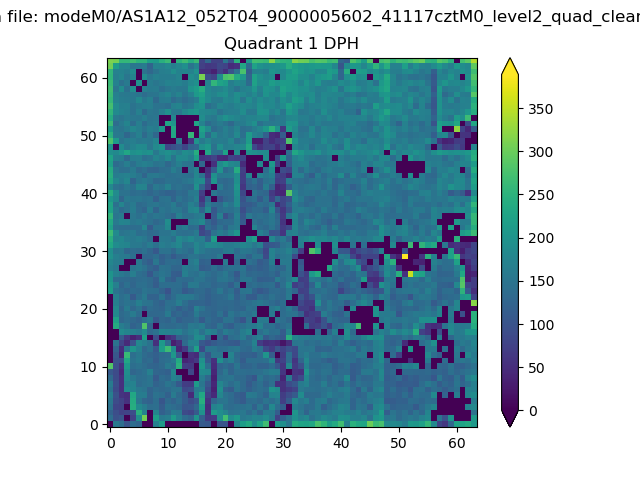 |
Quadrant B |
|---|---|---|---|
| Quadrant D | 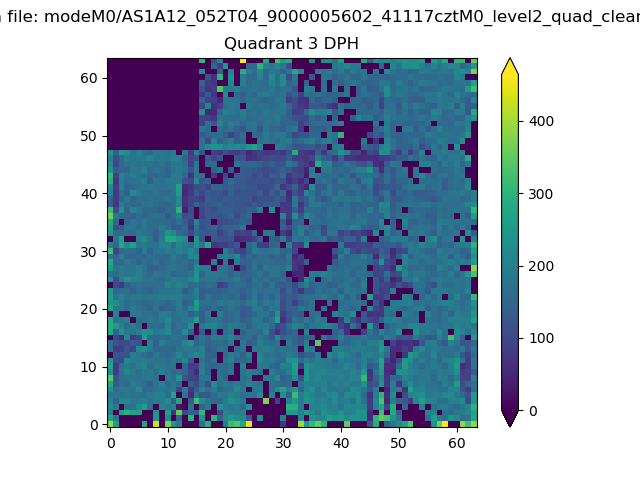 |
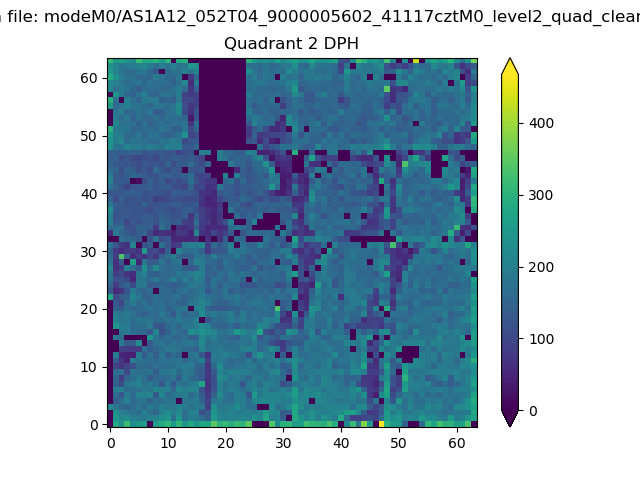 |
Quadrant C |
| Plot type | Count rate plots | Images |
|---|---|---|
| Comparison with Poisson distribution Blue bars denote a histogram of data divided into 1 sec bins. Red curve is a Poisson curve with rate = median count rate of data. |
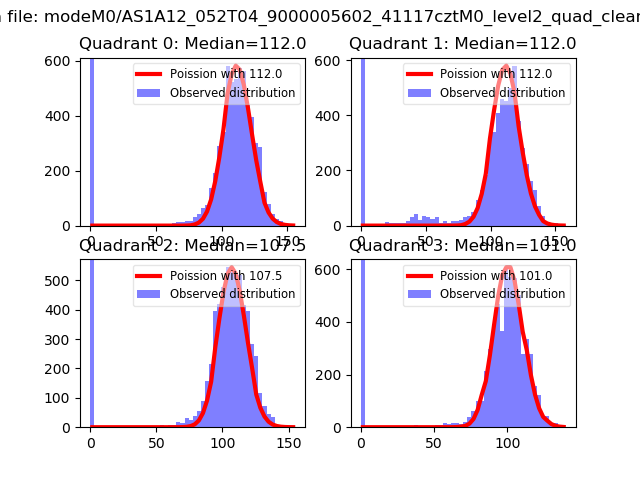 |
 |
| Quadrant-wise count rates Data is divided into 100 sec bins |
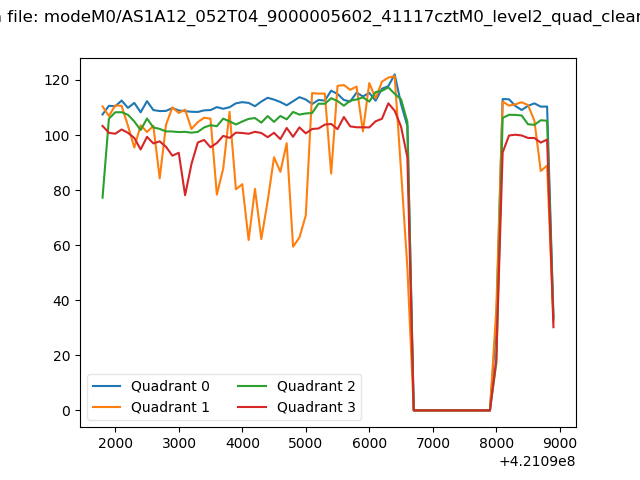 |
|
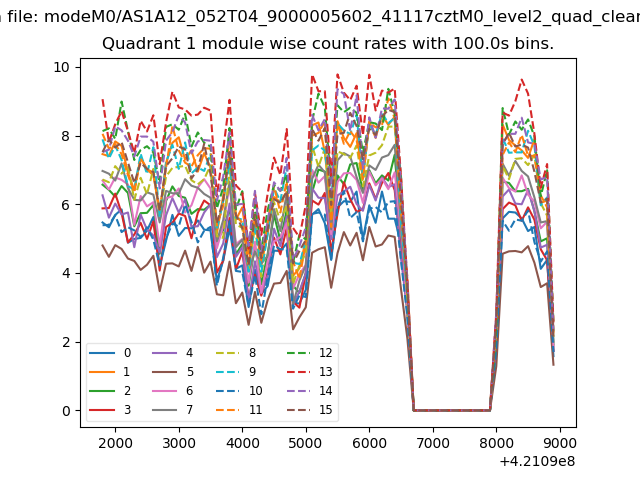
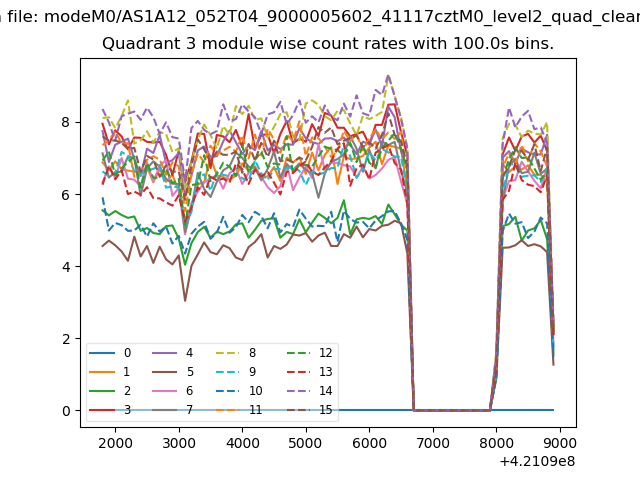
| Module-wise count rates for Quadrant A Data is divided into 100 sec bins |
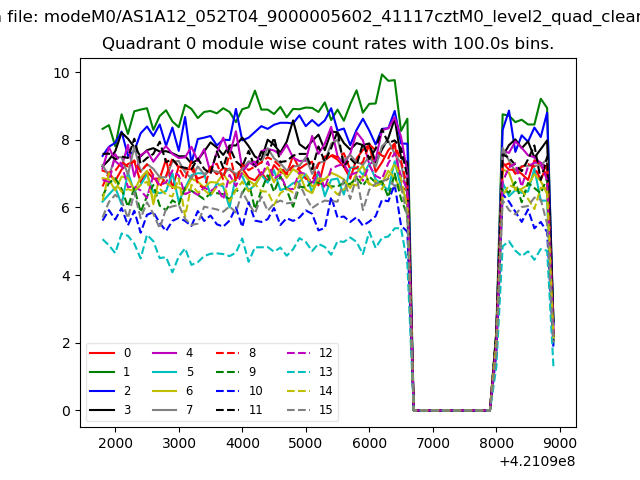 |
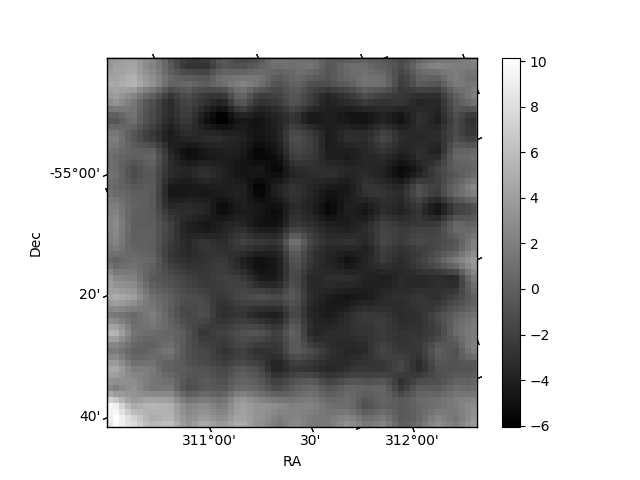 |
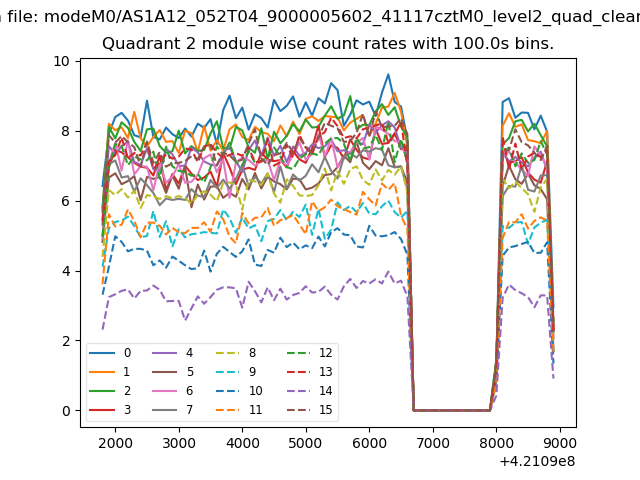
| Module-wise count rates for Quadrant B Data is divided into 100 sec bins |
 |
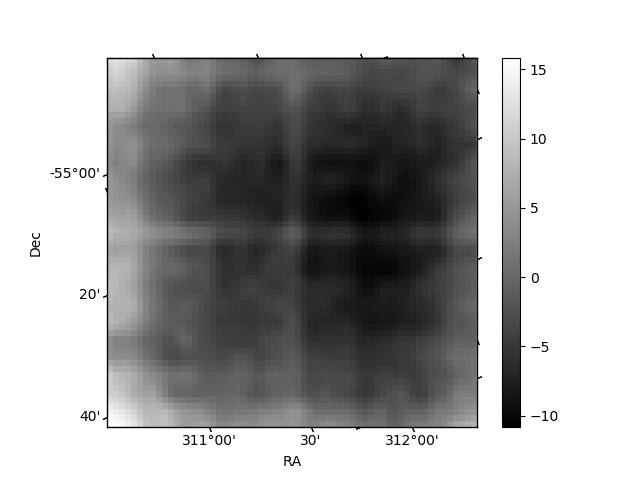 |
| Module-wise count rates for Quadrant C Data is divided into 100 sec bins |
 |
 |
| Module-wise count rates for Quadrant D Data is divided into 100 sec bins |
 |
 |
| Parameter | Plot |
|---|---|
| CZT HV Monitor | 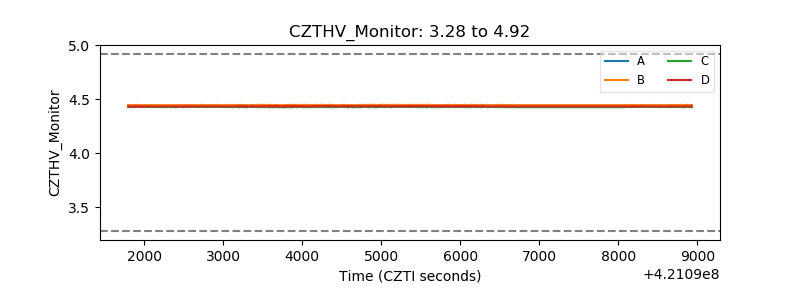 |
| D_VDD | 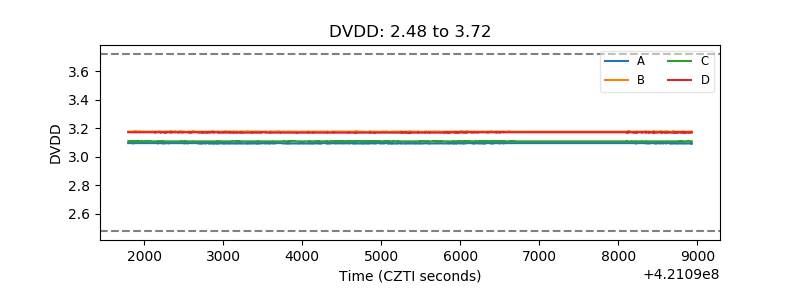 |
| Temperature 1 | 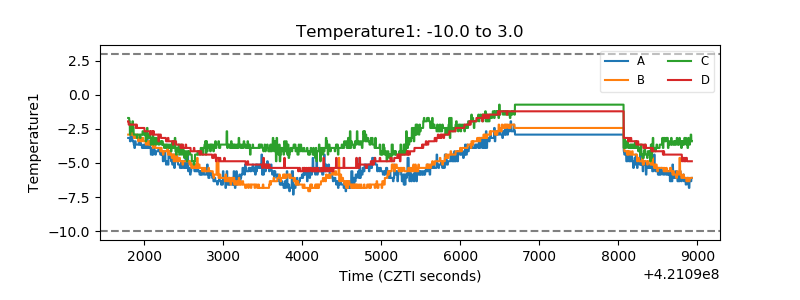 |
| Veto HV Monitor | 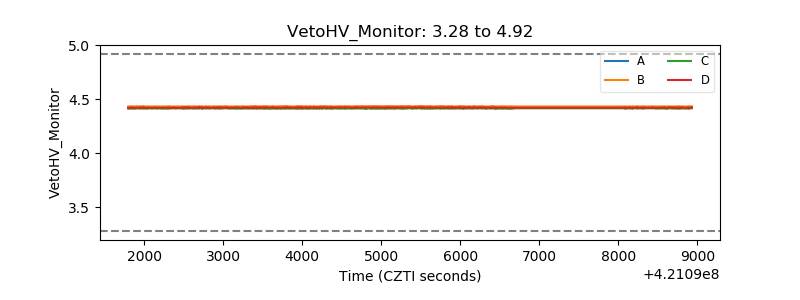 |
| Veto LLD | 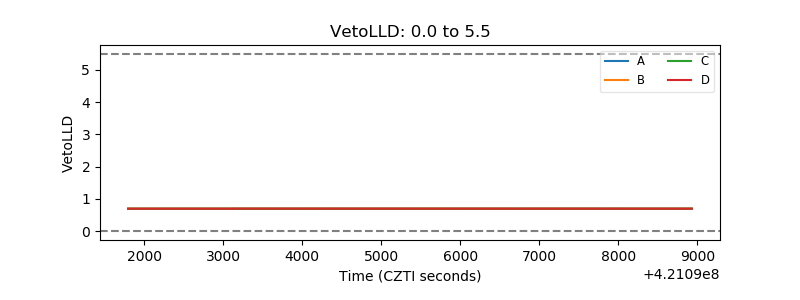 |
| Alpha Counter | 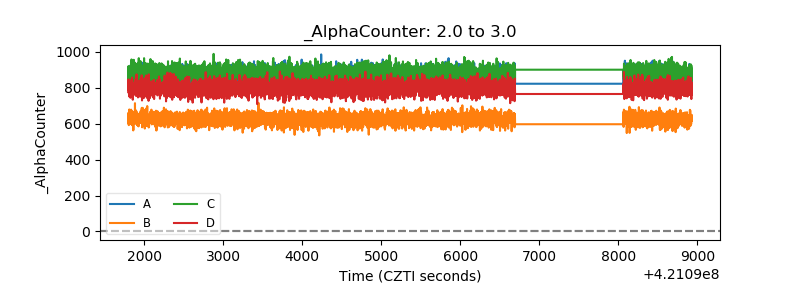 |
| _CPM_Rate | 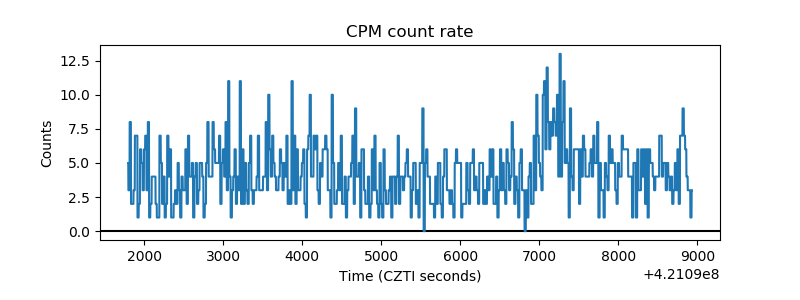 |
| CZT Counter | 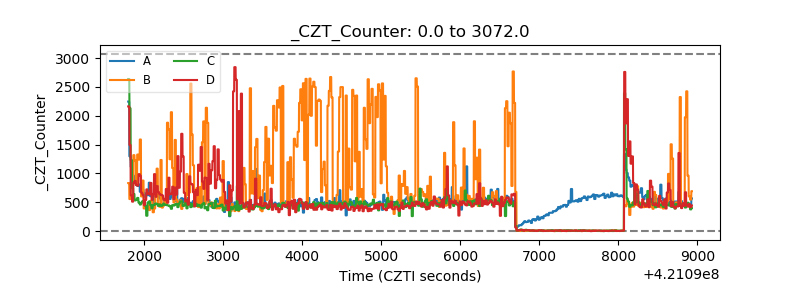 |
| +2.5 Volts monitor | 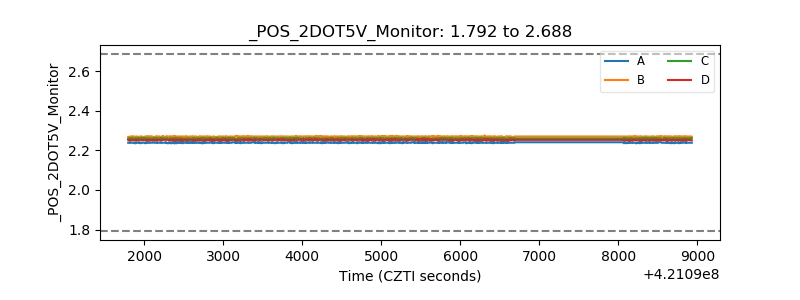 |
| +5 Volts monitor |  |
| _ROLL_ROT | 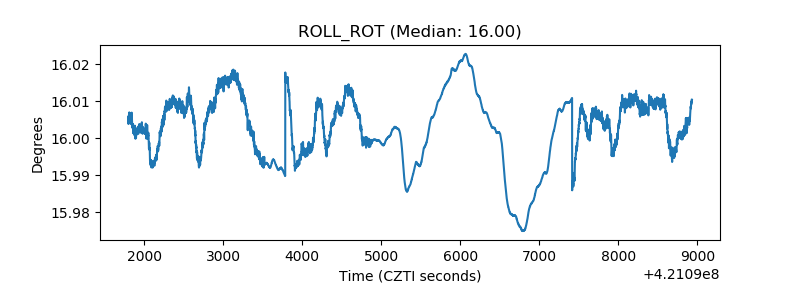 |
| _Roll_DEC | 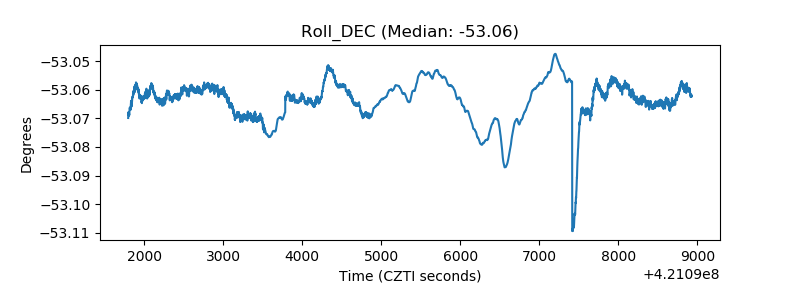 |
| _Roll_RA | 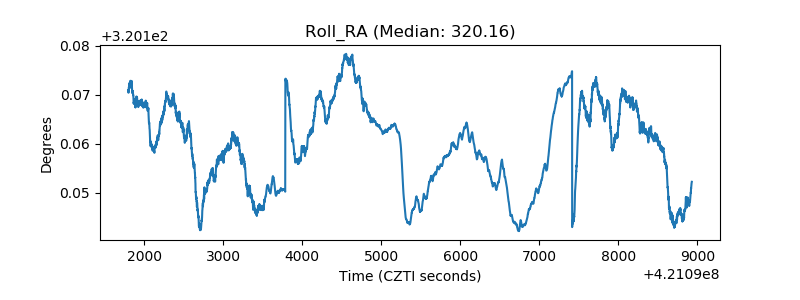 |
| Veto Counter | 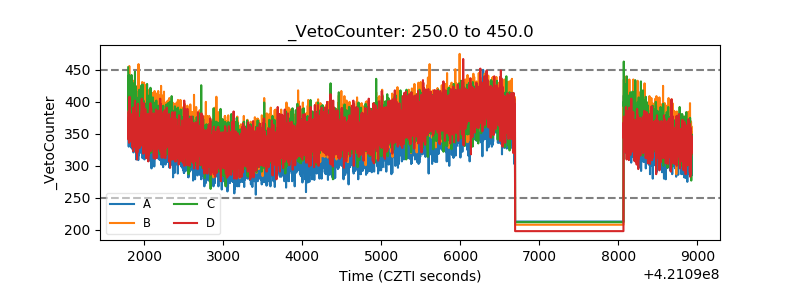 |