| Param | Original file | Final file |
|---|---|---|
| Filename | modeM0/AS1A12_052T04_9000005602_41118cztM0_level2.fits | modeM0/AS1A12_052T04_9000005602_41118cztM0_level2_quad_clean.evt |
| Size (bytes) | 393,793,920 | 97,125,120 |
| Size | 375.6 MB | 92.6 MB |
| Events in quadrant A | 3,174,514 | 666,060 |
| Events in quadrant B | 4,005,709 | 640,148 |
| Events in quadrant C | 2,905,297 | 633,902 |
| Events in quadrant D | 4,026,470 | 583,242 |
| Mode M0 | |||
|---|---|---|---|
| Quadrant | BADHDUFLAG | Total packets | Discarded packets |
| A | 0 | 13016 | 3 |
| B | 0 | 16055 | 2 |
| C | 0 | 12390 | 2 |
| D | 0 | 15993 | 2 |
| Mode M9 | |||
|---|---|---|---|
| Quadrant | BADHDUFLAG | Total packets | Discarded packets |
| A | 0 | 15 | 0 |
| B | 0 | 15 | 0 |
| C | 0 | 15 | 0 |
| D | 0 | 16 | 0 |
| Mode SS | |||
|---|---|---|---|
| Quadrant | BADHDUFLAG | Total packets | Discarded packets |
| A | 0 | 122 | 0 |
| B | 0 | 122 | 0 |
| C | 0 | 122 | 0 |
| D | 0 | 122 | 0 |
| Quadrant | Total seconds | Saturated seconds | Saturation percentage |
|---|---|---|---|
| A | 5975 | 25 | 0.418410% |
| B | 5975 | 377 | 6.309623% |
| C | 5975 | 36 | 0.602510% |
| D | 5975 | 183 | 3.062762% |
Noise dominated data is calculated using 1-second bins in cleaned event files. If a bin has >2000 counts, and if more than 50% of those come from <1% of pixels, then it is considered to be noise-dominated and hence unusable.
| Quadrant | # 1 sec bins | Bins with >0 counts | Bins with >2000 counts | High rate bins dominated by noise | Noise dominated (total time) | Noise dominated (detector-on time) | Marked lightcurve |
|---|---|---|---|---|---|---|---|
| A | 7258 | 5976 | 9 | 9 | 0.12% | 0.15% | 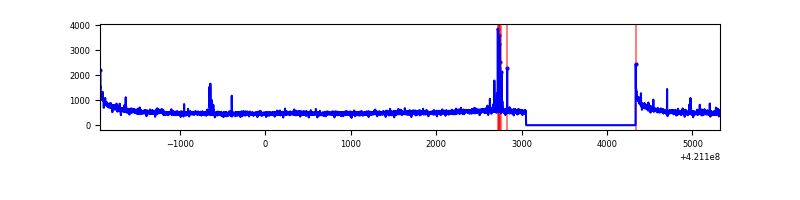 |
| B | 7258 | 5976 | 267 | 267 | 3.68% | 4.47% | 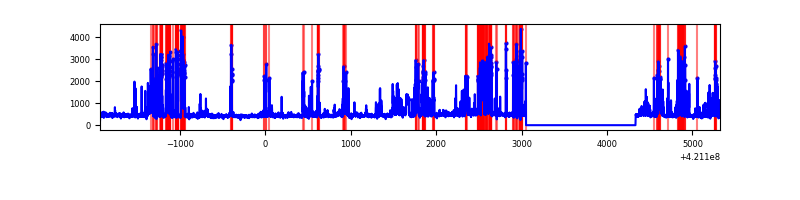 |
| C | 7258 | 5976 | 34 | 34 | 0.47% | 0.57% | 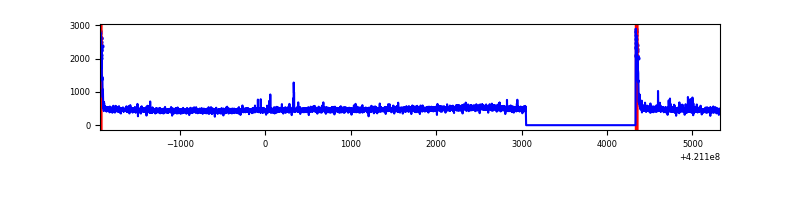 |
| D | 7258 | 5976 | 157 | 157 | 2.16% | 2.63% | 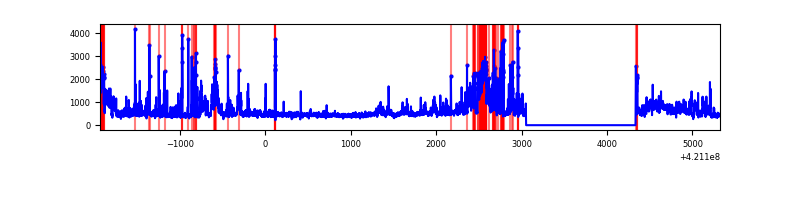 |
Top three noisy pixels from each quadrant. If the there are fewer than three noisy pixels in the level2.evt file, extra rows are filled as -1
| Pixel properties | Quadrant properties | ||||||
|---|---|---|---|---|---|---|---|
| Quadrant | DetID | PixID | Counts | Sigma | Mean | Median | Sigma |
| A | 10 | 83 | 540620 | 3975.98 | 658 | 643 | 135.8 |
| A | 2 | 79 | 57135 | 415.96 | 658 | 643 | 135.8 |
| A | 13 | 248 | 13599 | 95.4 | 658 | 643 | 135.8 |
| B | 0 | 245 | 1386898 | 11141.06 | 639 | 620 | 124.4 |
| B | 0 | 190 | 43175 | 342.0 | 639 | 620 | 124.4 |
| B | 15 | 32 | 29144 | 229.24 | 639 | 620 | 124.4 |
| C | 15 | 214 | 257278 | 1715.73 | 642 | 646 | 149.6 |
| C | 0 | 10 | 116730 | 776.09 | 642 | 646 | 149.6 |
| C | 14 | 254 | 12203 | 77.26 | 642 | 646 | 149.6 |
| D | 2 | 16 | 1061870 | 6807.95 | 639 | 621 | 155.9 |
| D | 2 | 249 | 232431 | 1487.07 | 639 | 621 | 155.9 |
| D | 13 | 249 | 196296 | 1255.26 | 639 | 621 | 155.9 |
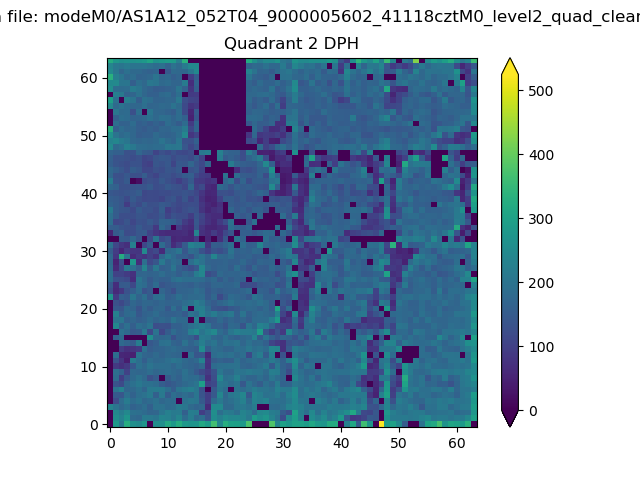
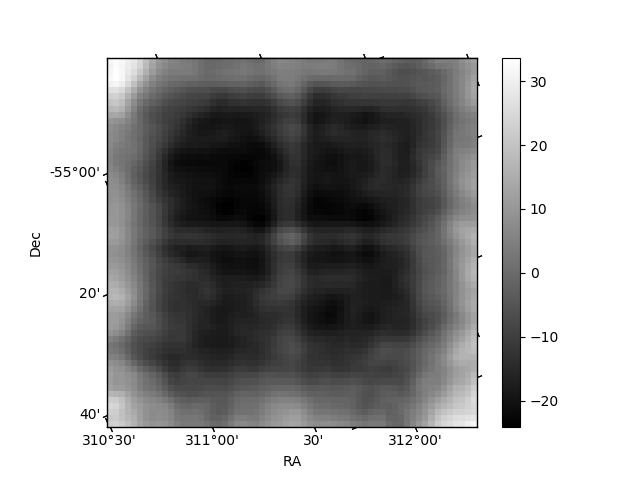
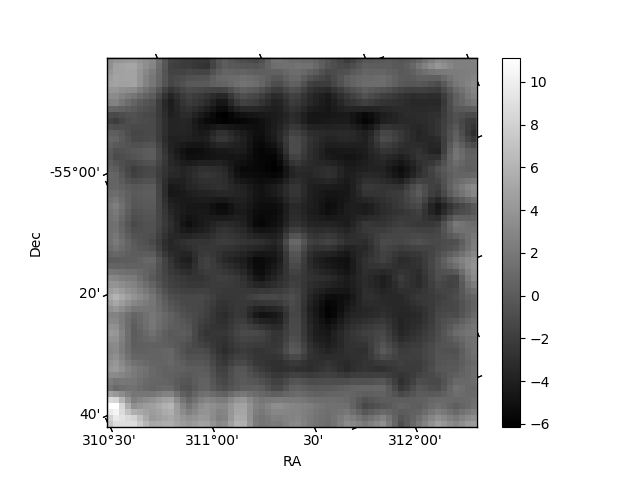
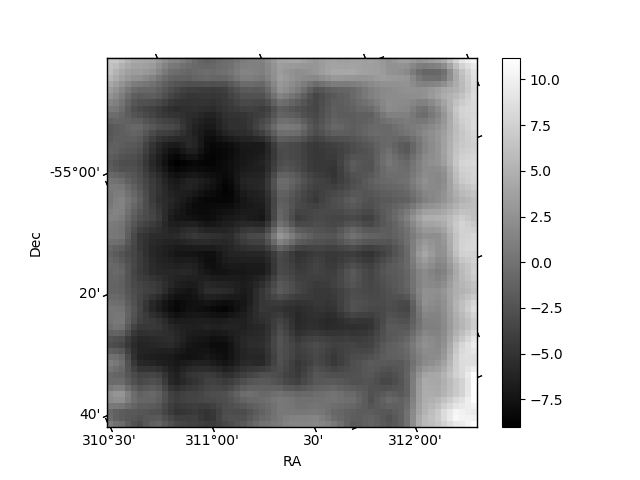
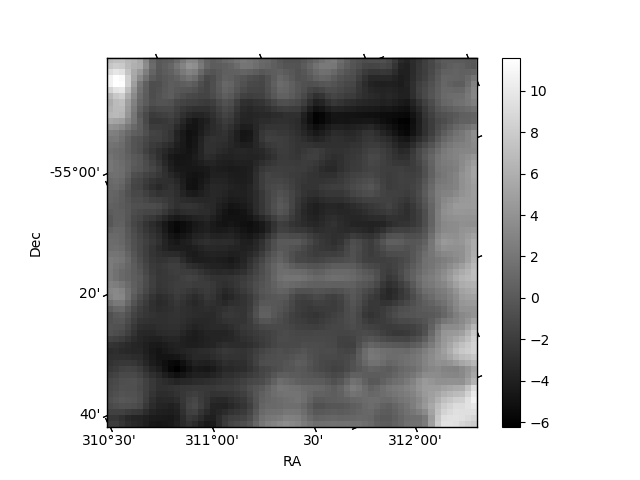
Histogram calculated using DETX and DETY for each event in the final _common_clean file
| Quadrant A | 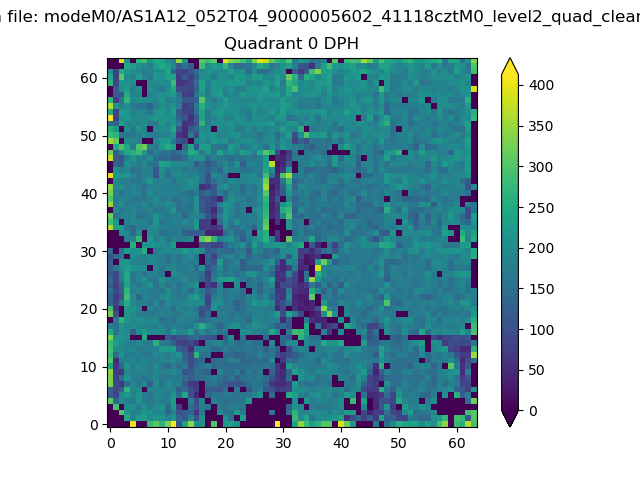 |
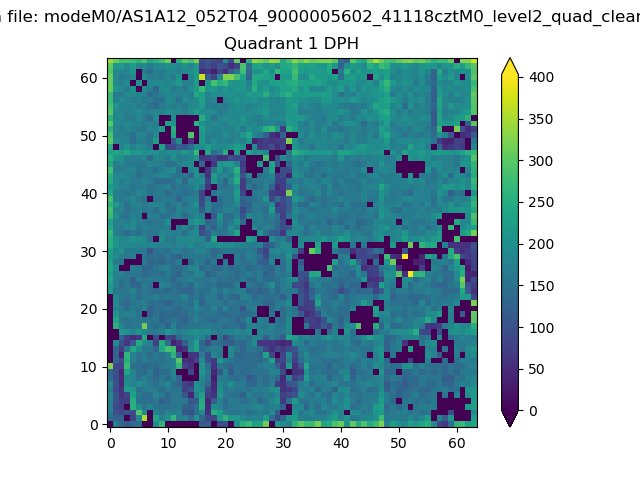 |
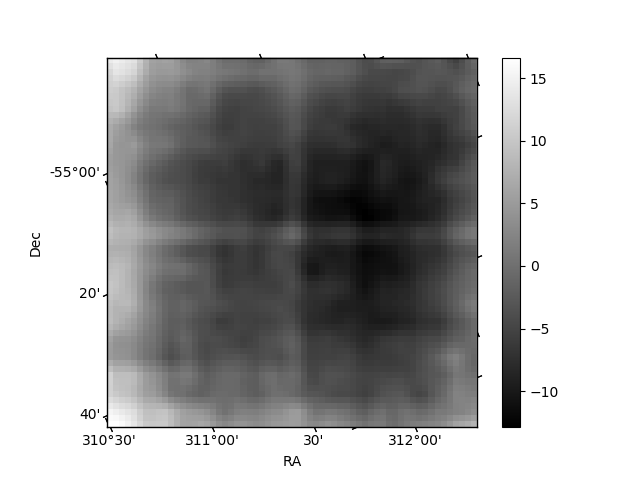
Quadrant B |
|---|---|---|---|
| Quadrant D | 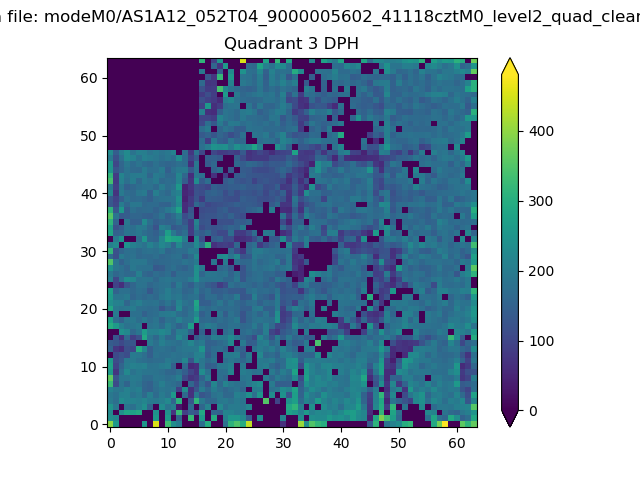 |
 |
Quadrant C |
| Plot type | Count rate plots | Images |
|---|---|---|
| Comparison with Poisson distribution Blue bars denote a histogram of data divided into 1 sec bins. Red curve is a Poisson curve with rate = median count rate of data. |
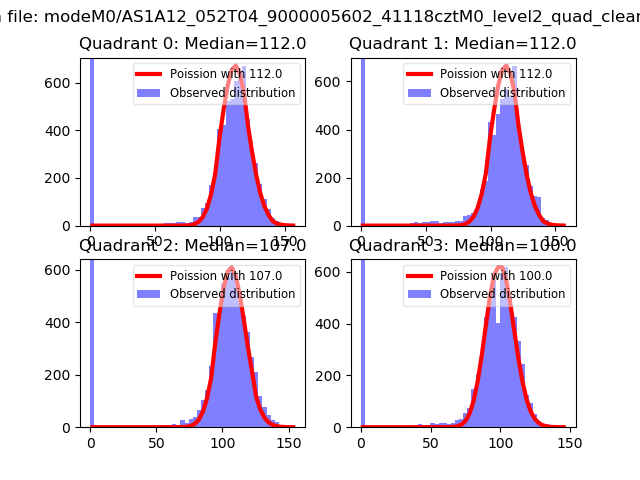 |
 |
| Quadrant-wise count rates Data is divided into 100 sec bins |
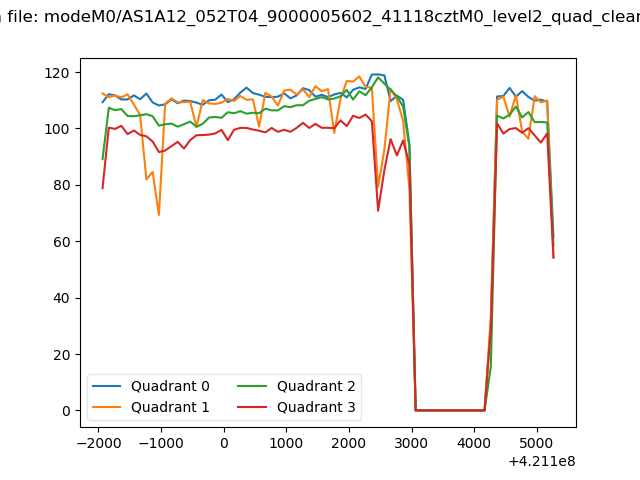 |
|
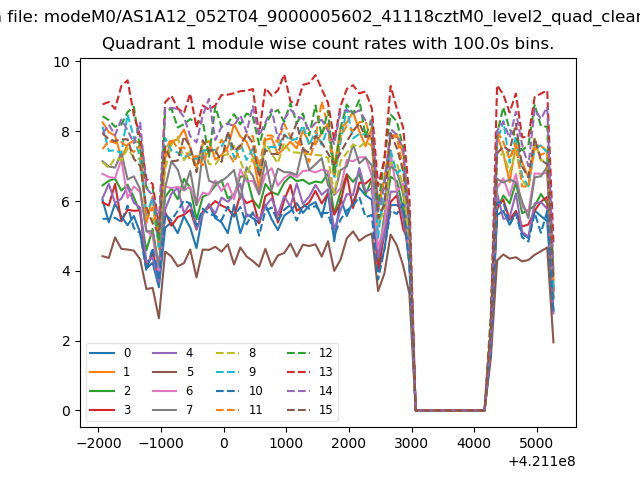
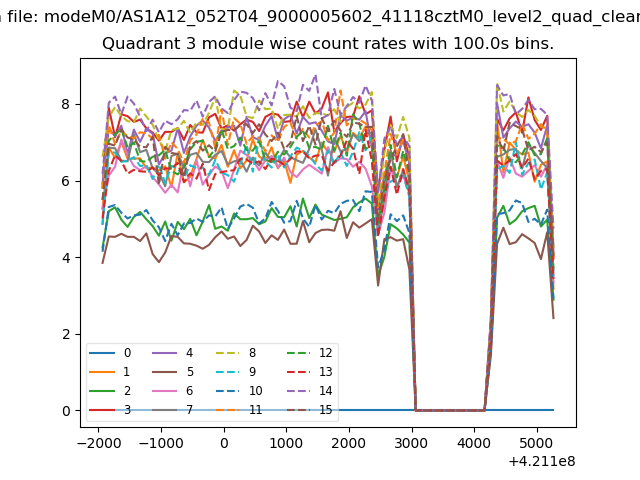
| Module-wise count rates for Quadrant A Data is divided into 100 sec bins |
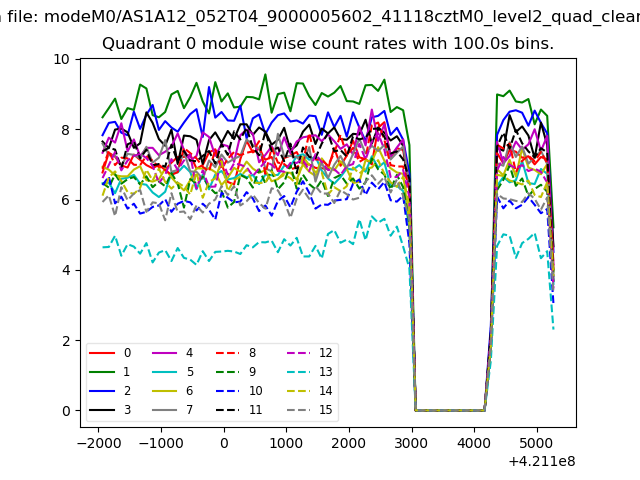 |
 |
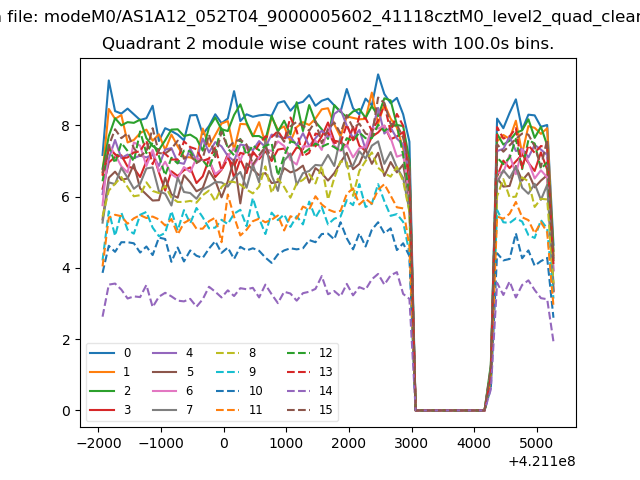
| Module-wise count rates for Quadrant B Data is divided into 100 sec bins |
 |
 |
| Module-wise count rates for Quadrant C Data is divided into 100 sec bins |
 |
 |
| Module-wise count rates for Quadrant D Data is divided into 100 sec bins |
 |
 |
| Parameter | Plot |
|---|---|
| CZT HV Monitor | 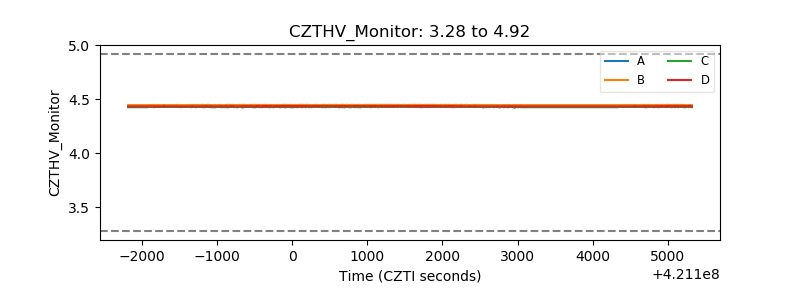 |
| D_VDD | 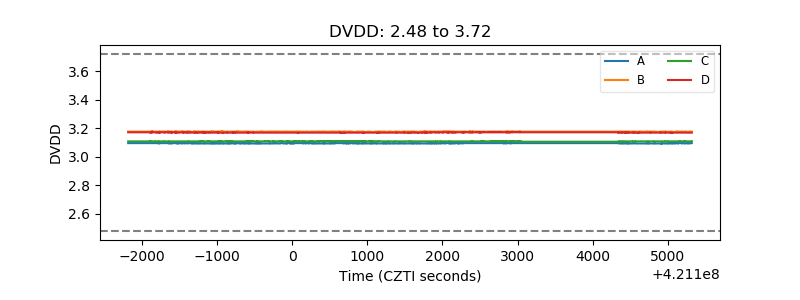 |
| Temperature 1 | 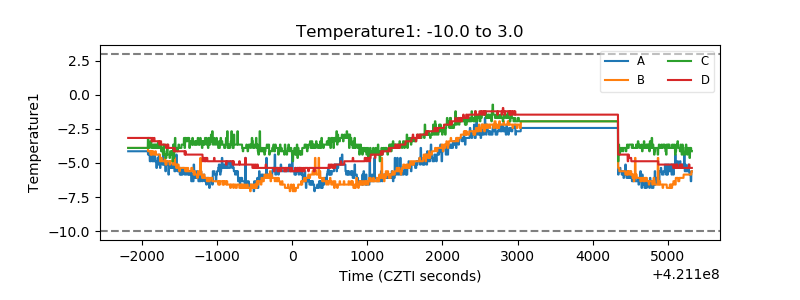 |
| Veto HV Monitor | 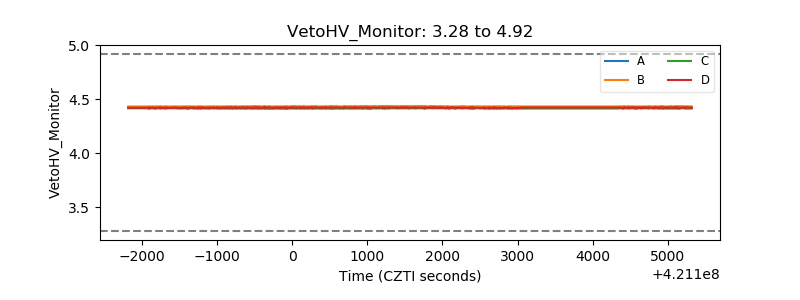 |
| Veto LLD | 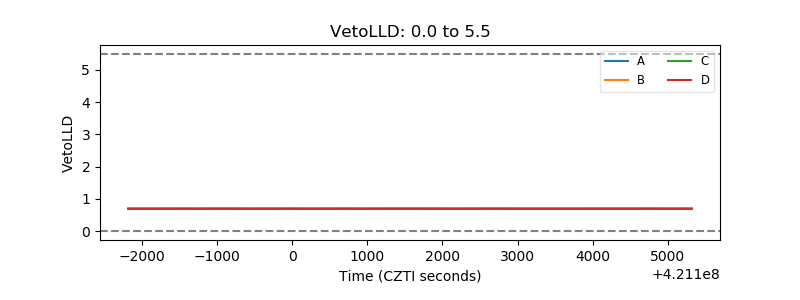 |
| Alpha Counter | 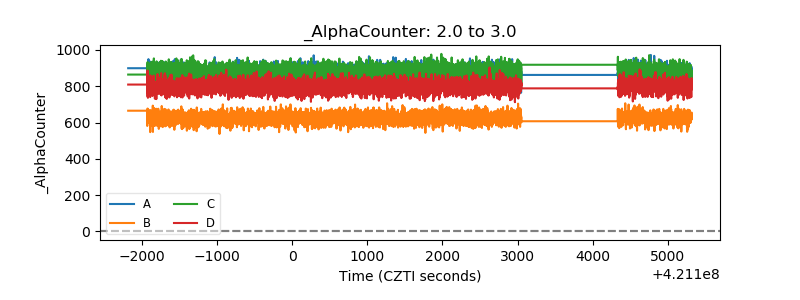 |
| _CPM_Rate | 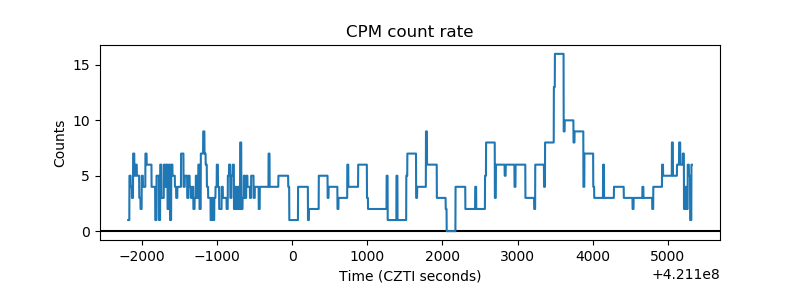 |
| CZT Counter | 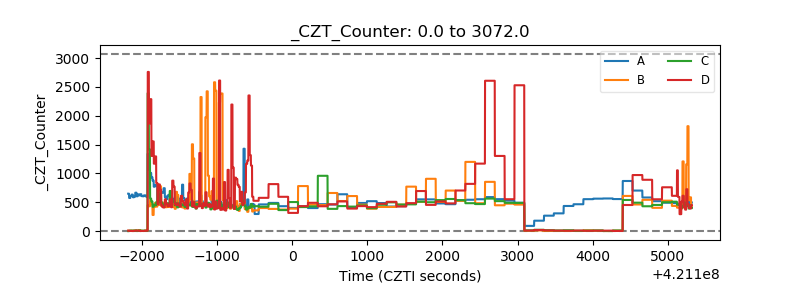 |
| +2.5 Volts monitor | 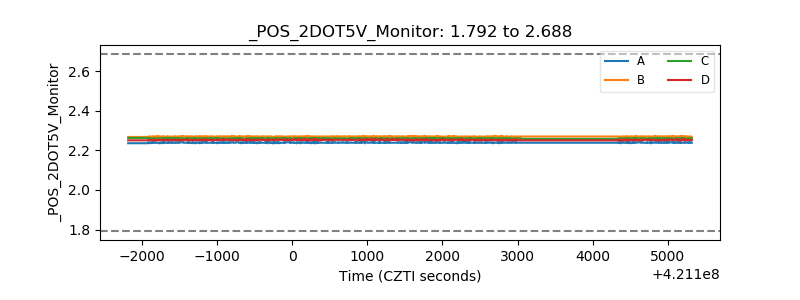 |
| +5 Volts monitor | 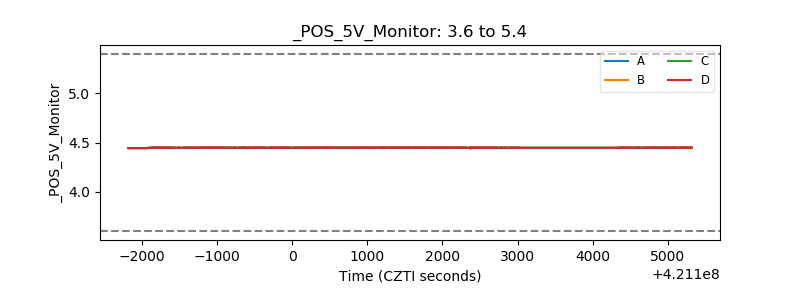 |
| _ROLL_ROT | 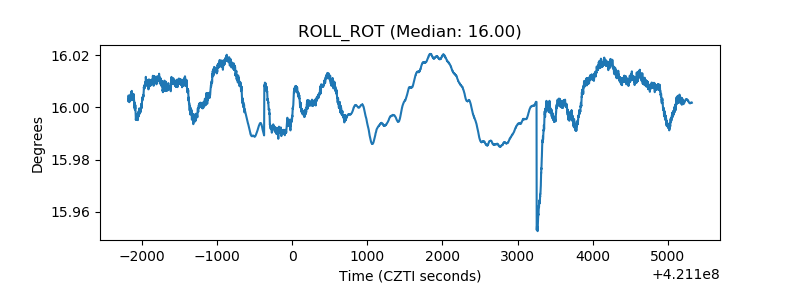 |
| _Roll_DEC | 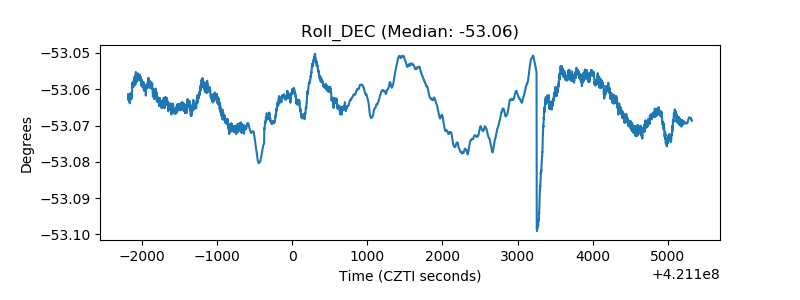 |
| _Roll_RA | 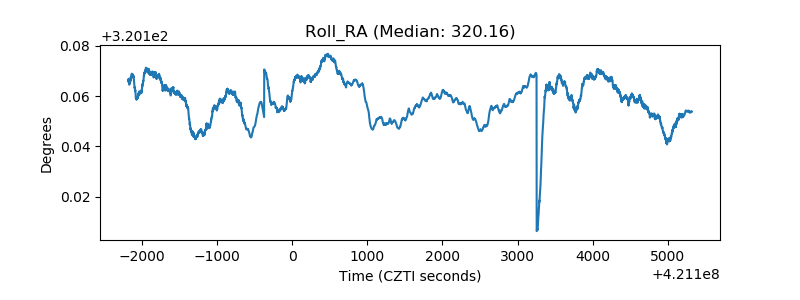 |
| Veto Counter | 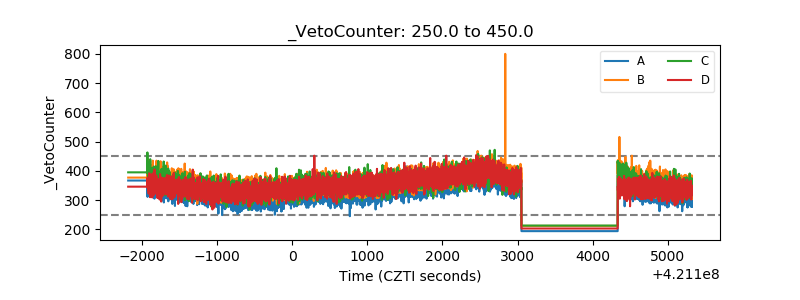 |