| Param | Original file | Final file |
|---|---|---|
| Filename | modeM0/AS1A12_052T04_9000005602_41121cztM0_level2.fits | modeM0/AS1A12_052T04_9000005602_41121cztM0_level2_quad_clean.evt |
| Size (bytes) | 421,637,760 | 107,481,600 |
| Size | 402.1 MB | 102.5 MB |
| Events in quadrant A | 3,484,645 | 728,166 |
| Events in quadrant B | 4,897,345 | 710,680 |
| Events in quadrant C | 3,244,281 | 702,340 |
| Events in quadrant D | 3,466,523 | 651,535 |
| Mode M0 | |||
|---|---|---|---|
| Quadrant | BADHDUFLAG | Total packets | Discarded packets |
| A | 0 | 14447 | 3 |
| B | 0 | 19137 | 2 |
| C | 0 | 13768 | 2 |
| D | 0 | 15155 | 2 |
| Mode M9 | |||
|---|---|---|---|
| Quadrant | BADHDUFLAG | Total packets | Discarded packets |
| A | 0 | 17 | 0 |
| B | 0 | 17 | 0 |
| C | 0 | 17 | 0 |
| D | 0 | 18 | 0 |
| Mode SS | |||
|---|---|---|---|
| Quadrant | BADHDUFLAG | Total packets | Discarded packets |
| A | 0 | 134 | 0 |
| B | 0 | 134 | 0 |
| C | 0 | 134 | 0 |
| D | 0 | 134 | 0 |
| Quadrant | Total seconds | Saturated seconds | Saturation percentage |
|---|---|---|---|
| A | 6622 | 12 | 0.181214% |
| B | 6622 | 369 | 5.572335% |
| C | 6622 | 36 | 0.543642% |
| D | 6622 | 60 | 0.906071% |
Noise dominated data is calculated using 1-second bins in cleaned event files. If a bin has >2000 counts, and if more than 50% of those come from <1% of pixels, then it is considered to be noise-dominated and hence unusable.
| Quadrant | # 1 sec bins | Bins with >0 counts | Bins with >2000 counts | High rate bins dominated by noise | Noise dominated (total time) | Noise dominated (detector-on time) | Marked lightcurve |
|---|---|---|---|---|---|---|---|
| A | 7964 | 6623 | 2 | 2 | 0.03% | 0.03% | 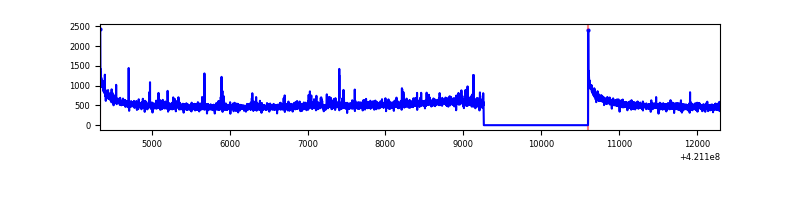 |
| B | 7964 | 6623 | 230 | 230 | 2.89% | 3.47% | 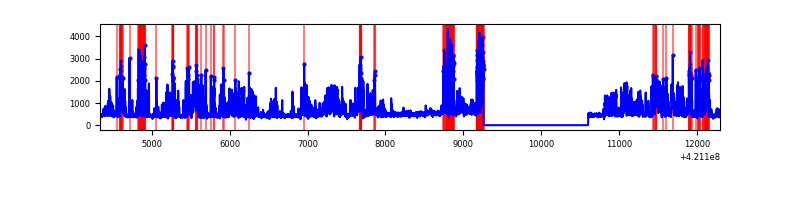 |
| C | 7964 | 6623 | 31 | 31 | 0.39% | 0.47% | 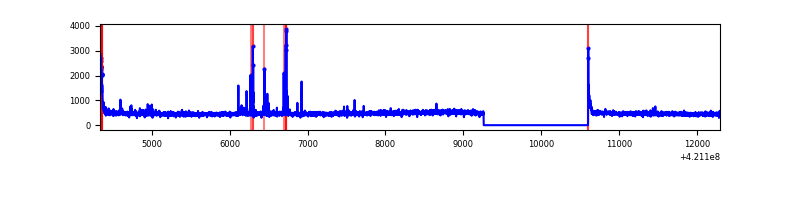 |
| D | 7964 | 6623 | 61 | 61 | 0.77% | 0.92% | 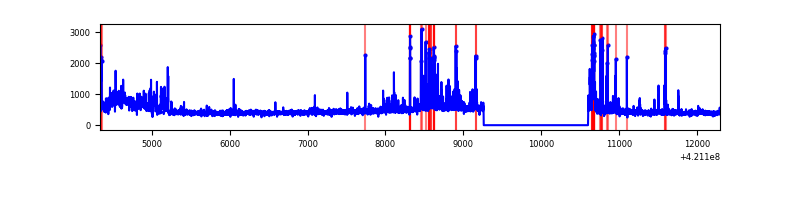 |
Top three noisy pixels from each quadrant. If the there are fewer than three noisy pixels in the level2.evt file, extra rows are filled as -1
| Pixel properties | Quadrant properties | ||||||
|---|---|---|---|---|---|---|---|
| Quadrant | DetID | PixID | Counts | Sigma | Mean | Median | Sigma |
| A | 10 | 83 | 583829 | 3909.49 | 725 | 709 | 149.2 |
| A | 2 | 79 | 83950 | 558.08 | 725 | 709 | 149.2 |
| A | 13 | 254 | 11367 | 71.46 | 725 | 709 | 149.2 |
| B | 0 | 245 | 2004732 | 14483.29 | 709 | 688 | 138.4 |
| B | 0 | 186 | 64449 | 460.8 | 709 | 688 | 138.4 |
| B | 15 | 32 | 28693 | 202.39 | 709 | 688 | 138.4 |
| C | 15 | 214 | 285844 | 1711.74 | 715 | 716 | 166.6 |
| C | 0 | 10 | 89698 | 534.19 | 715 | 716 | 166.6 |
| C | 14 | 254 | 69264 | 411.52 | 715 | 716 | 166.6 |
| D | 2 | 16 | 323370 | 1847.53 | 711 | 690 | 174.7 |
| D | 13 | 249 | 164121 | 935.74 | 711 | 690 | 174.7 |
| D | 2 | 249 | 156274 | 890.81 | 711 | 690 | 174.7 |
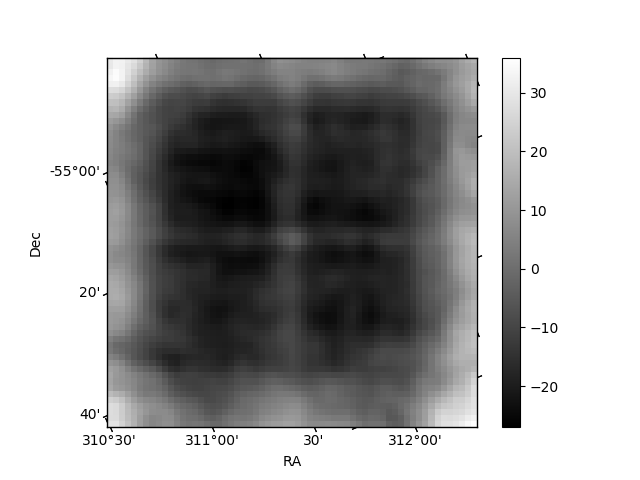
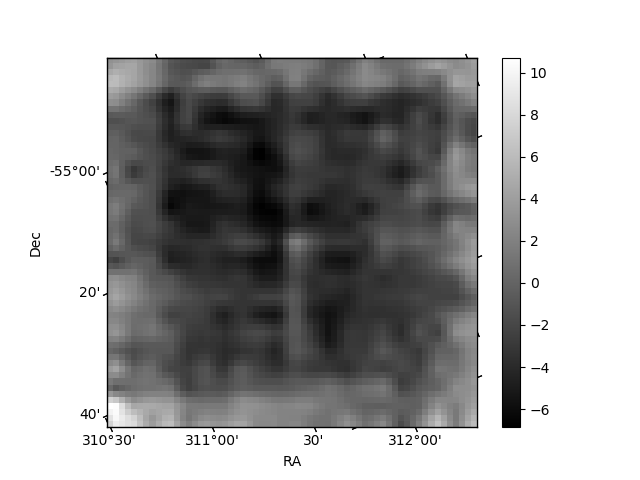
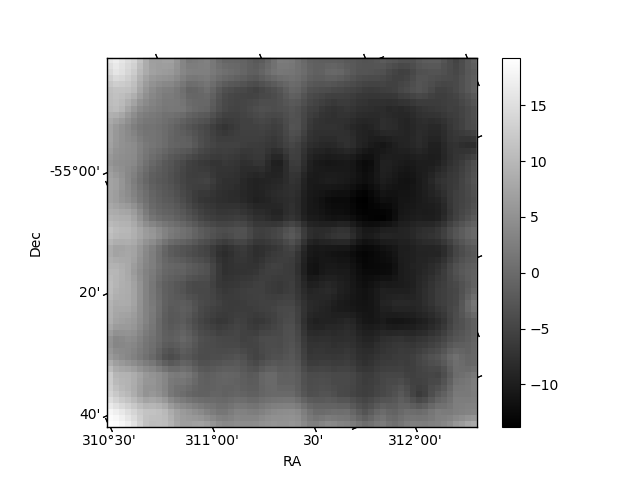
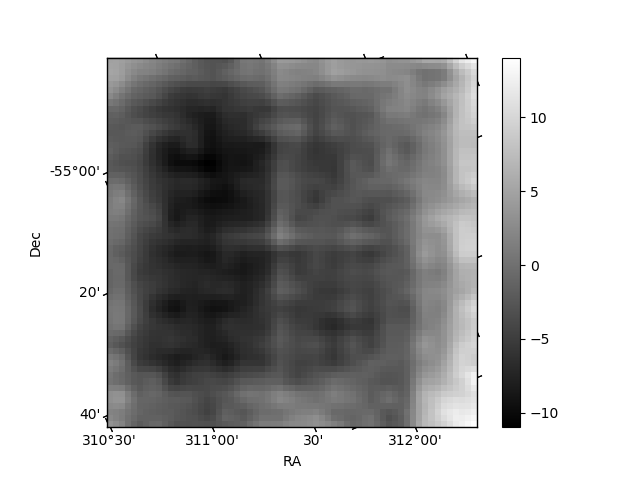
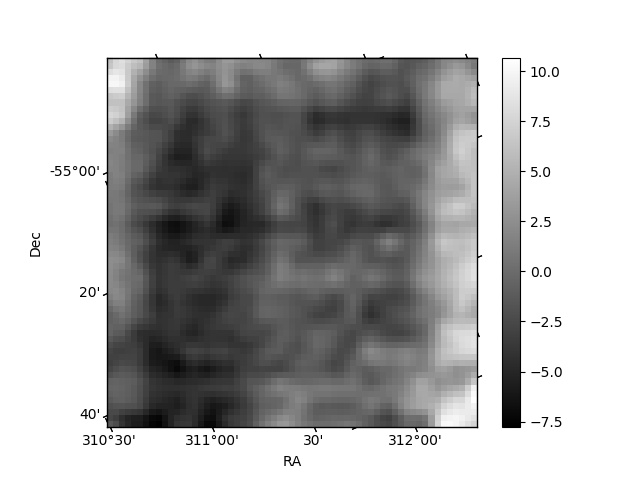
Histogram calculated using DETX and DETY for each event in the final _common_clean file
| Quadrant A | 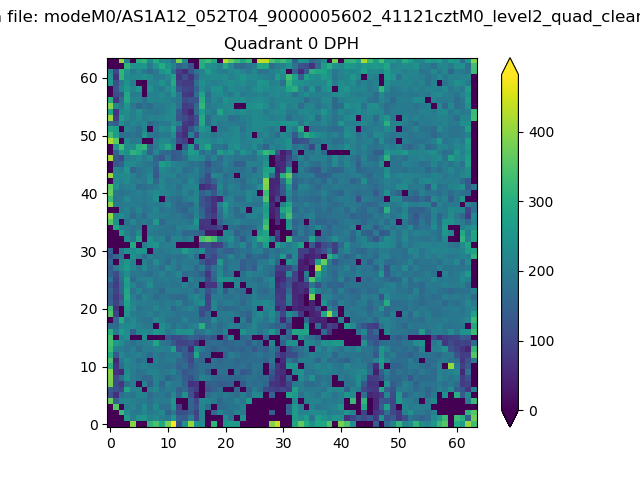 |
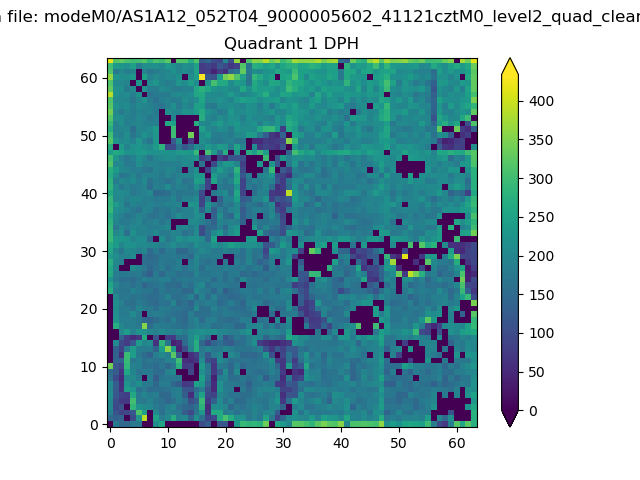 |
Quadrant B |
|---|---|---|---|
| Quadrant D | 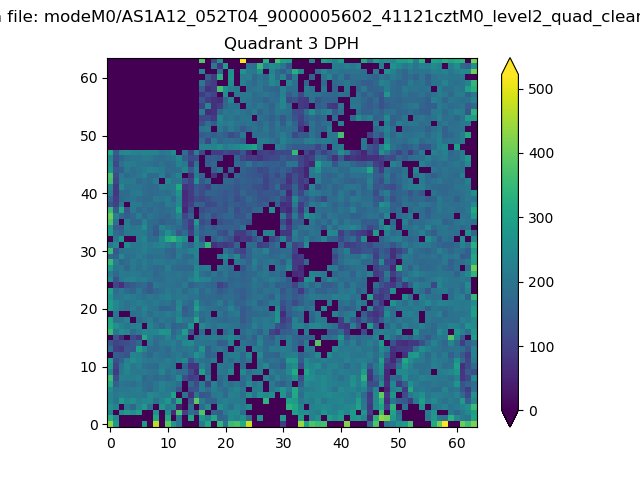 |
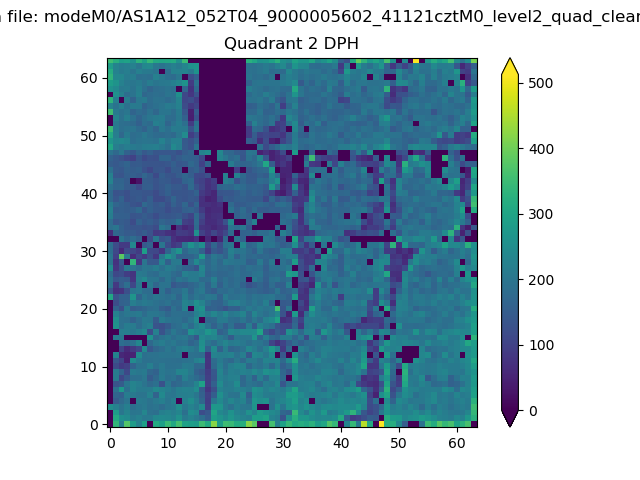 |
Quadrant C |
| Plot type | Count rate plots | Images |
|---|---|---|
| Comparison with Poisson distribution Blue bars denote a histogram of data divided into 1 sec bins. Red curve is a Poisson curve with rate = median count rate of data. |
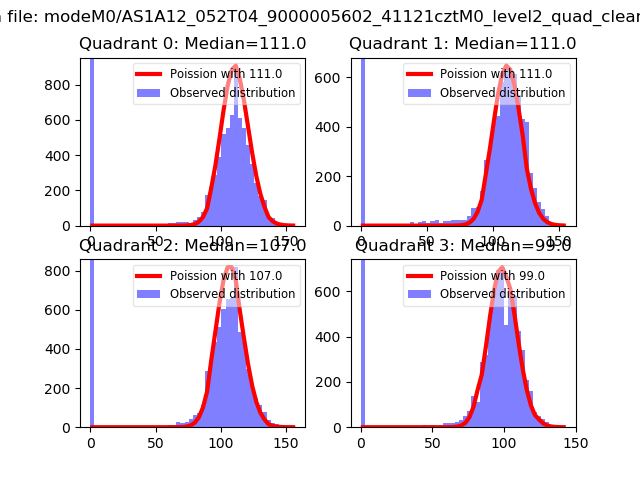 |
 |
| Quadrant-wise count rates Data is divided into 100 sec bins |
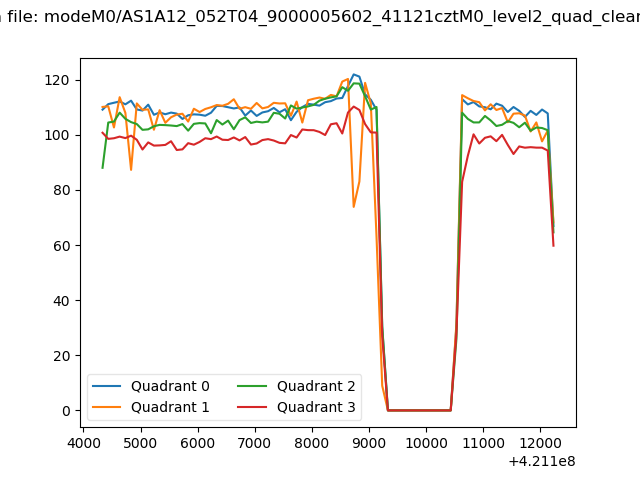 |
|
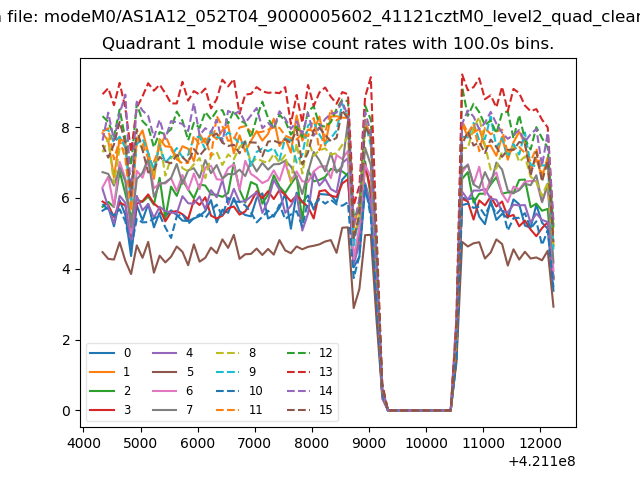
| Module-wise count rates for Quadrant A Data is divided into 100 sec bins |
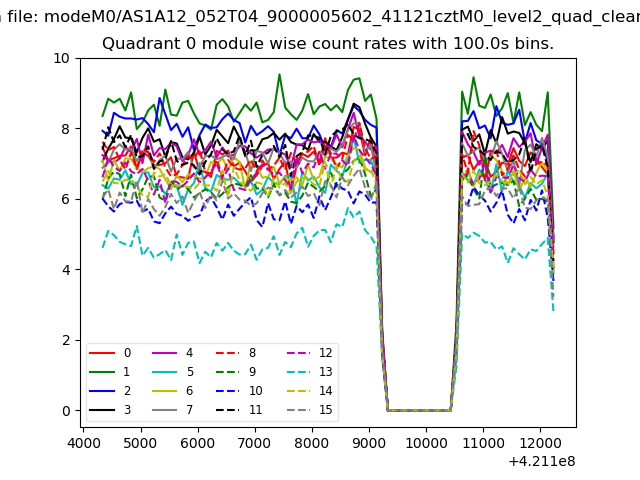 |
 |
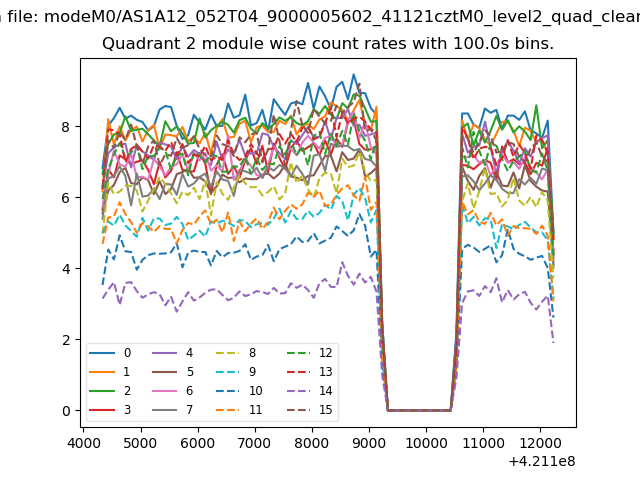
| Module-wise count rates for Quadrant B Data is divided into 100 sec bins |
 |
 |
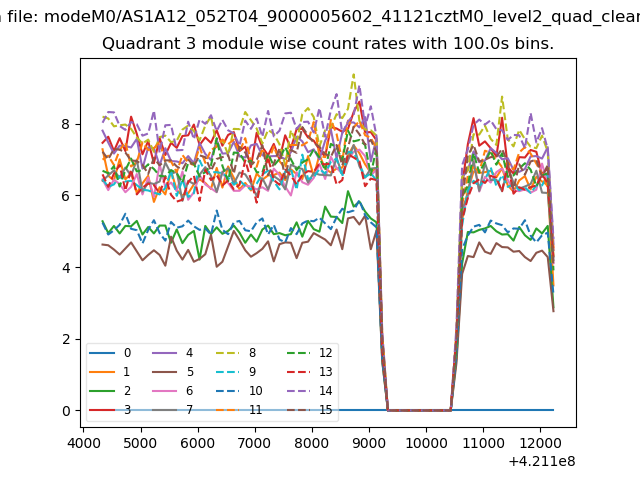
| Module-wise count rates for Quadrant C Data is divided into 100 sec bins |
 |
 |
| Module-wise count rates for Quadrant D Data is divided into 100 sec bins |
 |
 |
| Parameter | Plot |
|---|---|
| CZT HV Monitor | 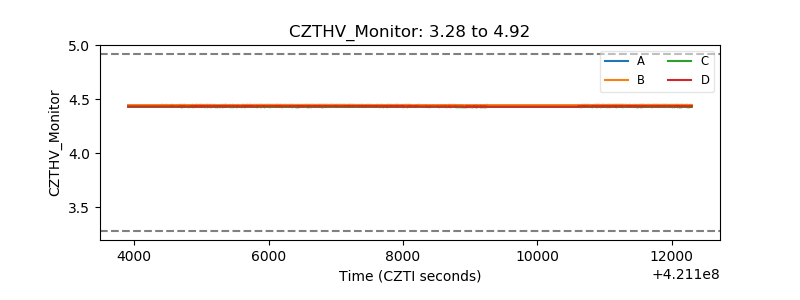 |
| D_VDD | 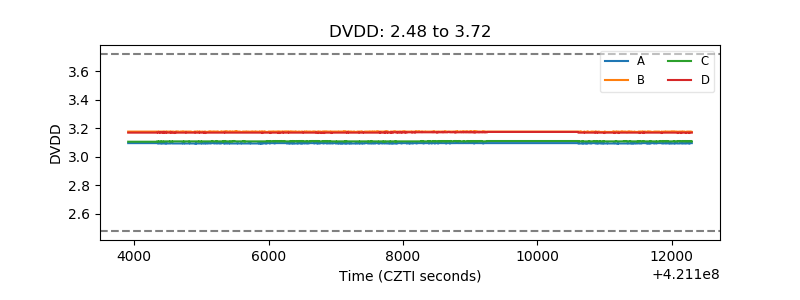 |
| Temperature 1 | 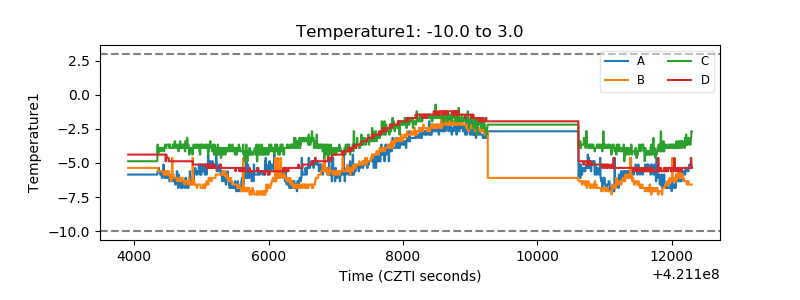 |
| Veto HV Monitor | 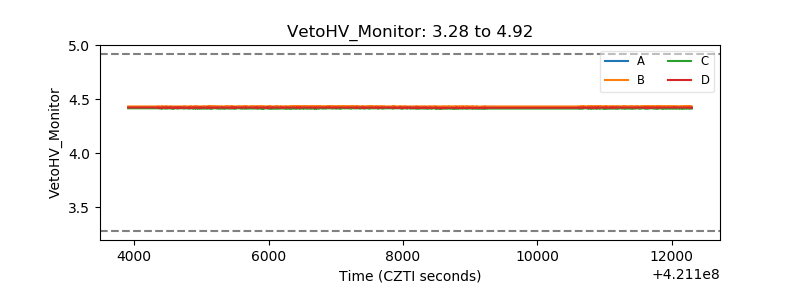 |
| Veto LLD | 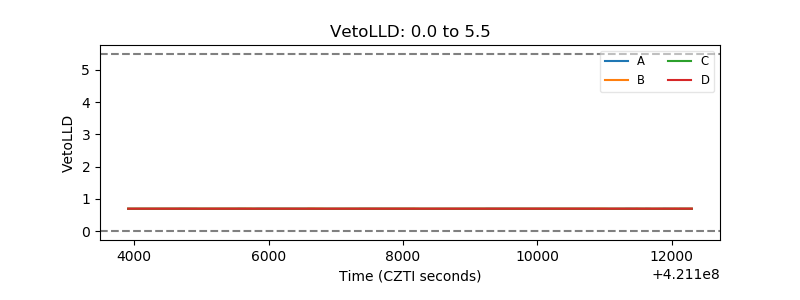 |
| Alpha Counter | 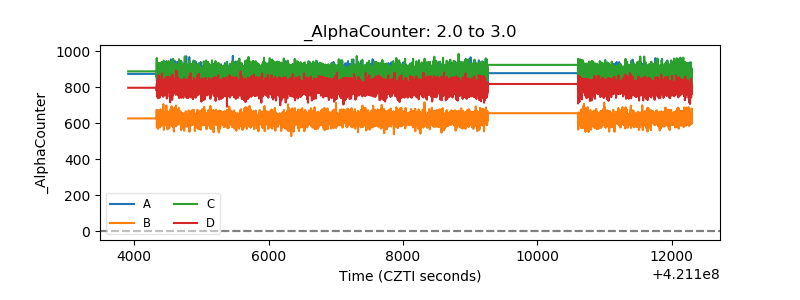 |
| _CPM_Rate | 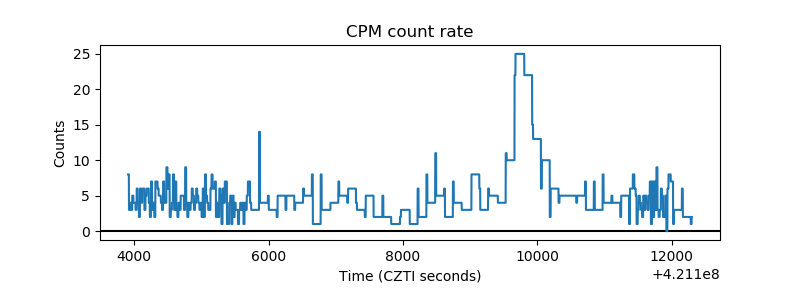 |
| CZT Counter | 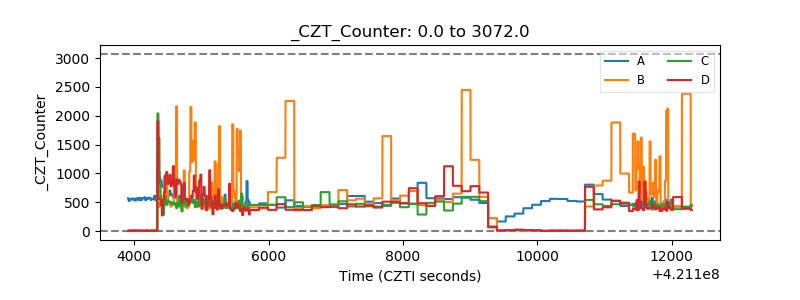 |
| +2.5 Volts monitor | 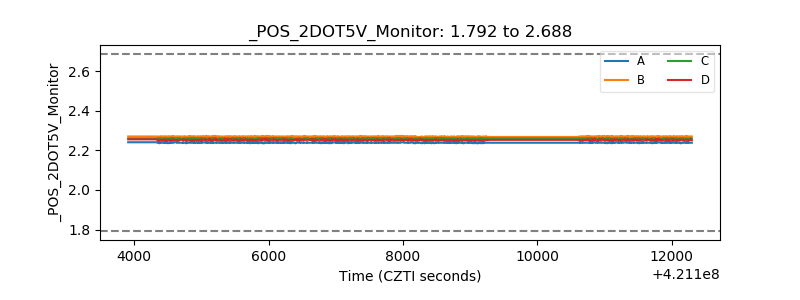 |
| +5 Volts monitor |  |
| _ROLL_ROT | 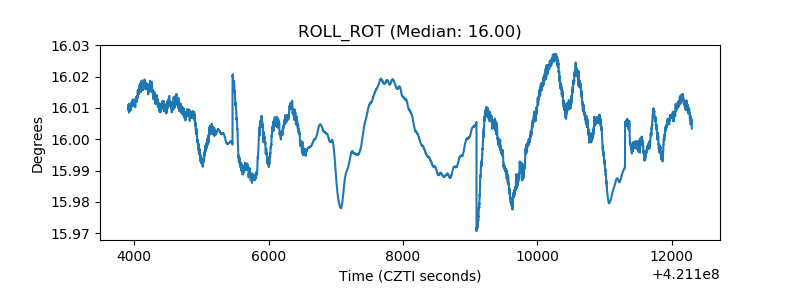 |
| _Roll_DEC | 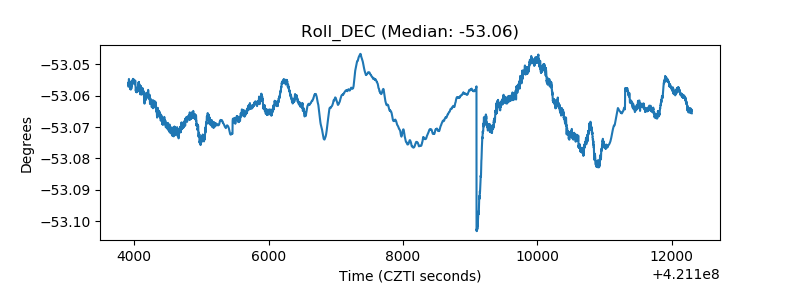 |
| _Roll_RA | 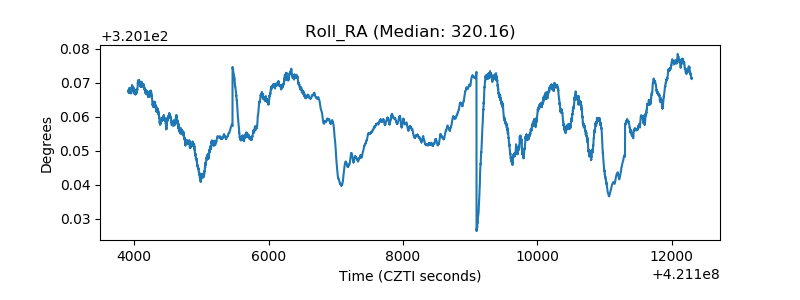 |
| Veto Counter | 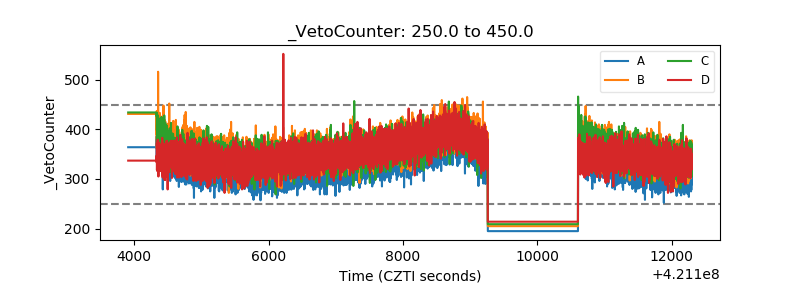 |