| Param | Original file | Final file |
|---|---|---|
| Filename | modeM0/AS1A12_052T04_9000005602_41122cztM0_level2.fits | modeM0/AS1A12_052T04_9000005602_41122cztM0_level2_quad_clean.evt |
| Size (bytes) | 333,034,560 | 92,070,720 |
| Size | 317.6 MB | 87.8 MB |
| Events in quadrant A | 2,878,623 | 621,239 |
| Events in quadrant B | 3,524,800 | 605,184 |
| Events in quadrant C | 2,793,609 | 604,061 |
| Events in quadrant D | 2,687,717 | 559,860 |
| Mode M0 | |||
|---|---|---|---|
| Quadrant | BADHDUFLAG | Total packets | Discarded packets |
| A | 0 | 12012 | 2 |
| B | 0 | 14506 | 1 |
| C | 0 | 11837 | 1 |
| D | 0 | 12217 | 1 |
| Mode M9 | |||
|---|---|---|---|
| Quadrant | BADHDUFLAG | Total packets | Discarded packets |
| A | 0 | 14 | 0 |
| B | 0 | 14 | 0 |
| C | 0 | 14 | 0 |
| D | 0 | 14 | 0 |
| Mode SS | |||
|---|---|---|---|
| Quadrant | BADHDUFLAG | Total packets | Discarded packets |
| A | 0 | 116 | 0 |
| B | 0 | 116 | 0 |
| C | 0 | 116 | 0 |
| D | 0 | 116 | 0 |
| Quadrant | Total seconds | Saturated seconds | Saturation percentage |
|---|---|---|---|
| A | 5683 | 10 | 0.175963% |
| B | 5683 | 326 | 5.736407% |
| C | 5683 | 18 | 0.316734% |
| D | 5683 | 62 | 1.090973% |
Noise dominated data is calculated using 1-second bins in cleaned event files. If a bin has >2000 counts, and if more than 50% of those come from <1% of pixels, then it is considered to be noise-dominated and hence unusable.
| Quadrant | # 1 sec bins | Bins with >0 counts | Bins with >2000 counts | High rate bins dominated by noise | Noise dominated (total time) | Noise dominated (detector-on time) | Marked lightcurve |
|---|---|---|---|---|---|---|---|
| A | 7115 | 5684 | 1 | 1 | 0.01% | 0.02% | 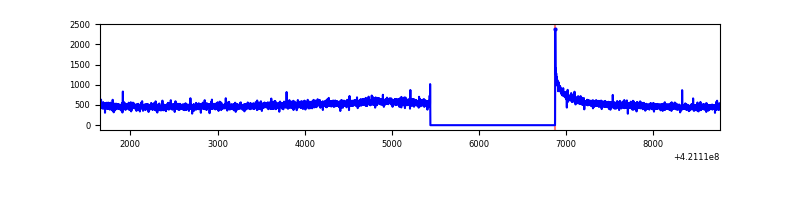 |
| B | 7115 | 5683 | 229 | 229 | 3.22% | 4.03% | 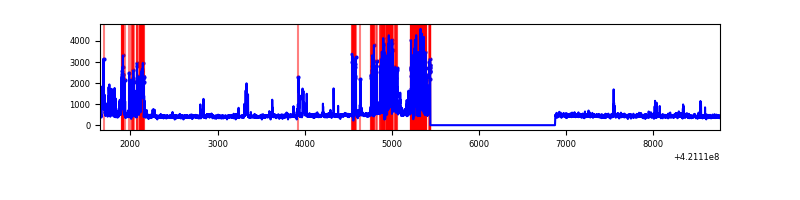 |
| C | 7115 | 5684 | 11 | 11 | 0.15% | 0.19% | 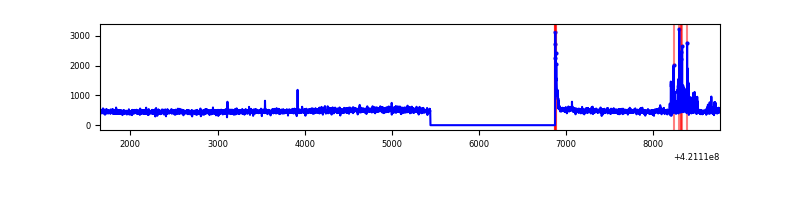 |
| D | 7115 | 5684 | 42 | 42 | 0.59% | 0.74% | 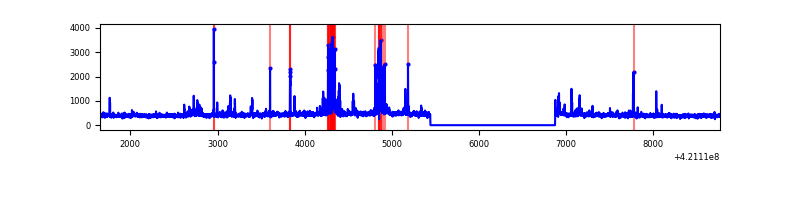 |
Top three noisy pixels from each quadrant. If the there are fewer than three noisy pixels in the level2.evt file, extra rows are filled as -1
| Pixel properties | Quadrant properties | ||||||
|---|---|---|---|---|---|---|---|
| Quadrant | DetID | PixID | Counts | Sigma | Mean | Median | Sigma |
| A | 10 | 83 | 445856 | 3474.62 | 625 | 611 | 128.1 |
| A | 13 | 254 | 9128 | 66.47 | 625 | 611 | 128.1 |
| A | 2 | 79 | 7608 | 54.6 | 625 | 611 | 128.1 |
| B | 0 | 245 | 1028063 | 8688.0 | 602 | 584 | 118.3 |
| B | 0 | 186 | 64280 | 538.59 | 602 | 584 | 118.3 |
| B | 0 | 190 | 47990 | 400.85 | 602 | 584 | 118.3 |
| C | 15 | 214 | 239927 | 1669.22 | 612 | 617 | 143.4 |
| C | 14 | 254 | 116085 | 805.41 | 612 | 617 | 143.4 |
| C | 0 | 10 | 39780 | 273.17 | 612 | 617 | 143.4 |
| D | 2 | 249 | 144486 | 958.46 | 613 | 596 | 150.1 |
| D | 13 | 249 | 110791 | 734.02 | 613 | 596 | 150.1 |
| D | 5 | 32 | 30241 | 197.47 | 613 | 596 | 150.1 |
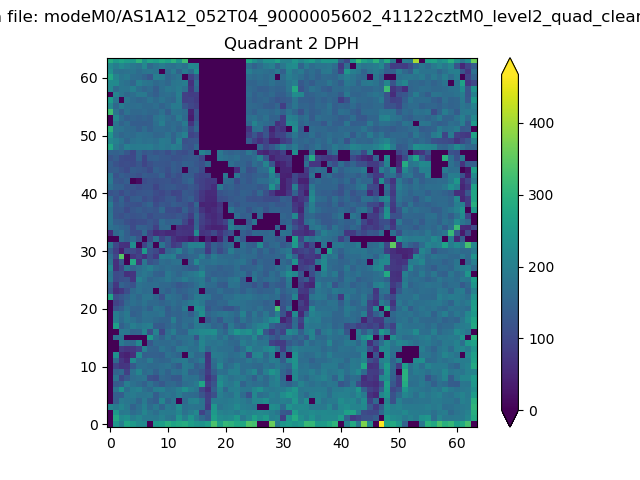
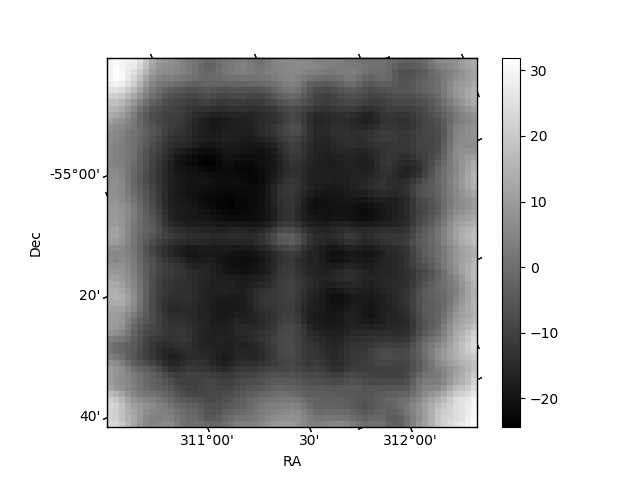
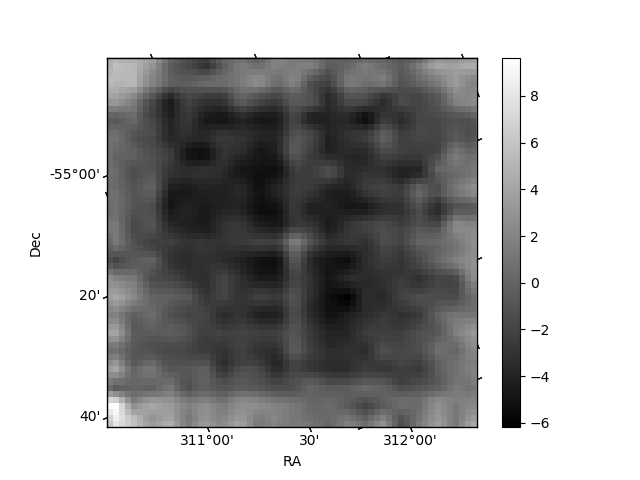
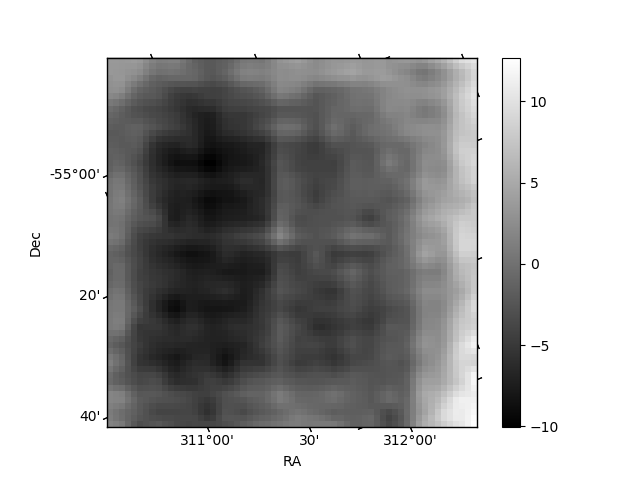
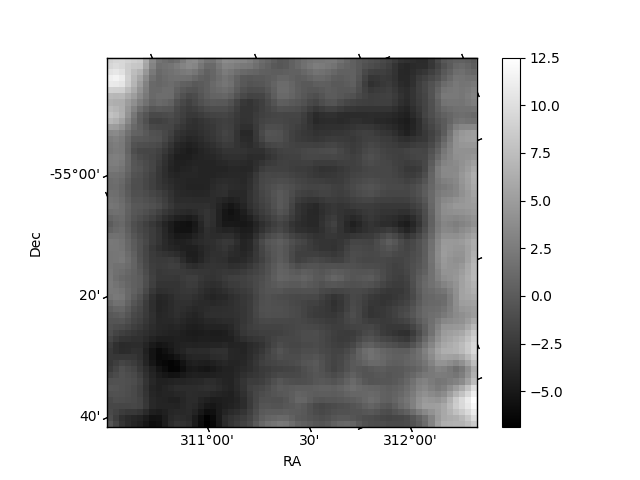
Histogram calculated using DETX and DETY for each event in the final _common_clean file
| Quadrant A | 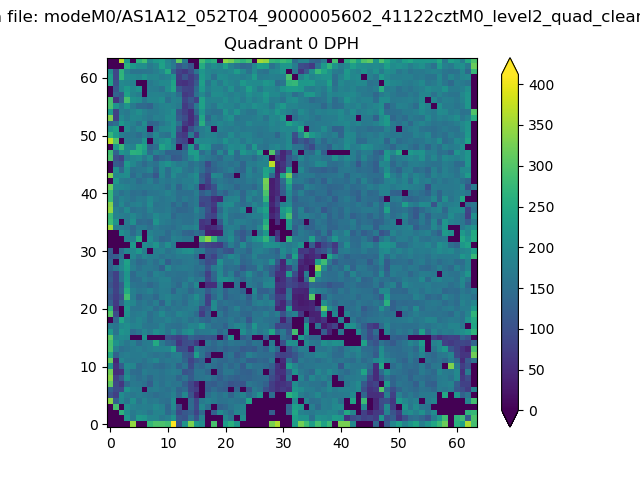 |
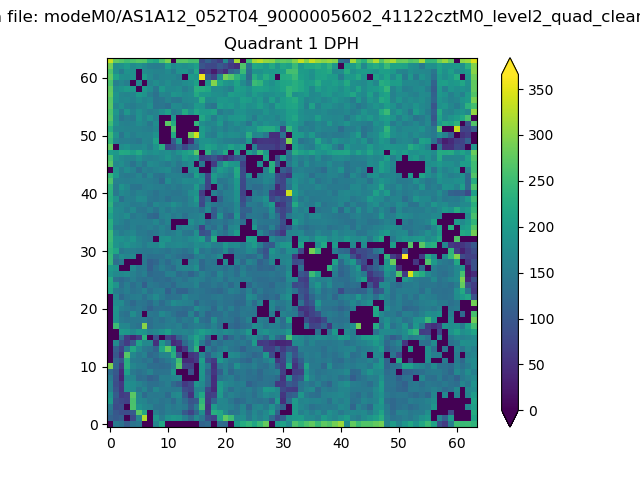 |
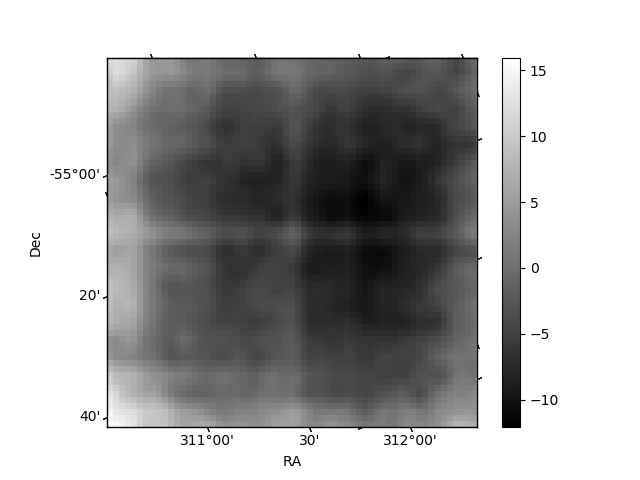
Quadrant B |
|---|---|---|---|
| Quadrant D | 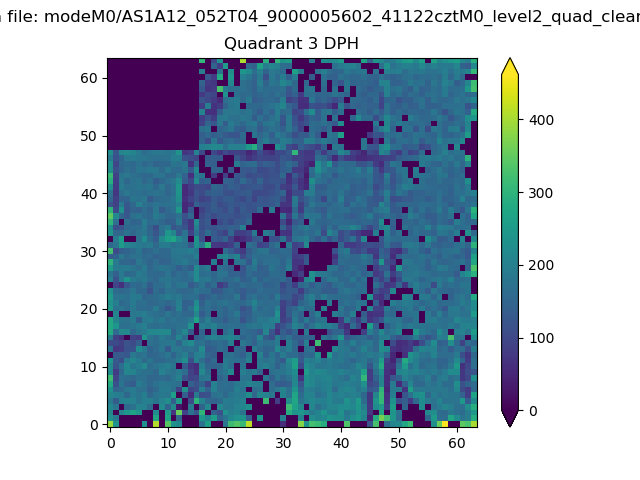 |
 |
Quadrant C |
| Plot type | Count rate plots | Images |
|---|---|---|
| Comparison with Poisson distribution Blue bars denote a histogram of data divided into 1 sec bins. Red curve is a Poisson curve with rate = median count rate of data. |
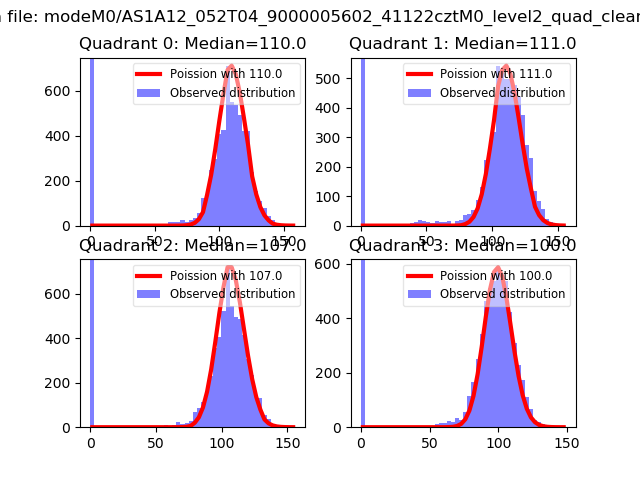 |
 |
| Quadrant-wise count rates Data is divided into 100 sec bins |
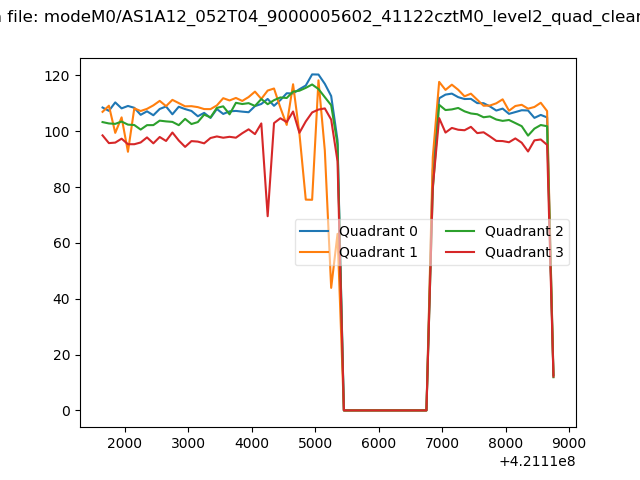 |
|
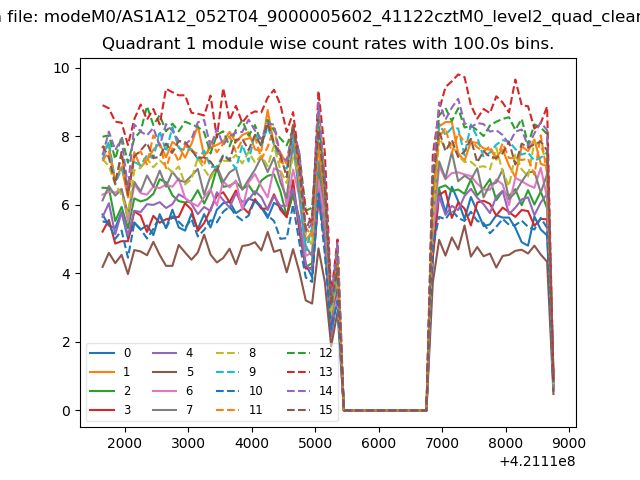
| Module-wise count rates for Quadrant A Data is divided into 100 sec bins |
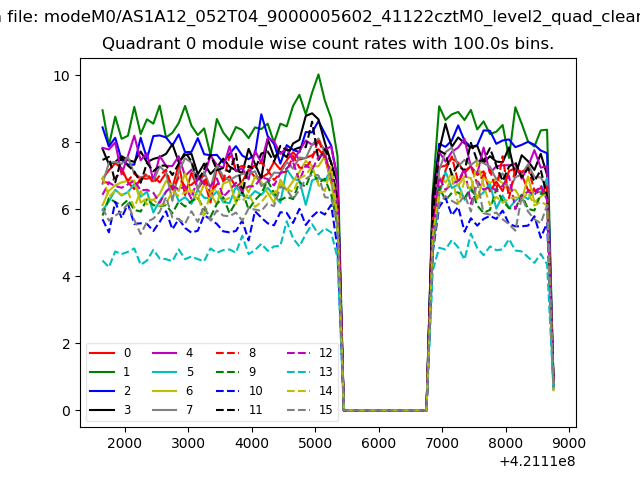 |
 |
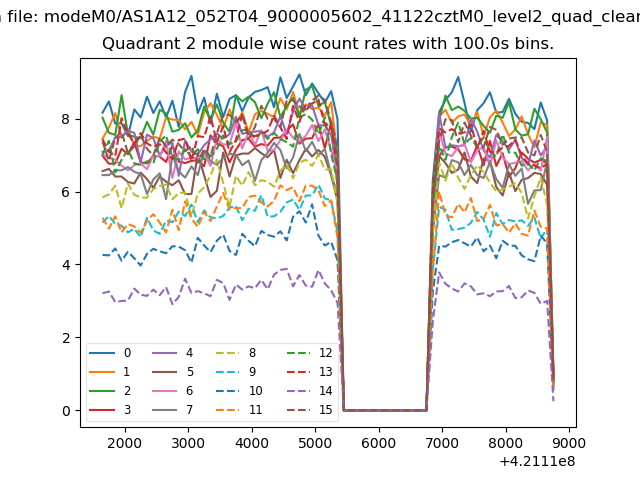
| Module-wise count rates for Quadrant B Data is divided into 100 sec bins |
 |
 |
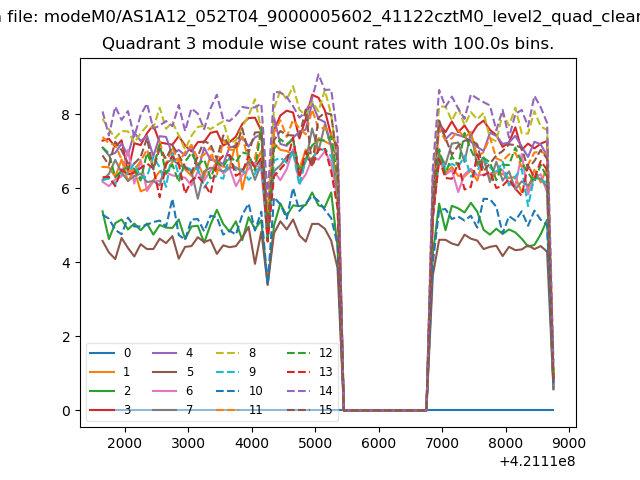
| Module-wise count rates for Quadrant C Data is divided into 100 sec bins |
 |
 |
| Module-wise count rates for Quadrant D Data is divided into 100 sec bins |
 |
 |
| Parameter | Plot |
|---|---|
| CZT HV Monitor | 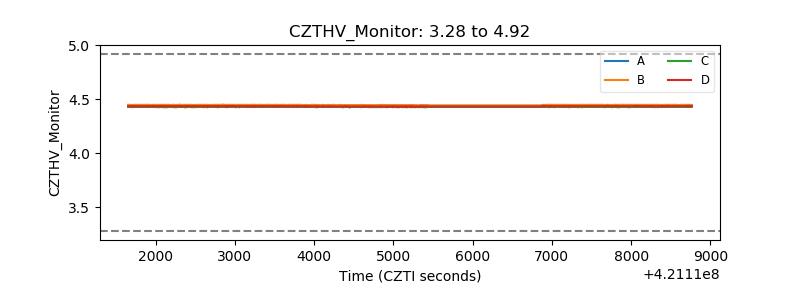 |
| D_VDD | 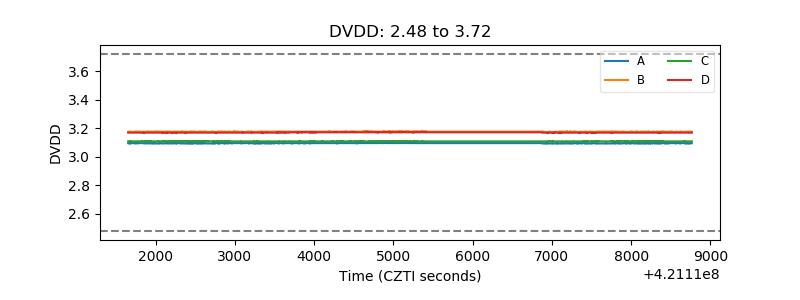 |
| Temperature 1 | 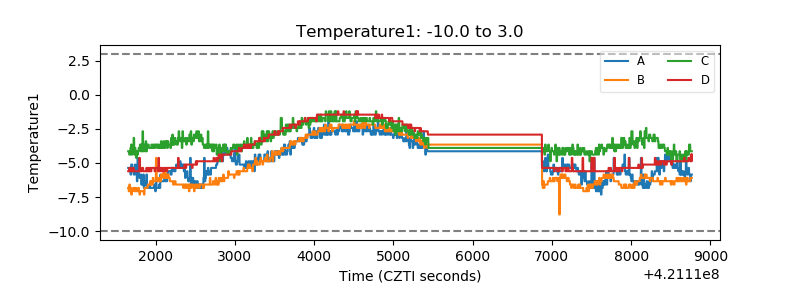 |
| Veto HV Monitor | 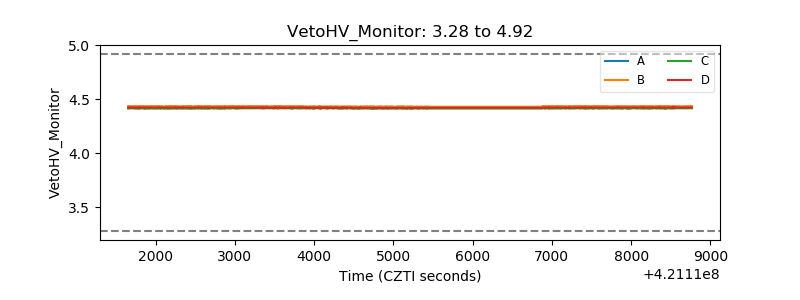 |
| Veto LLD | 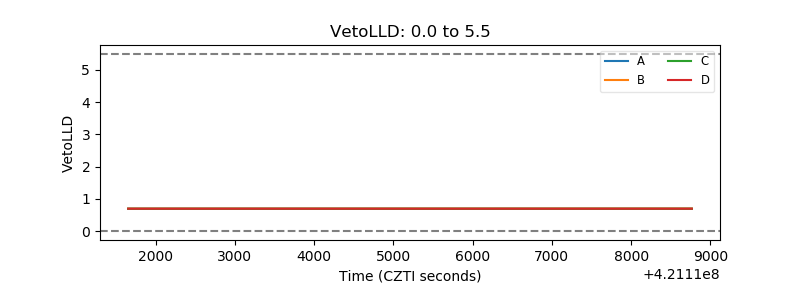 |
| Alpha Counter | 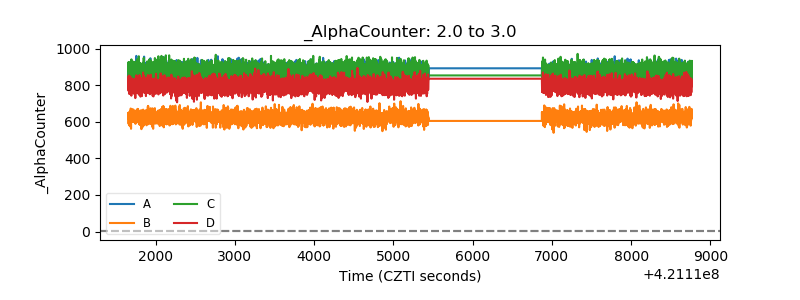 |
| _CPM_Rate | 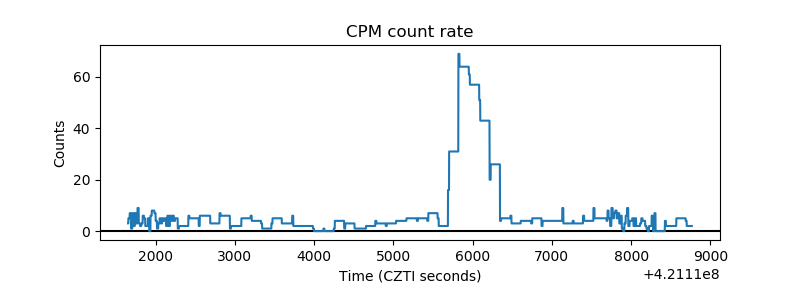 |
| CZT Counter | 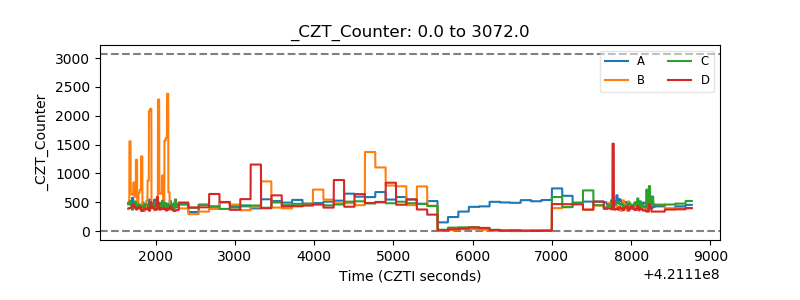 |
| +2.5 Volts monitor | 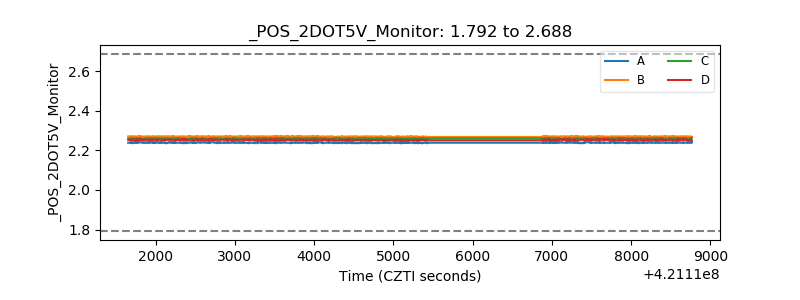 |
| +5 Volts monitor | 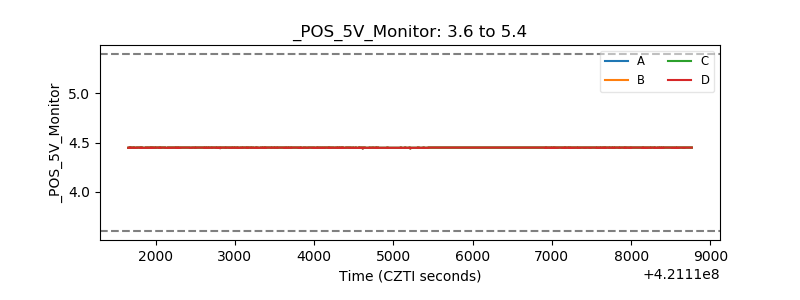 |
| _ROLL_ROT |  |
| _Roll_DEC | 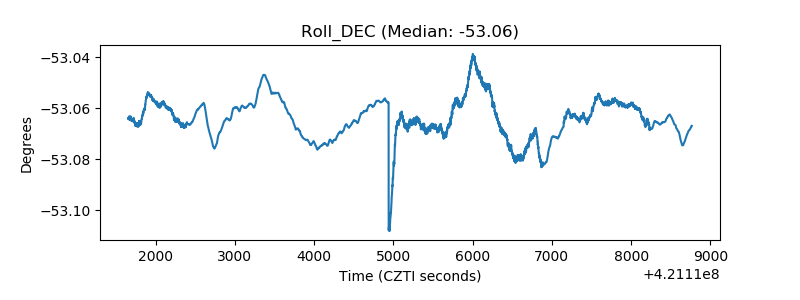 |
| _Roll_RA | 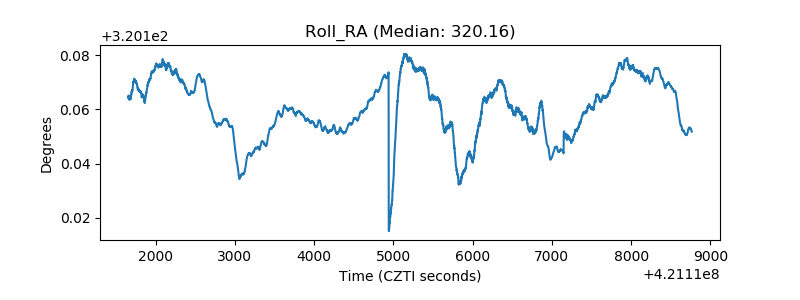 |
| Veto Counter | 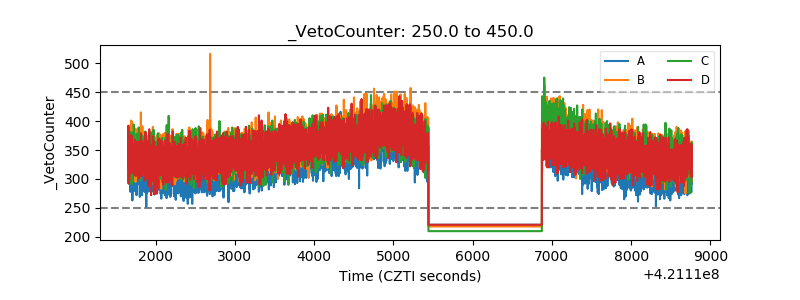 |