| Param | Original file | Final file |
|---|---|---|
| Filename | modeM0/AS1A12_052T04_9000005602_41124cztM0_level2.fits | modeM0/AS1A12_052T04_9000005602_41124cztM0_level2_quad_clean.evt |
| Size (bytes) | 441,348,480 | 110,856,960 |
| Size | 420.9 MB | 105.7 MB |
| Events in quadrant A | 3,546,215 | 753,161 |
| Events in quadrant B | 4,417,155 | 729,427 |
| Events in quadrant C | 3,325,643 | 742,247 |
| Events in quadrant D | 4,509,546 | 649,155 |
| Mode M0 | |||
|---|---|---|---|
| Quadrant | BADHDUFLAG | Total packets | Discarded packets |
| A | 0 | 14555 | 2 |
| B | 0 | 17991 | 1 |
| C | 0 | 14131 | 1 |
| D | 0 | 18359 | 1 |
| Mode M9 | |||
|---|---|---|---|
| Quadrant | BADHDUFLAG | Total packets | Discarded packets |
| A | 0 | 16 | 0 |
| B | 0 | 16 | 0 |
| C | 0 | 16 | 0 |
| D | 0 | 16 | 0 |
| Mode SS | |||
|---|---|---|---|
| Quadrant | BADHDUFLAG | Total packets | Discarded packets |
| A | 0 | 140 | 0 |
| B | 0 | 140 | 0 |
| C | 0 | 140 | 0 |
| D | 0 | 140 | 0 |
| Quadrant | Total seconds | Saturated seconds | Saturation percentage |
|---|---|---|---|
| A | 6929 | 12 | 0.173185% |
| B | 6929 | 466 | 6.725357% |
| C | 6929 | 16 | 0.230914% |
| D | 6929 | 458 | 6.609900% |
Noise dominated data is calculated using 1-second bins in cleaned event files. If a bin has >2000 counts, and if more than 50% of those come from <1% of pixels, then it is considered to be noise-dominated and hence unusable.
| Quadrant | # 1 sec bins | Bins with >0 counts | Bins with >2000 counts | High rate bins dominated by noise | Noise dominated (total time) | Noise dominated (detector-on time) | Marked lightcurve |
|---|---|---|---|---|---|---|---|
| A | 8481 | 6930 | 2 | 2 | 0.02% | 0.03% | 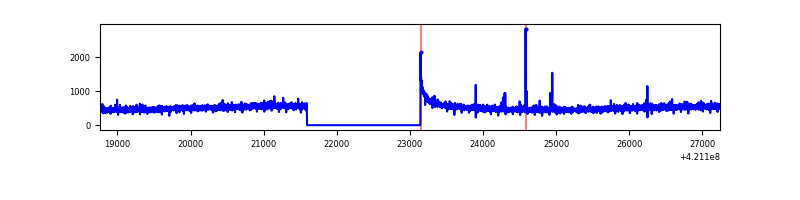 |
| B | 8481 | 6930 | 308 | 308 | 3.63% | 4.44% | 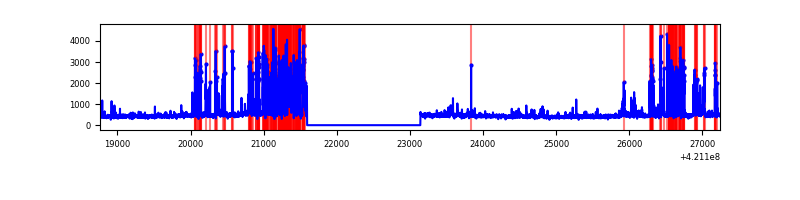 |
| C | 8481 | 6930 | 12 | 12 | 0.14% | 0.17% | 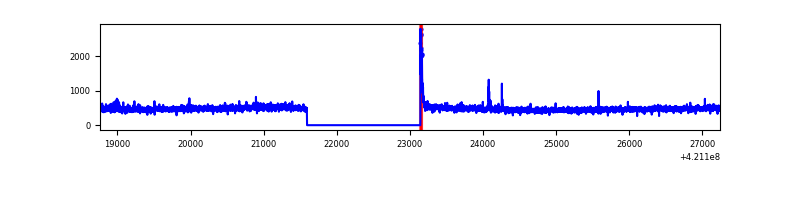 |
| D | 8481 | 6930 | 368 | 368 | 4.34% | 5.31% | 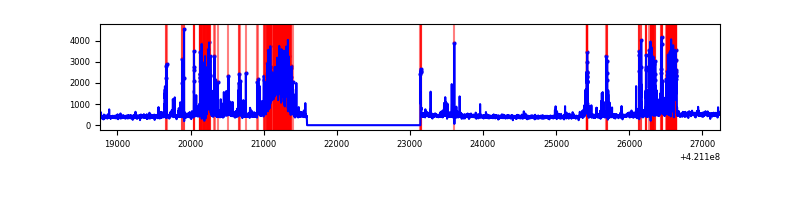 |
Top three noisy pixels from each quadrant. If the there are fewer than three noisy pixels in the level2.evt file, extra rows are filled as -1
| Pixel properties | Quadrant properties | ||||||
|---|---|---|---|---|---|---|---|
| Quadrant | DetID | PixID | Counts | Sigma | Mean | Median | Sigma |
| A | 10 | 83 | 519744 | 3282.49 | 773 | 755 | 158.1 |
| A | 2 | 79 | 24661 | 151.2 | 773 | 755 | 158.1 |
| A | 13 | 254 | 12329 | 73.2 | 773 | 755 | 158.1 |
| B | 0 | 245 | 1380163 | 9524.43 | 740 | 717 | 144.8 |
| B | 0 | 190 | 113687 | 780.0 | 740 | 717 | 144.8 |
| B | 12 | 111 | 18431 | 122.31 | 740 | 717 | 144.8 |
| C | 15 | 214 | 291722 | 1655.87 | 750 | 753 | 175.7 |
| C | 14 | 254 | 51105 | 286.55 | 750 | 753 | 175.7 |
| C | 0 | 10 | 50352 | 282.26 | 750 | 753 | 175.7 |
| D | 2 | 249 | 1113962 | 6160.69 | 740 | 718 | 180.7 |
| D | 13 | 249 | 413975 | 2286.96 | 740 | 718 | 180.7 |
| D | 2 | 16 | 76659 | 420.26 | 740 | 718 | 180.7 |
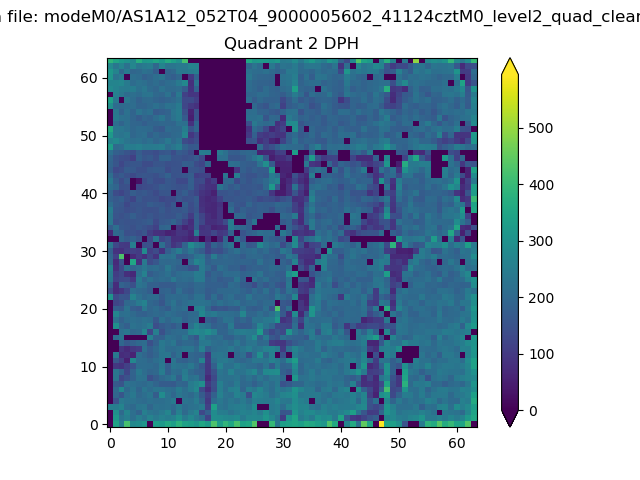
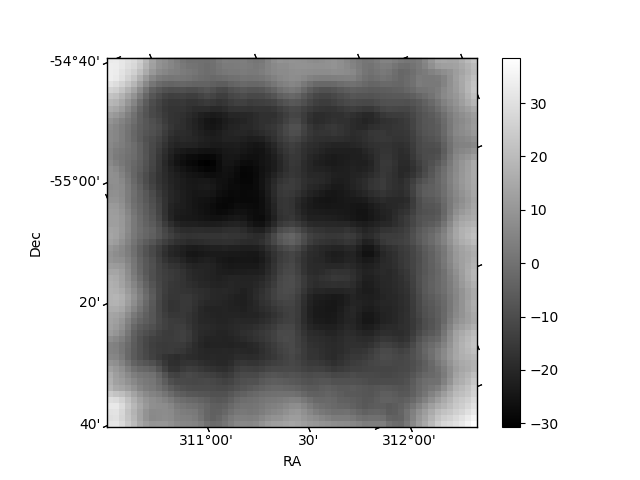
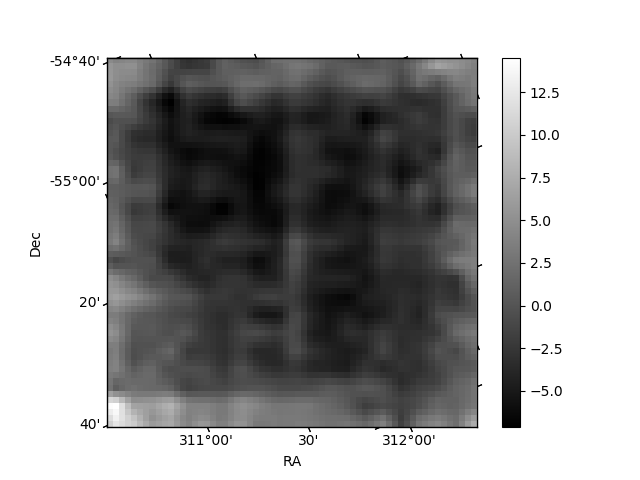
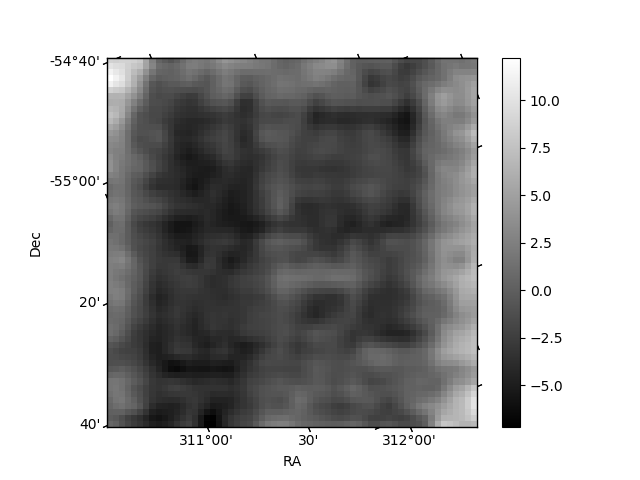
Histogram calculated using DETX and DETY for each event in the final _common_clean file
| Quadrant A | 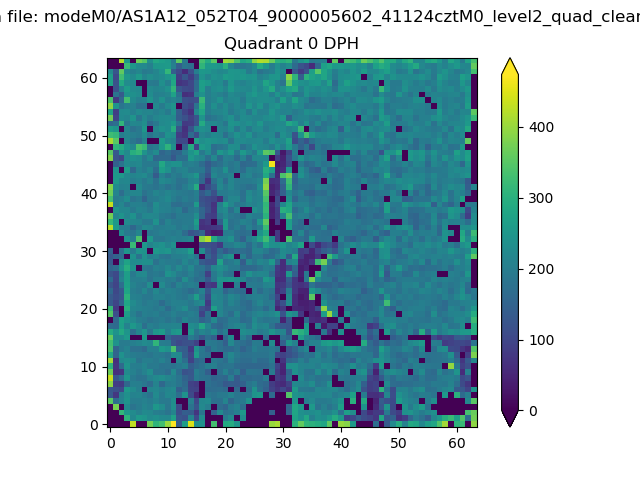 |
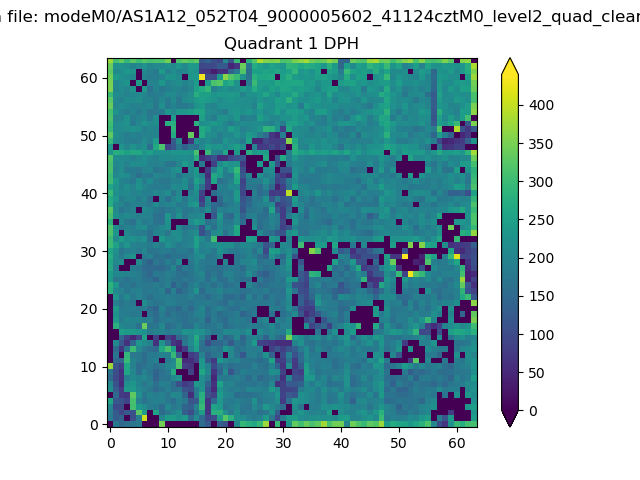 |
Quadrant B |
|---|---|---|---|
| Quadrant D | 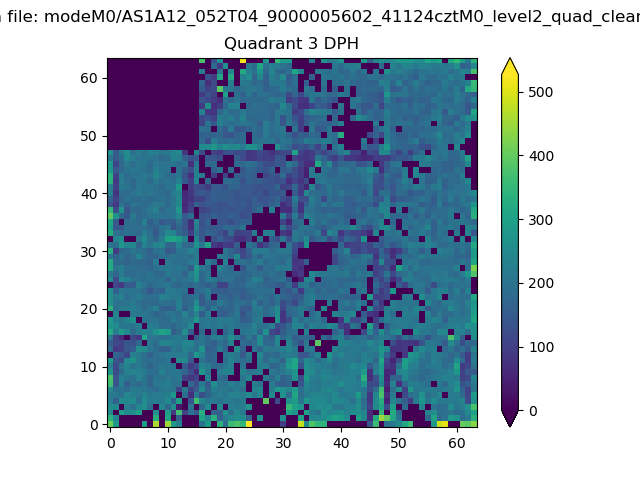 |
 |
Quadrant C |
| Plot type | Count rate plots | Images |
|---|---|---|
| Comparison with Poisson distribution Blue bars denote a histogram of data divided into 1 sec bins. Red curve is a Poisson curve with rate = median count rate of data. |
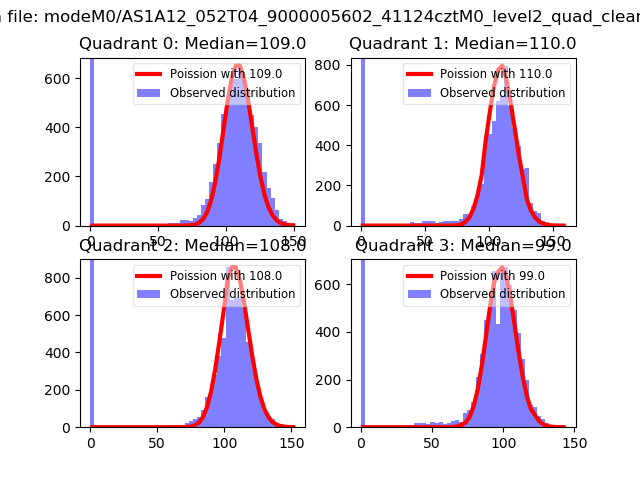 |
 |
| Quadrant-wise count rates Data is divided into 100 sec bins |
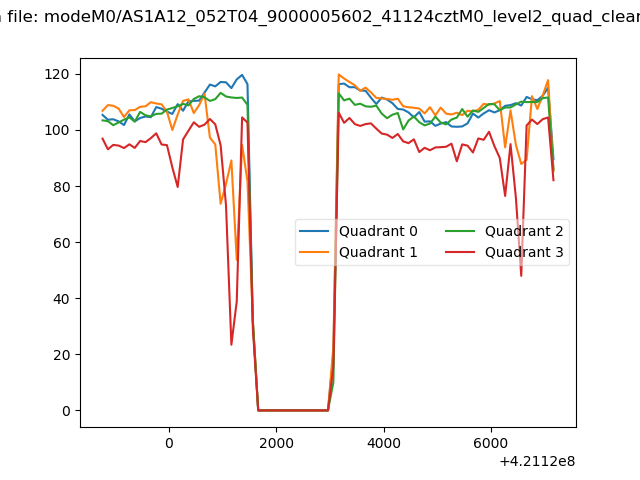 |
|
| Module-wise count rates for Quadrant A Data is divided into 100 sec bins |
 |
 |
| Module-wise count rates for Quadrant B Data is divided into 100 sec bins |
 |
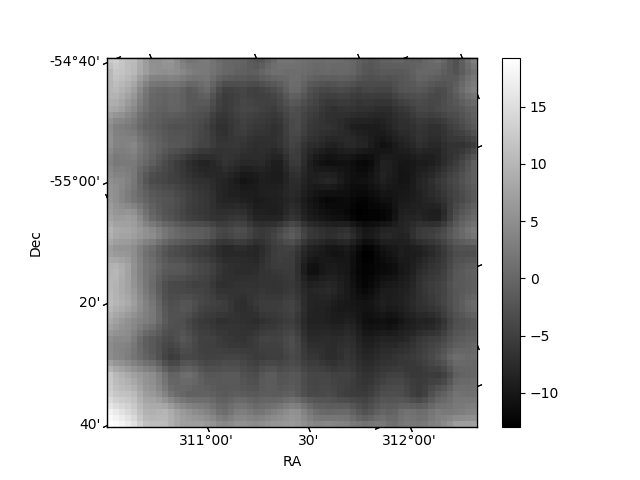 |
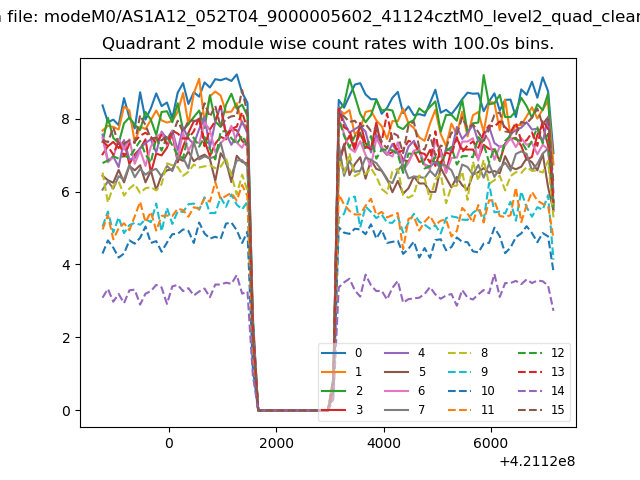
| Module-wise count rates for Quadrant C Data is divided into 100 sec bins |
 |
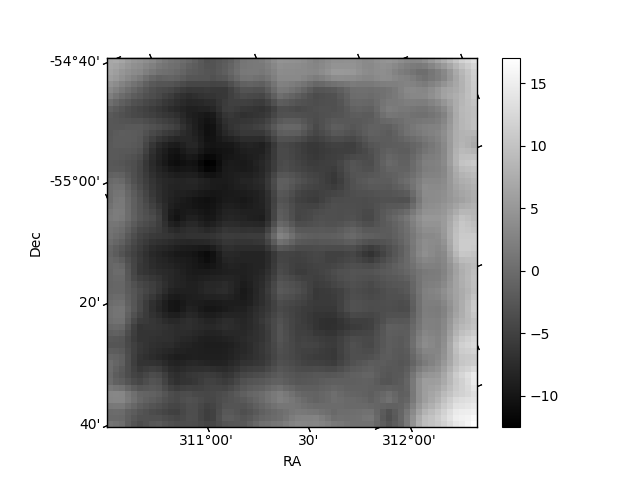 |
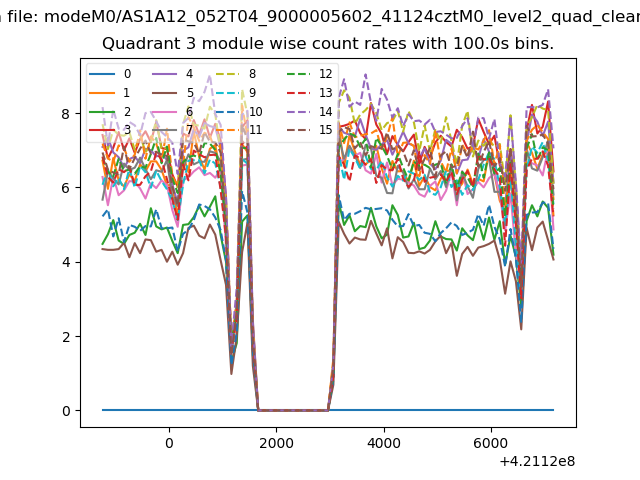
| Module-wise count rates for Quadrant D Data is divided into 100 sec bins |
 |
 |
| Parameter | Plot |
|---|---|
| CZT HV Monitor | 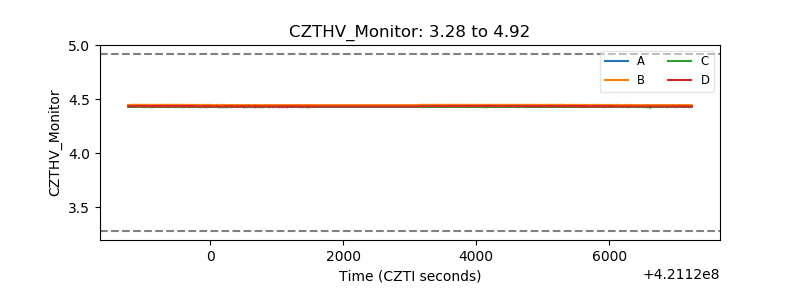 |
| D_VDD | 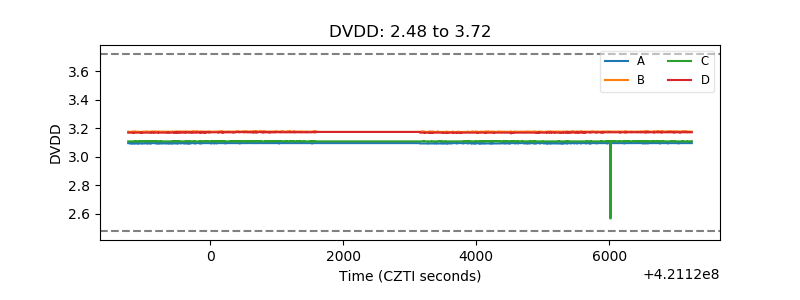 |
| Temperature 1 | 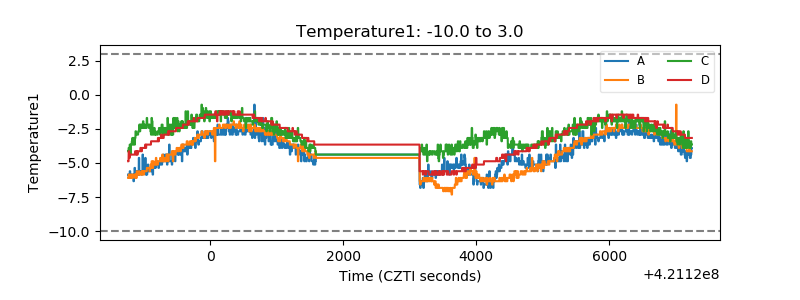 |
| Veto HV Monitor | 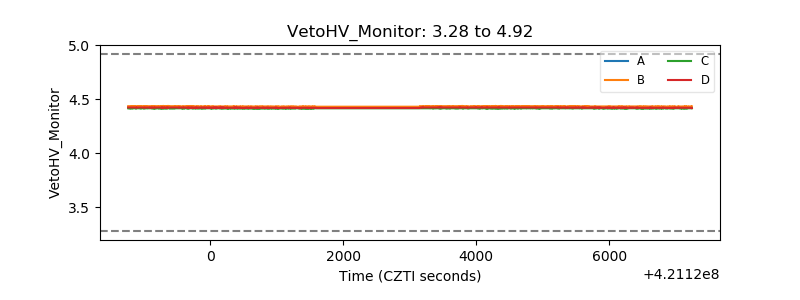 |
| Veto LLD | 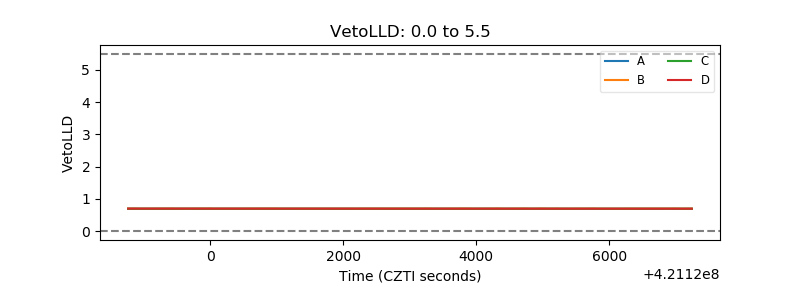 |
| Alpha Counter | 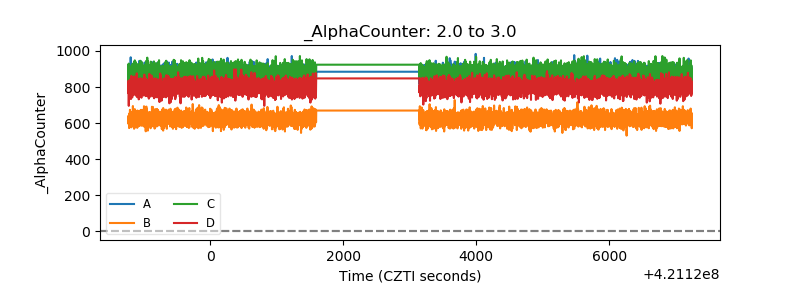 |
| _CPM_Rate | 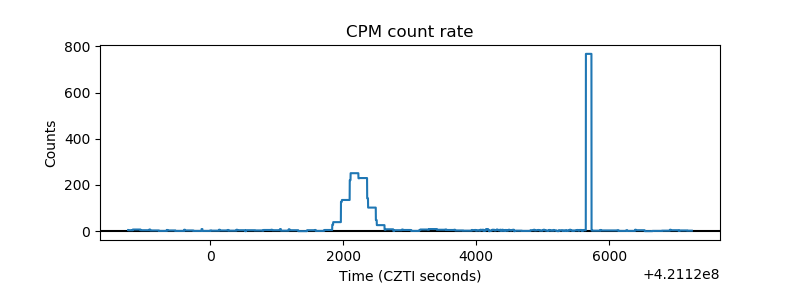 |
| CZT Counter | 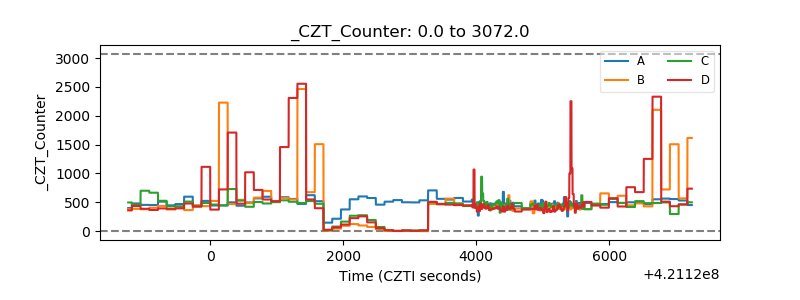 |
| +2.5 Volts monitor | 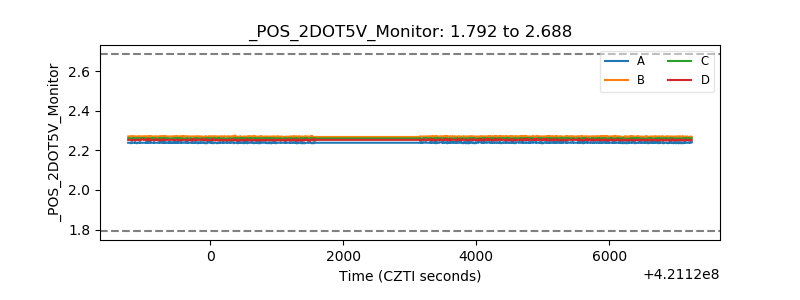 |
| +5 Volts monitor |  |
| _ROLL_ROT | 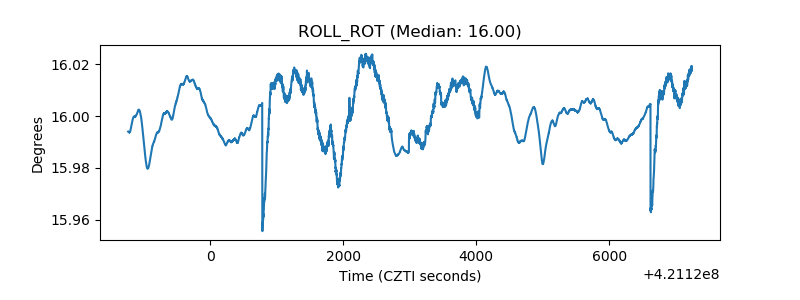 |
| _Roll_DEC | 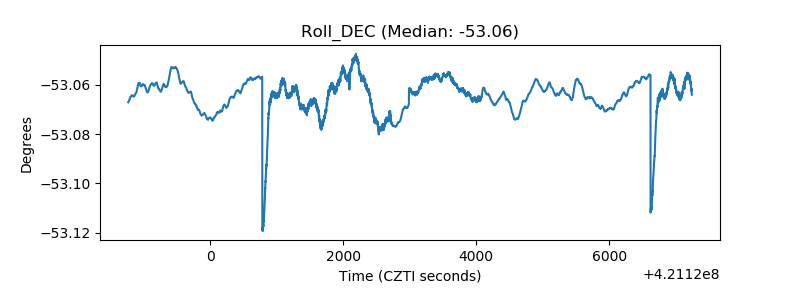 |
| _Roll_RA | 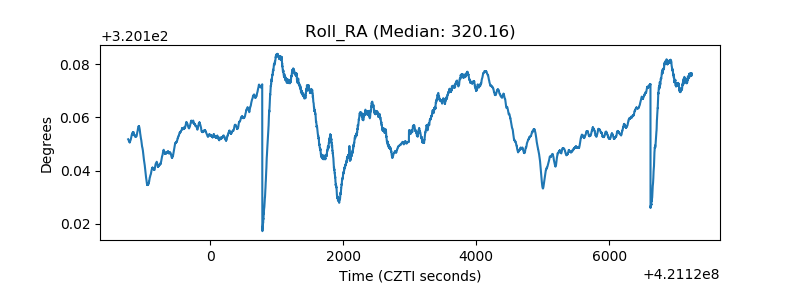 |
| Veto Counter | 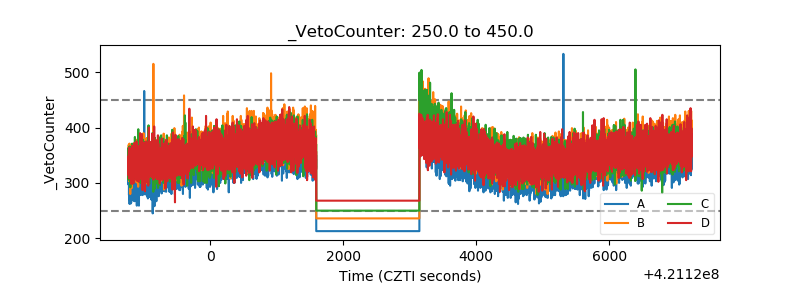 |