| Param | Original file | Final file |
|---|---|---|
| Filename | modeM0/AS1A12_052T04_9000005602_41125cztM0_level2.fits | modeM0/AS1A12_052T04_9000005602_41125cztM0_level2_quad_clean.evt |
| Size (bytes) | 802,529,280 | 182,891,520 |
| Size | 765.4 MB | 174.4 MB |
| Events in quadrant A | 6,119,254 | 1,266,984 |
| Events in quadrant B | 7,469,605 | 1,208,639 |
| Events in quadrant C | 5,857,855 | 1,234,369 |
| Events in quadrant D | 9,416,007 | 1,072,918 |
| Mode M0 | |||
|---|---|---|---|
| Quadrant | BADHDUFLAG | Total packets | Discarded packets |
| A | 0 | 24719 | 4 |
| B | 0 | 29559 | 3 |
| C | 0 | 23924 | 3 |
| D | 0 | 35217 | 3 |
| Mode M9 | |||
|---|---|---|---|
| Quadrant | BADHDUFLAG | Total packets | Discarded packets |
| A | 0 | 53 | 0 |
| B | 0 | 53 | 0 |
| C | 0 | 53 | 0 |
| D | 0 | 53 | 0 |
| Mode SS | |||
|---|---|---|---|
| Quadrant | BADHDUFLAG | Total packets | Discarded packets |
| A | 0 | 226 | 0 |
| B | 0 | 226 | 0 |
| C | 0 | 226 | 0 |
| D | 0 | 226 | 0 |
| Quadrant | Total seconds | Saturated seconds | Saturation percentage |
|---|---|---|---|
| A | 10899 | 20 | 0.183503% |
| B | 10899 | 892 | 8.184237% |
| C | 10899 | 151 | 1.385448% |
| D | 10899 | 1072 | 9.835765% |
Noise dominated data is calculated using 1-second bins in cleaned event files. If a bin has >2000 counts, and if more than 50% of those come from <1% of pixels, then it is considered to be noise-dominated and hence unusable.
| Quadrant | # 1 sec bins | Bins with >0 counts | Bins with >2000 counts | High rate bins dominated by noise | Noise dominated (total time) | Noise dominated (detector-on time) | Marked lightcurve |
|---|---|---|---|---|---|---|---|
| A | 16249 | 10902 | 7 | 7 | 0.04% | 0.06% | 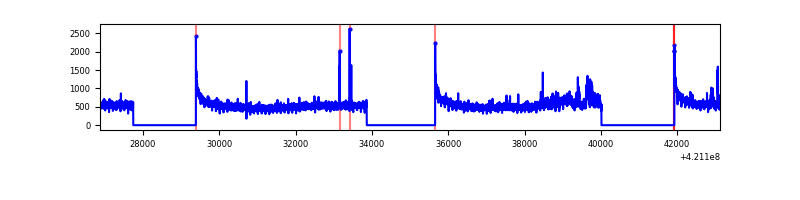 |
| B | 16249 | 10901 | 631 | 631 | 3.88% | 5.79% | 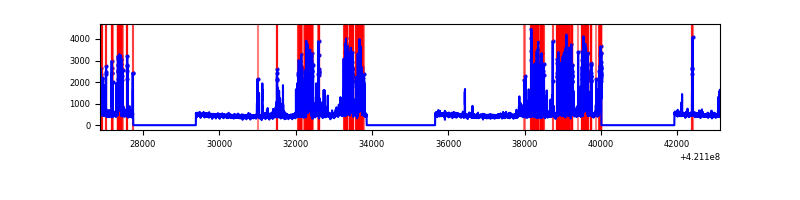 |
| C | 16249 | 10902 | 118 | 118 | 0.73% | 1.08% | 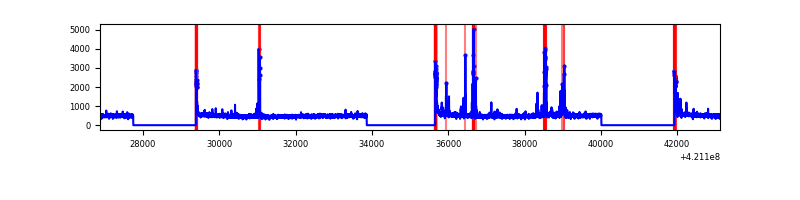 |
| D | 16249 | 10902 | 903 | 903 | 5.56% | 8.28% | 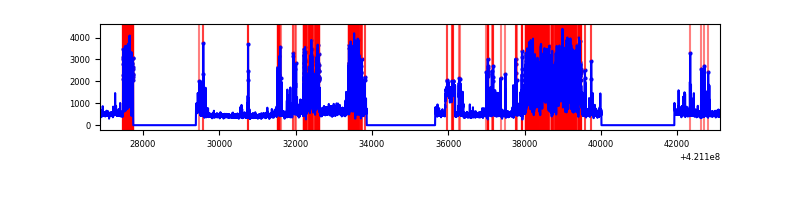 |
Top three noisy pixels from each quadrant. If the there are fewer than three noisy pixels in the level2.evt file, extra rows are filled as -1
| Pixel properties | Quadrant properties | ||||||
|---|---|---|---|---|---|---|---|
| Quadrant | DetID | PixID | Counts | Sigma | Mean | Median | Sigma |
| A | 10 | 83 | 959471 | 3780.02 | 1254 | 1227 | 253.5 |
| A | 14 | 235 | 153240 | 599.65 | 1254 | 1227 | 253.5 |
| A | 12 | 189 | 95783 | 373.0 | 1254 | 1227 | 253.5 |
| B | 0 | 245 | 2630143 | 11587.1 | 1197 | 1164 | 226.9 |
| B | 5 | 255 | 52671 | 227.01 | 1197 | 1164 | 226.9 |
| B | 0 | 229 | 44729 | 192.01 | 1197 | 1164 | 226.9 |
| C | 15 | 214 | 466888 | 1665.34 | 1213 | 1223 | 279.6 |
| C | 14 | 254 | 362583 | 1292.32 | 1213 | 1223 | 279.6 |
| C | 0 | 10 | 222397 | 790.98 | 1213 | 1223 | 279.6 |
| D | 2 | 249 | 3085284 | 10705.37 | 1191 | 1158 | 288.1 |
| D | 13 | 249 | 825576 | 2861.65 | 1191 | 1158 | 288.1 |
| D | 2 | 16 | 782042 | 2710.54 | 1191 | 1158 | 288.1 |
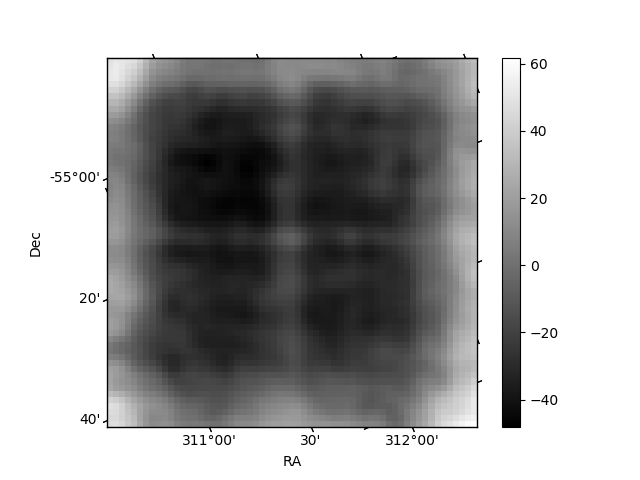
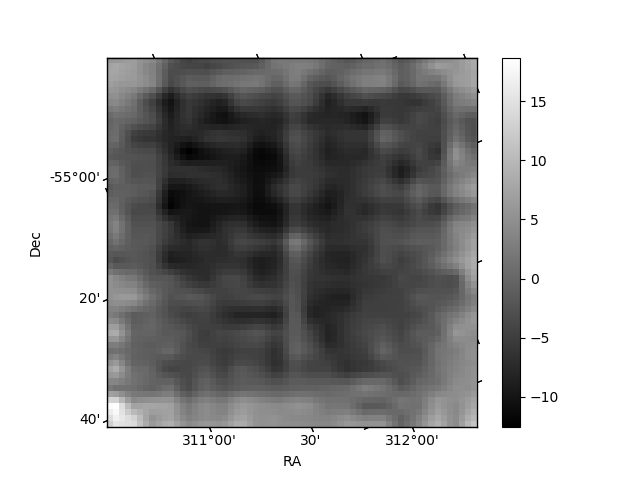
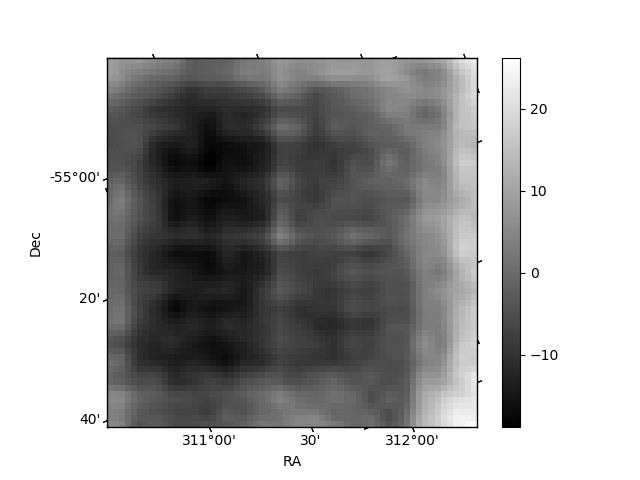
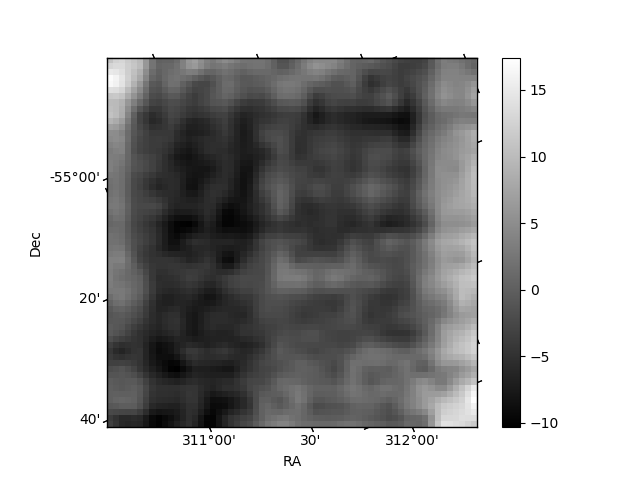
Histogram calculated using DETX and DETY for each event in the final _common_clean file
| Quadrant A | 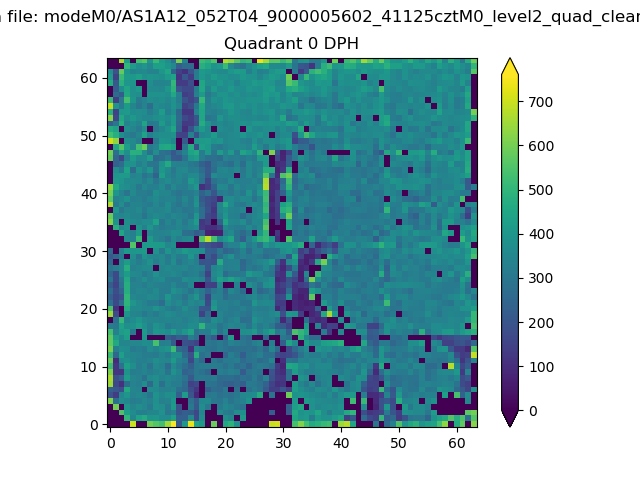 |
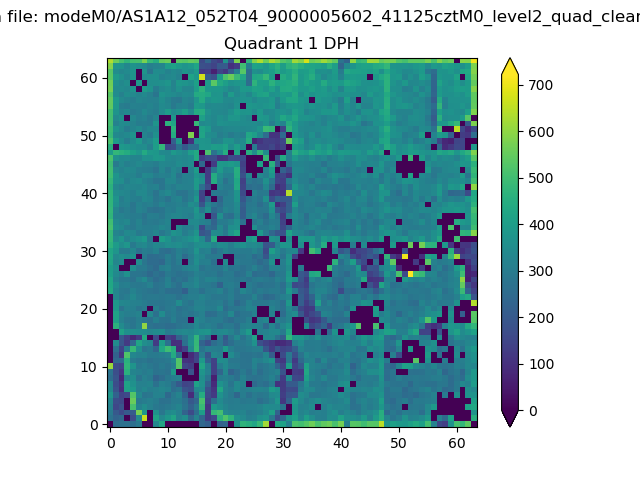 |
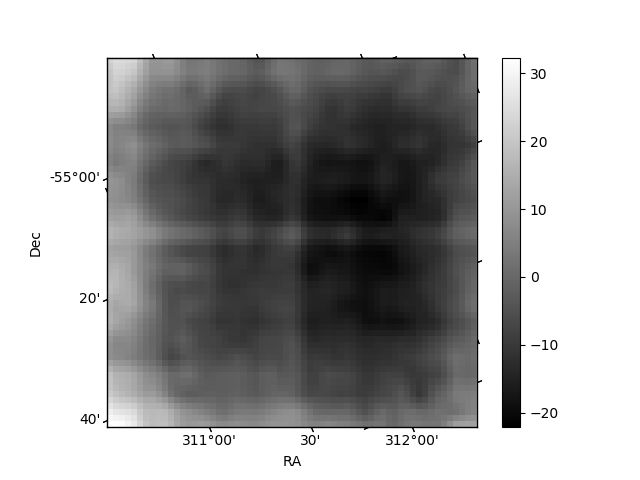
Quadrant B |
|---|---|---|---|
| Quadrant D | 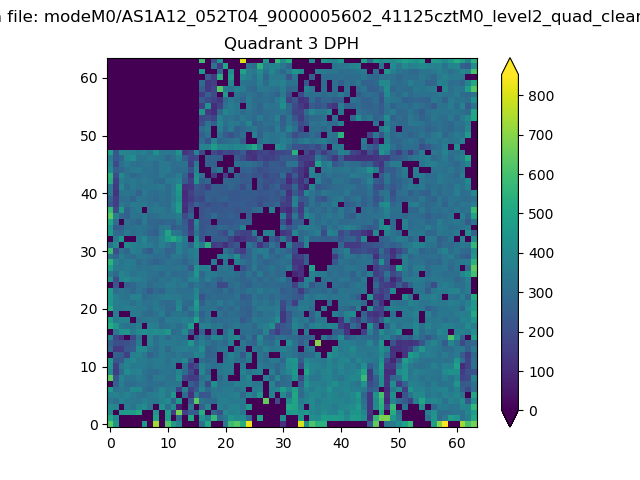 |
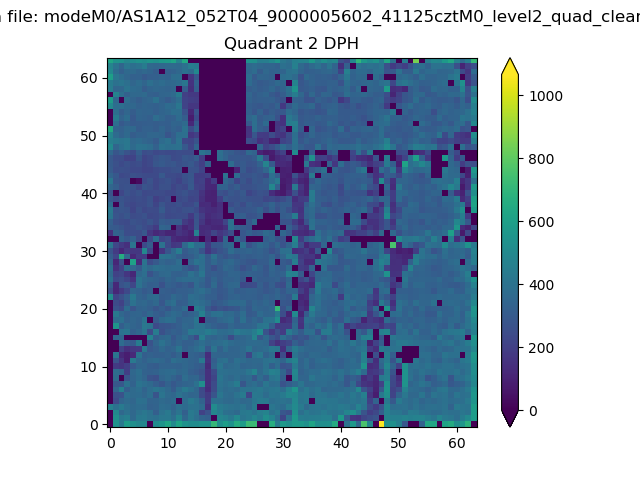 |
Quadrant C |
| Plot type | Count rate plots | Images |
|---|---|---|
| Comparison with Poisson distribution Blue bars denote a histogram of data divided into 1 sec bins. Red curve is a Poisson curve with rate = median count rate of data. |
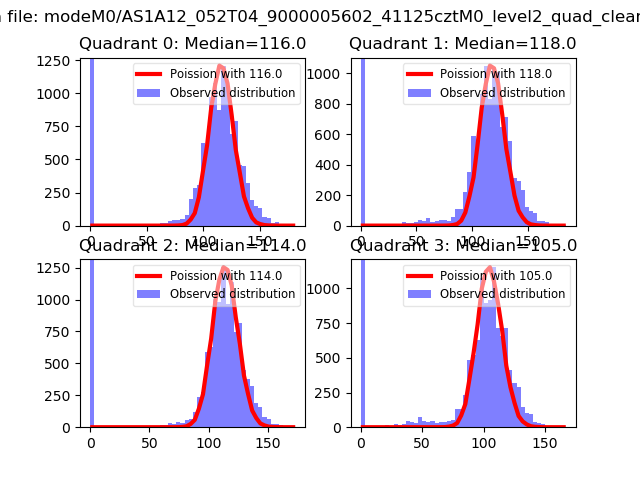 |
 |
| Quadrant-wise count rates Data is divided into 100 sec bins |
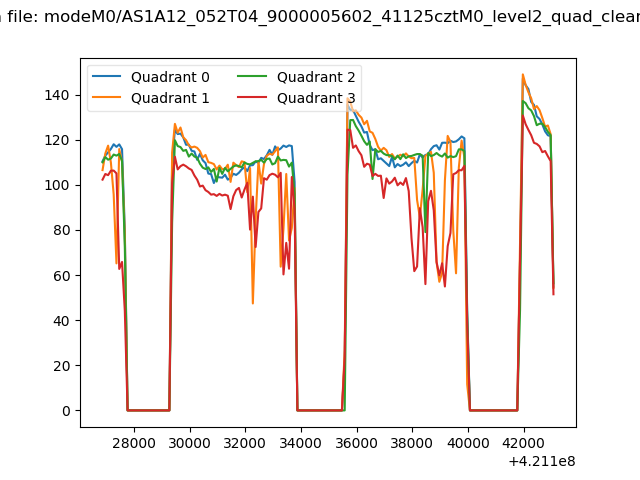 |
|
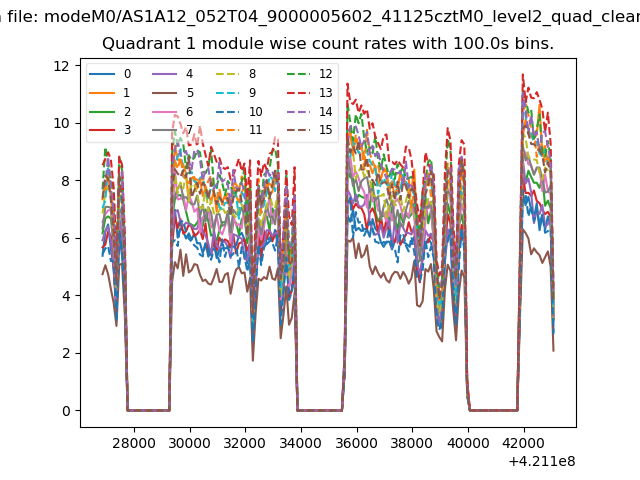
| Module-wise count rates for Quadrant A Data is divided into 100 sec bins |
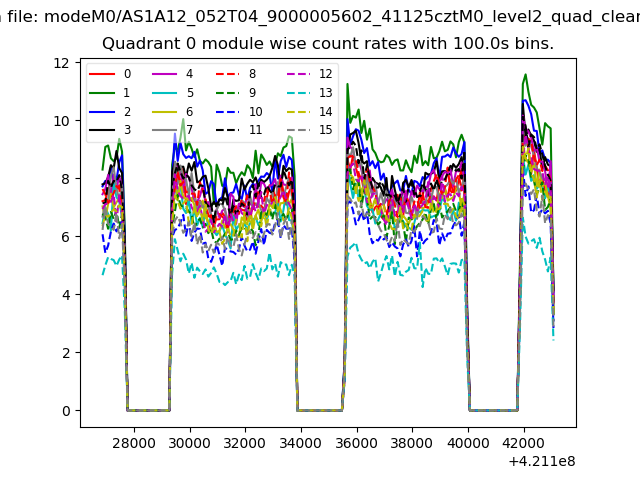 |
 |
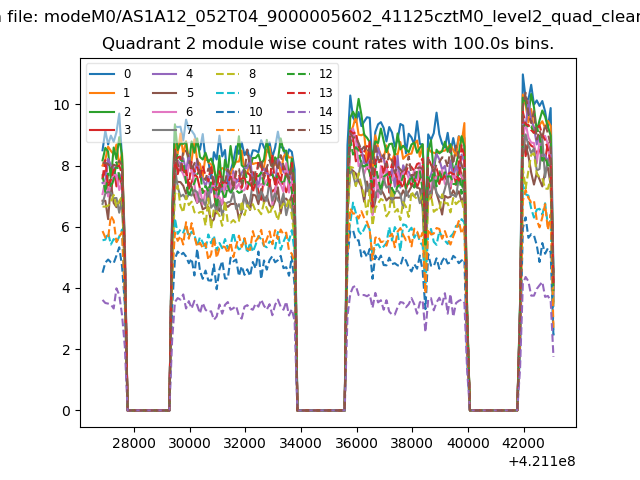
| Module-wise count rates for Quadrant B Data is divided into 100 sec bins |
 |
 |
| Module-wise count rates for Quadrant C Data is divided into 100 sec bins |
 |
 |
| Module-wise count rates for Quadrant D Data is divided into 100 sec bins |
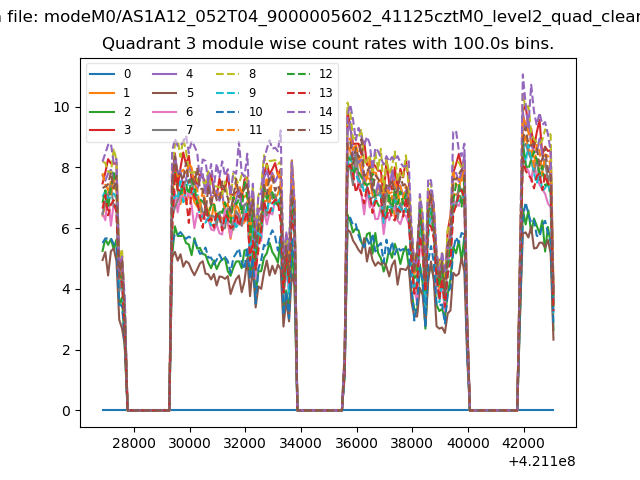 |
 |
| Parameter | Plot |
|---|---|
| CZT HV Monitor |  |
| D_VDD | 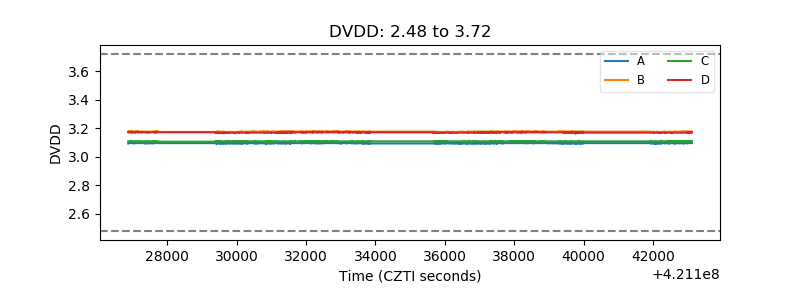 |
| Temperature 1 | 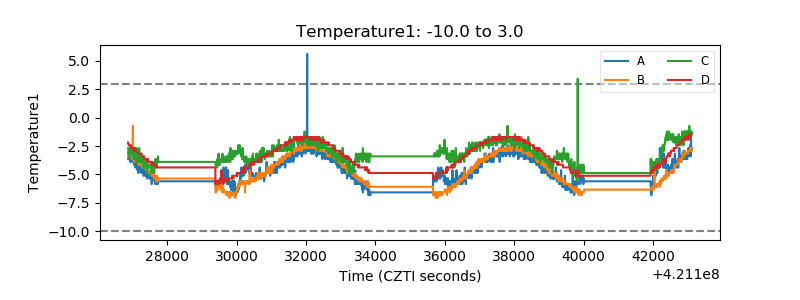 |
| Veto HV Monitor | 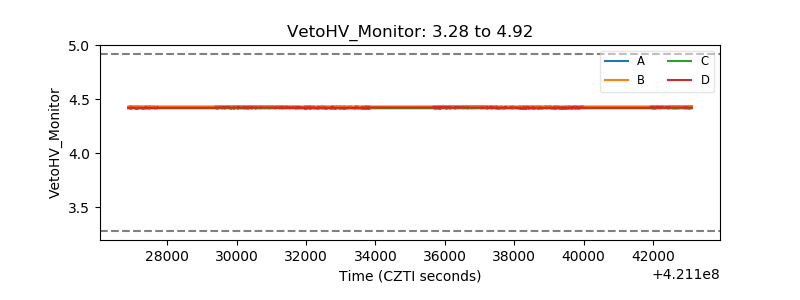 |
| Veto LLD | 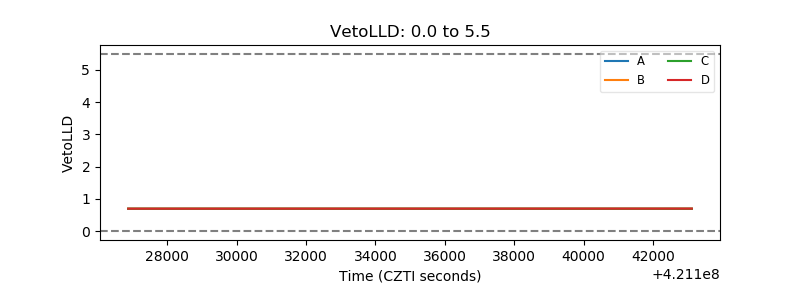 |
| Alpha Counter | 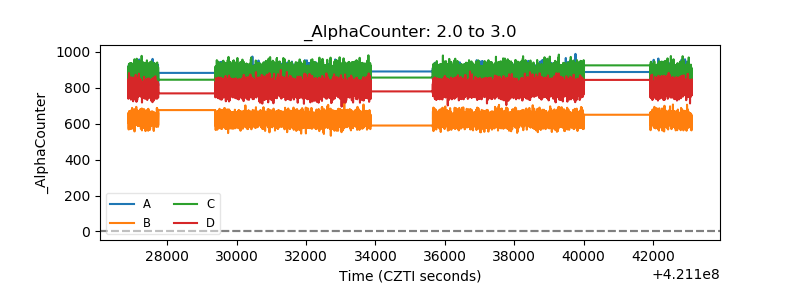 |
| _CPM_Rate | 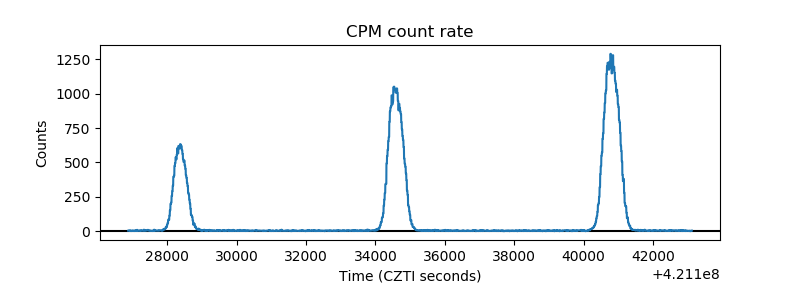 |
| CZT Counter | 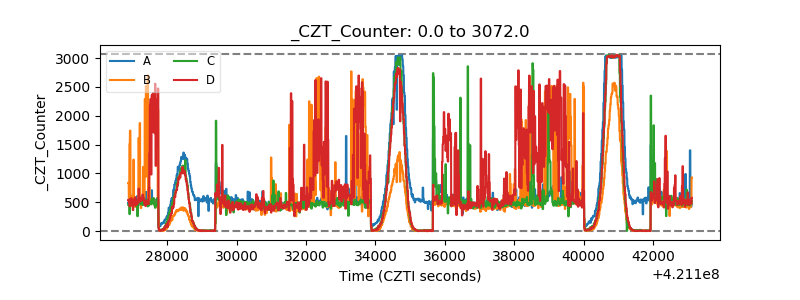 |
| +2.5 Volts monitor | 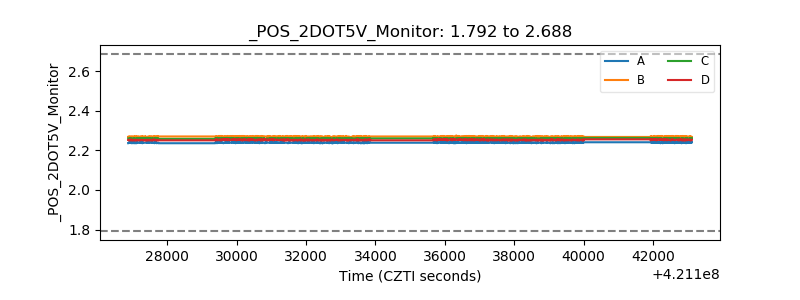 |
| +5 Volts monitor | 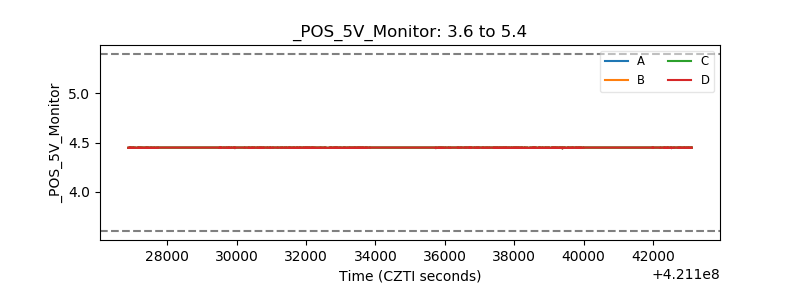 |
| _ROLL_ROT | 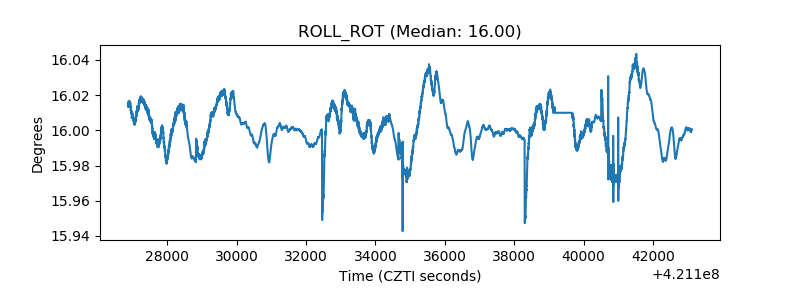 |
| _Roll_DEC | 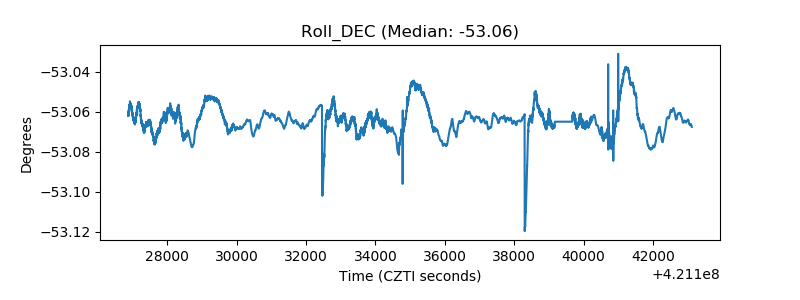 |
| _Roll_RA | 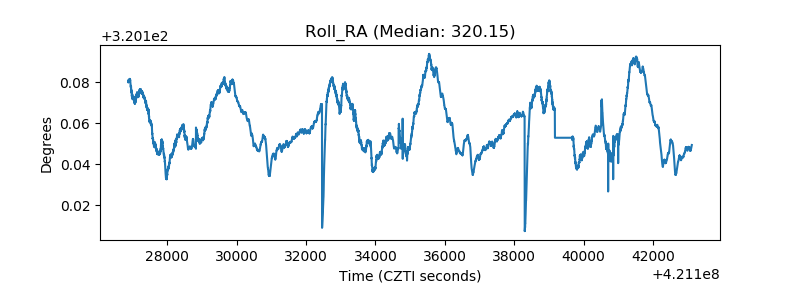 |
| Veto Counter | 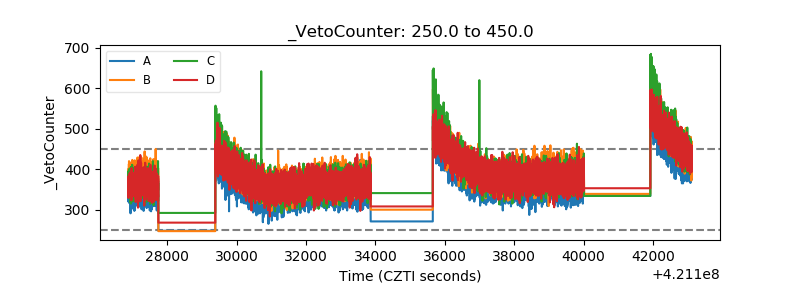 |