| Param | Original file | Final file |
|---|---|---|
| Filename | modeM0/AS1A12_052T04_9000005602_41126cztM0_level2.fits | modeM0/AS1A12_052T04_9000005602_41126cztM0_level2_quad_clean.evt |
| Size (bytes) | 397,120,320 | 93,314,880 |
| Size | 378.7 MB | 89.0 MB |
| Events in quadrant A | 2,998,161 | 654,739 |
| Events in quadrant B | 4,594,089 | 583,804 |
| Events in quadrant C | 2,666,855 | 635,254 |
| Events in quadrant D | 4,035,753 | 586,597 |
| Mode M0 | |||
|---|---|---|---|
| Quadrant | BADHDUFLAG | Total packets | Discarded packets |
| A | 0 | 11905 | 2 |
| B | 0 | 16939 | 1 |
| C | 0 | 10903 | 1 |
| D | 0 | 15670 | 1 |
| Mode M9 | |||
|---|---|---|---|
| Quadrant | BADHDUFLAG | Total packets | Discarded packets |
| A | 0 | 20 | 0 |
| B | 0 | 20 | 0 |
| C | 0 | 20 | 0 |
| D | 0 | 20 | 0 |
| Mode SS | |||
|---|---|---|---|
| Quadrant | BADHDUFLAG | Total packets | Discarded packets |
| A | 0 | 108 | 0 |
| B | 0 | 108 | 0 |
| C | 0 | 108 | 0 |
| D | 0 | 108 | 0 |
| Quadrant | Total seconds | Saturated seconds | Saturation percentage |
|---|---|---|---|
| A | 5211 | 11 | 0.211092% |
| B | 5211 | 778 | 14.929956% |
| C | 5211 | 25 | 0.479754% |
| D | 5211 | 103 | 1.976588% |
Noise dominated data is calculated using 1-second bins in cleaned event files. If a bin has >2000 counts, and if more than 50% of those come from <1% of pixels, then it is considered to be noise-dominated and hence unusable.
| Quadrant | # 1 sec bins | Bins with >0 counts | Bins with >2000 counts | High rate bins dominated by noise | Noise dominated (total time) | Noise dominated (detector-on time) | Marked lightcurve |
|---|---|---|---|---|---|---|---|
| A | 7243 | 5212 | 2 | 2 | 0.03% | 0.04% | 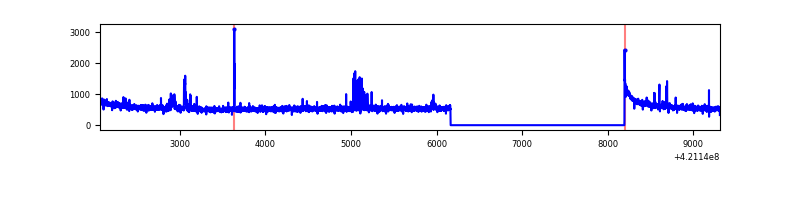 |
| B | 7243 | 5212 | 591 | 591 | 8.16% | 11.34% | 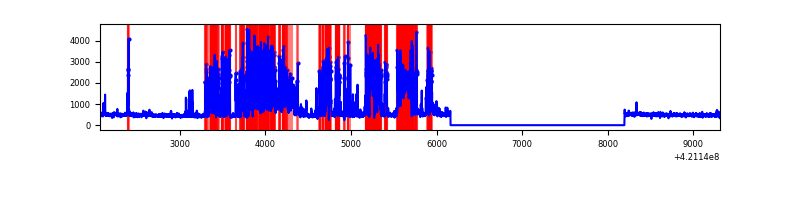 |
| C | 7243 | 5212 | 26 | 26 | 0.36% | 0.50% | 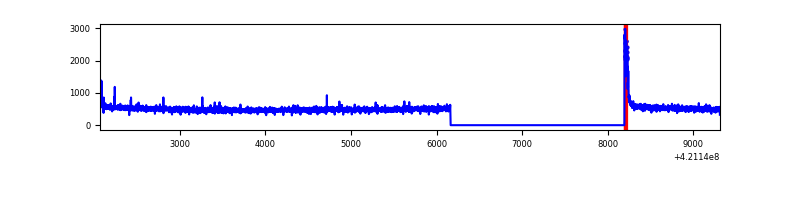 |
| D | 7243 | 5212 | 92 | 92 | 1.27% | 1.77% | 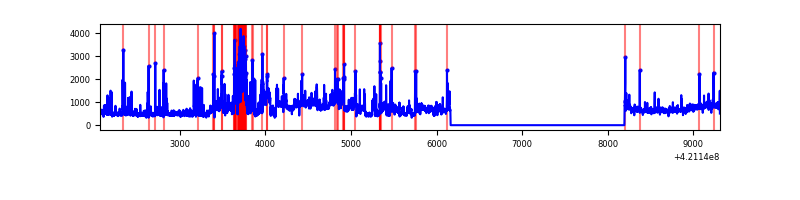 |
Top three noisy pixels from each quadrant. If the there are fewer than three noisy pixels in the level2.evt file, extra rows are filled as -1
| Pixel properties | Quadrant properties | ||||||
|---|---|---|---|---|---|---|---|
| Quadrant | DetID | PixID | Counts | Sigma | Mean | Median | Sigma |
| A | 10 | 83 | 465226 | 3667.06 | 622 | 608 | 126.7 |
| A | 2 | 79 | 57394 | 448.19 | 622 | 608 | 126.7 |
| A | 12 | 189 | 51147 | 398.89 | 622 | 608 | 126.7 |
| B | 0 | 245 | 2001014 | 18149.94 | 580 | 565 | 110.2 |
| B | 0 | 186 | 241014 | 2181.58 | 580 | 565 | 110.2 |
| B | 5 | 255 | 64986 | 584.49 | 580 | 565 | 110.2 |
| C | 15 | 214 | 225198 | 1634.12 | 599 | 605 | 137.4 |
| C | 0 | 10 | 79786 | 576.12 | 599 | 605 | 137.4 |
| C | 12 | 249 | 9939 | 67.91 | 599 | 605 | 137.4 |
| D | 2 | 16 | 1114096 | 7487.72 | 606 | 589 | 148.7 |
| D | 2 | 249 | 300716 | 2018.19 | 606 | 589 | 148.7 |
| D | 13 | 249 | 198039 | 1327.74 | 606 | 589 | 148.7 |
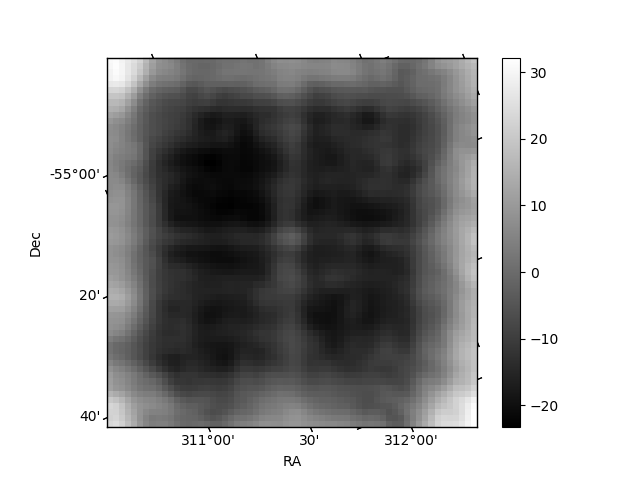
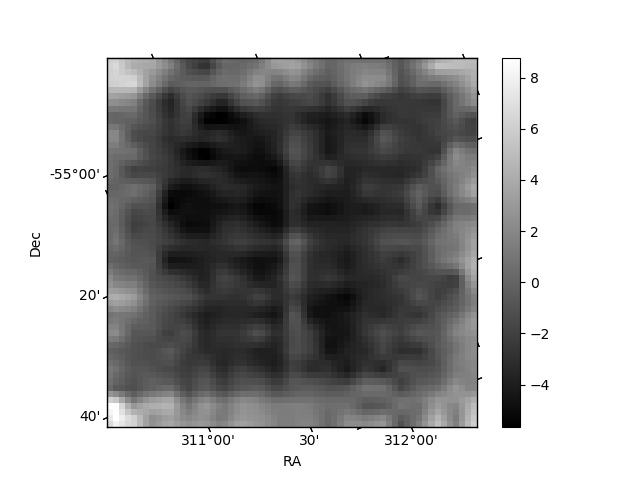
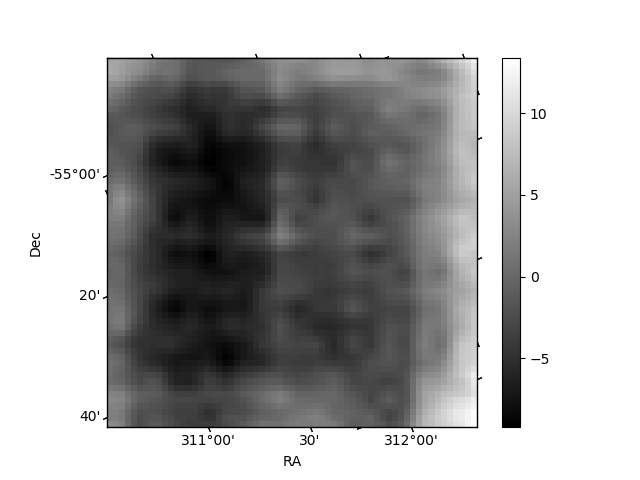
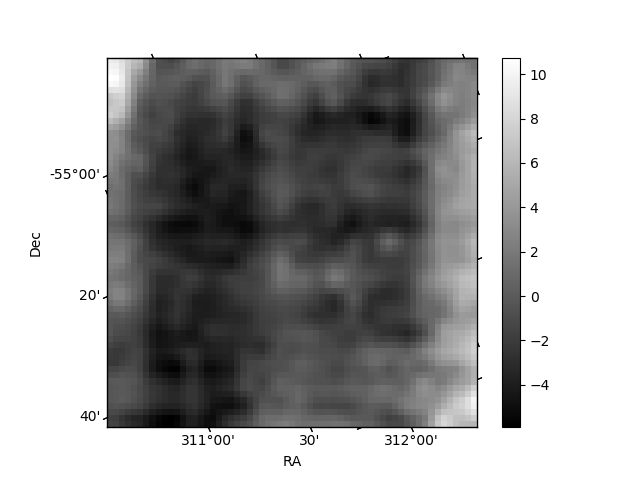
Histogram calculated using DETX and DETY for each event in the final _common_clean file
| Quadrant A | 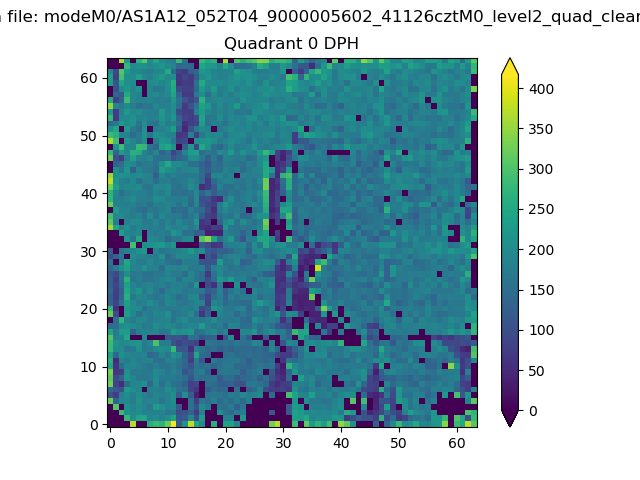 |
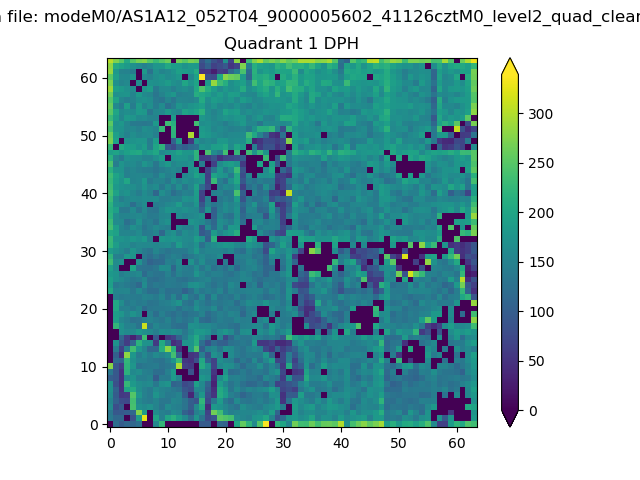 |
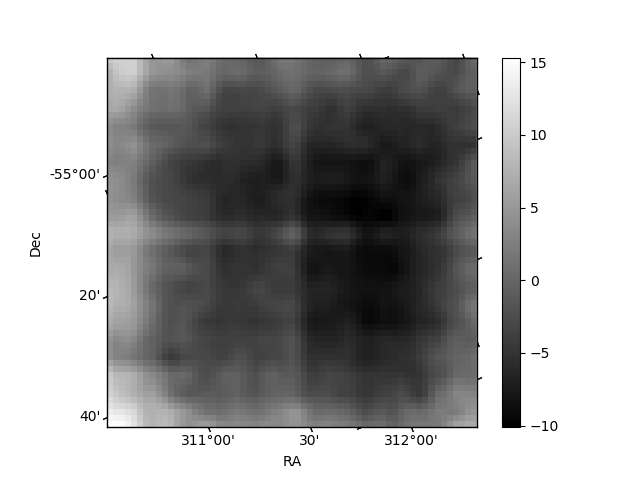
Quadrant B |
|---|---|---|---|
| Quadrant D | 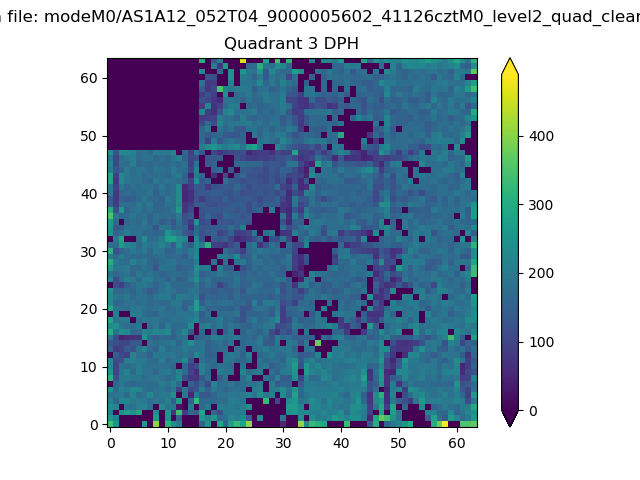 |
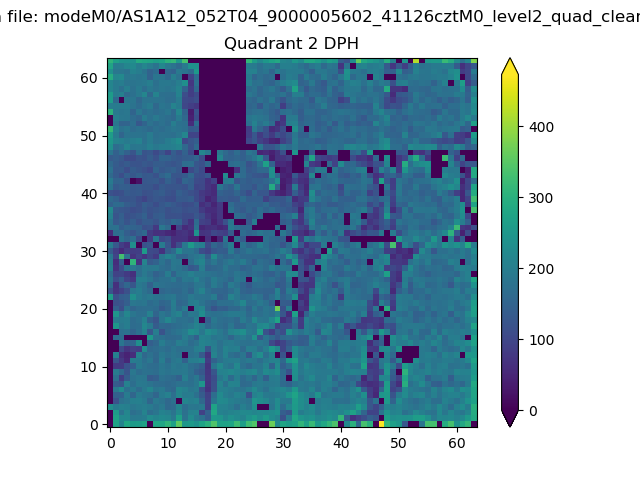 |
Quadrant C |
| Plot type | Count rate plots | Images |
|---|---|---|
| Comparison with Poisson distribution Blue bars denote a histogram of data divided into 1 sec bins. Red curve is a Poisson curve with rate = median count rate of data. |
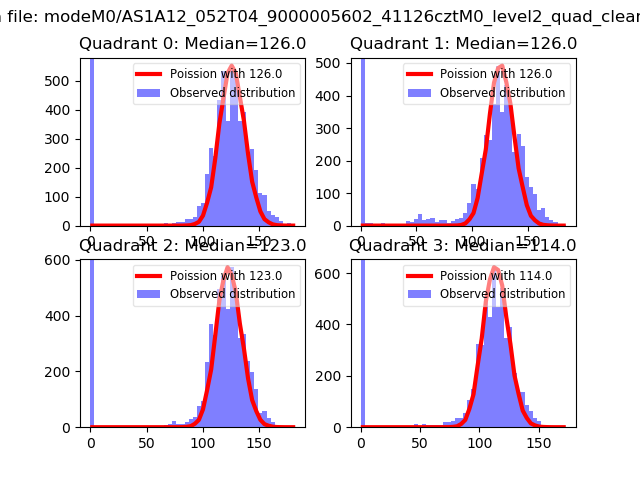 |
 |
| Quadrant-wise count rates Data is divided into 100 sec bins |
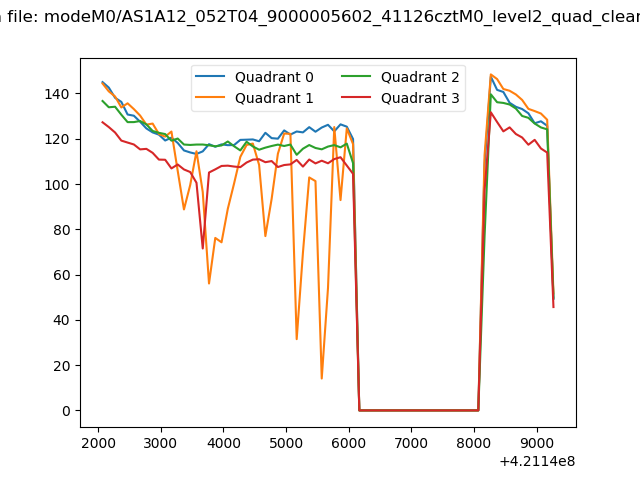 |
|
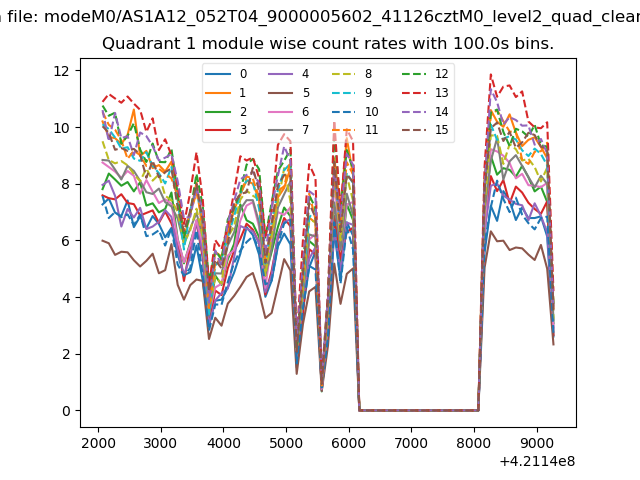
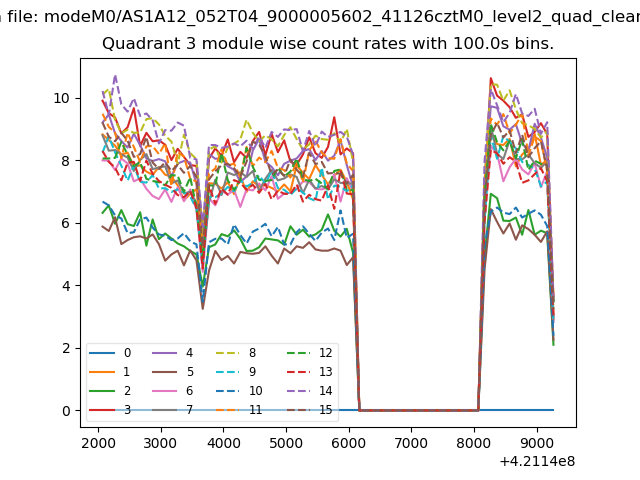
| Module-wise count rates for Quadrant A Data is divided into 100 sec bins |
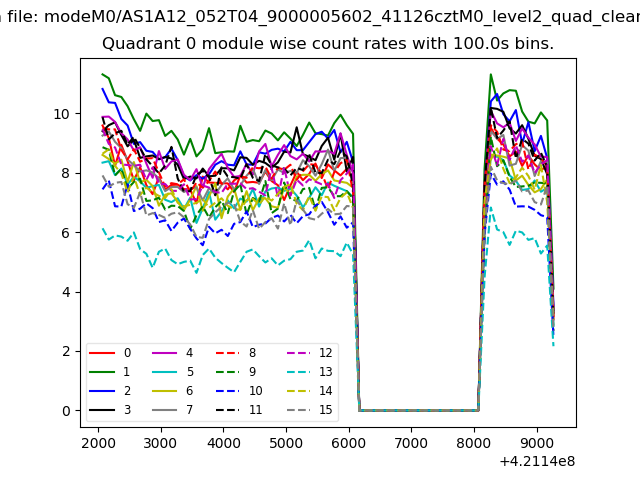 |
 |
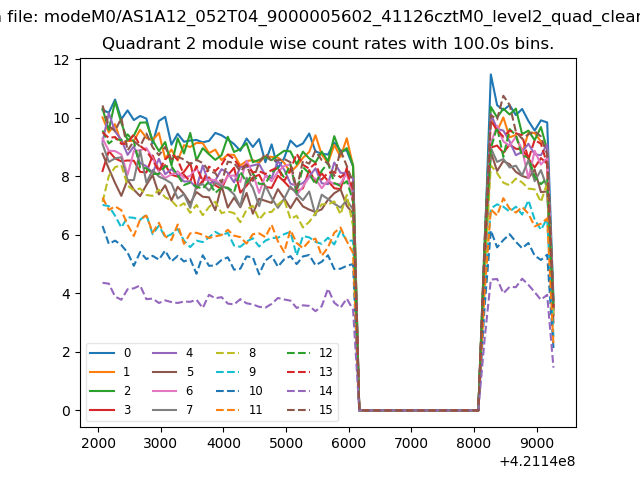
| Module-wise count rates for Quadrant B Data is divided into 100 sec bins |
 |
 |
| Module-wise count rates for Quadrant C Data is divided into 100 sec bins |
 |
 |
| Module-wise count rates for Quadrant D Data is divided into 100 sec bins |
 |
 |
| Parameter | Plot |
|---|---|
| CZT HV Monitor | 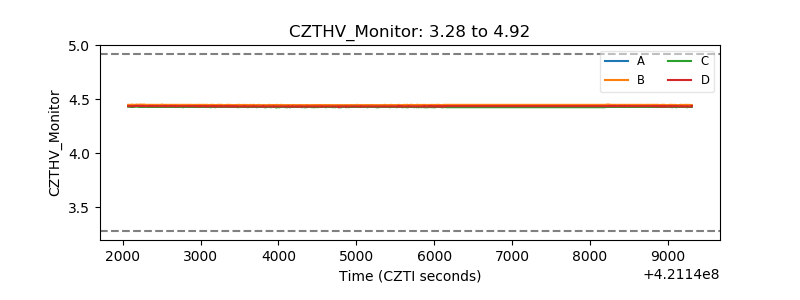 |
| D_VDD | 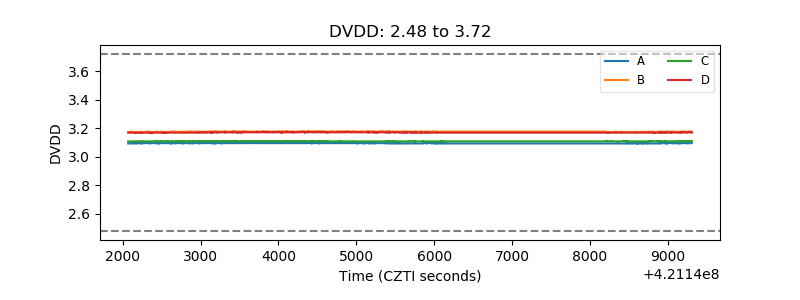 |
| Temperature 1 | 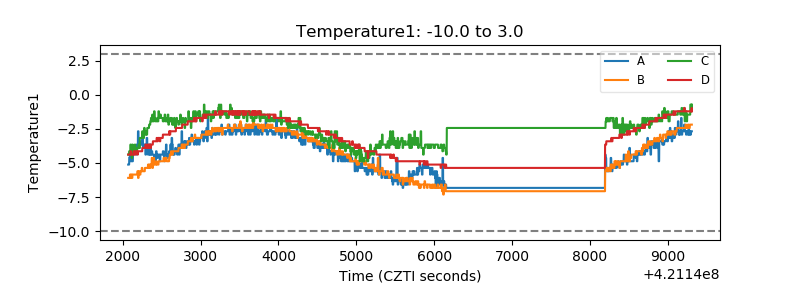 |
| Veto HV Monitor | 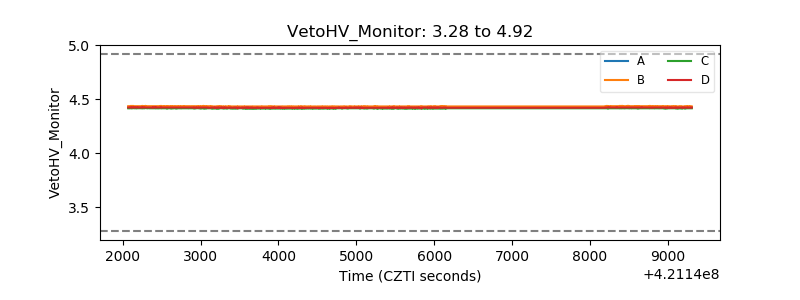 |
| Veto LLD | 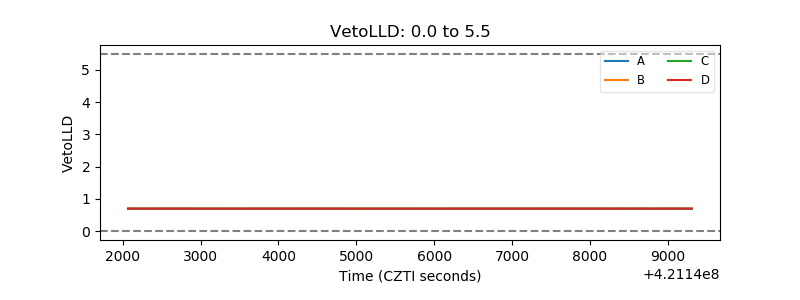 |
| Alpha Counter | 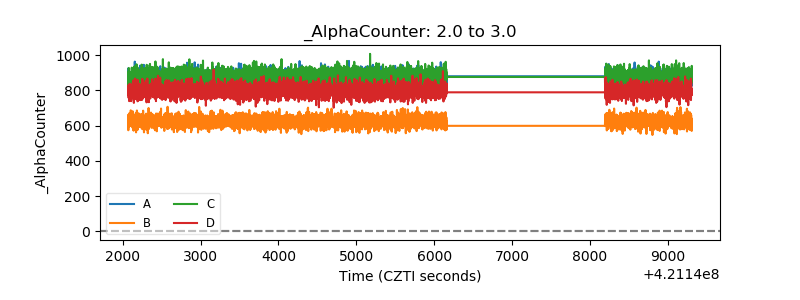 |
| _CPM_Rate | 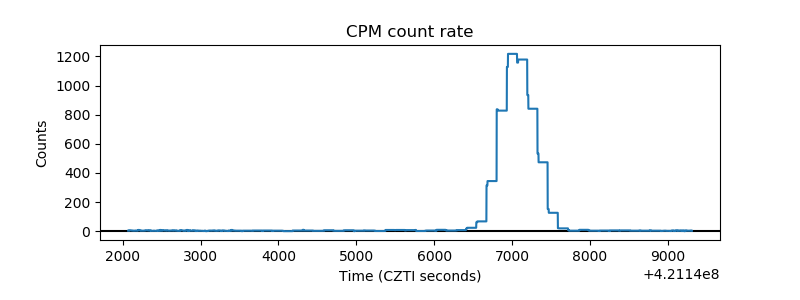 |
| CZT Counter | 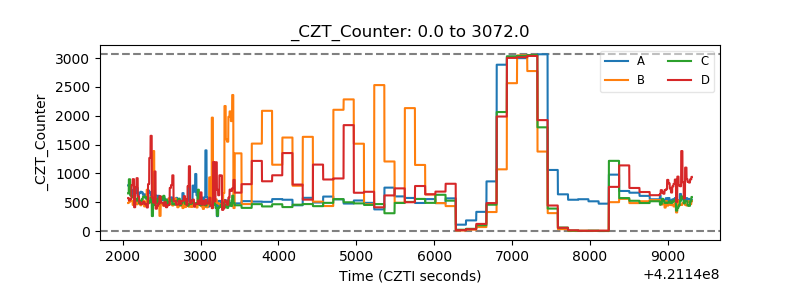 |
| +2.5 Volts monitor | 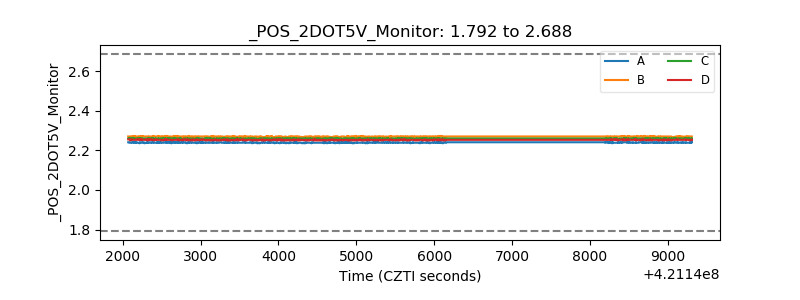 |
| +5 Volts monitor |  |
| _ROLL_ROT | 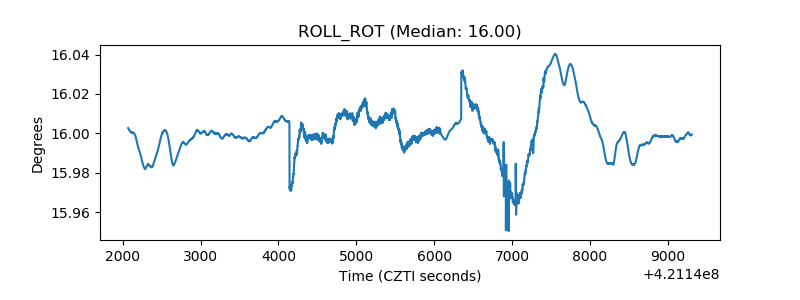 |
| _Roll_DEC | 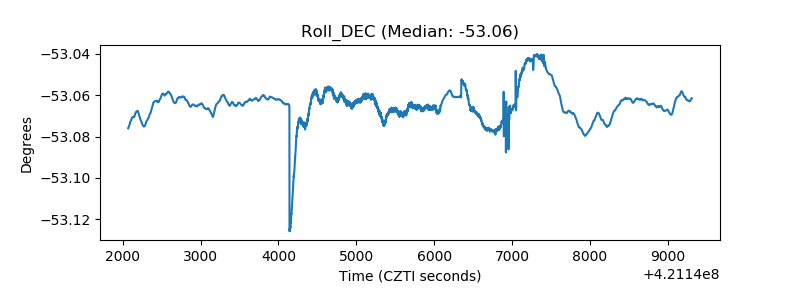 |
| _Roll_RA | 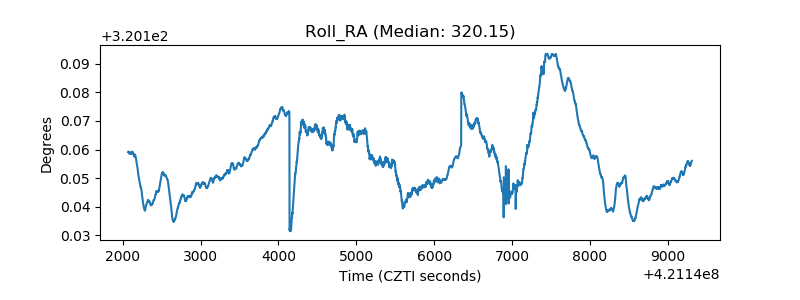 |
| Veto Counter | 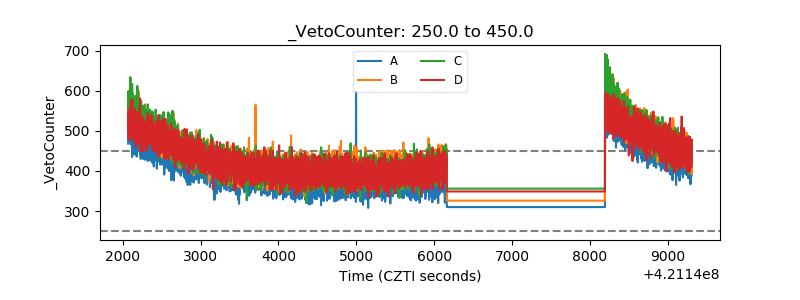 |