| Param | Original file | Final file |
|---|---|---|
| Filename | modeM0/AS1A12_052T04_9000005602_41127cztM0_level2.fits | modeM0/AS1A12_052T04_9000005602_41127cztM0_level2_quad_clean.evt |
| Size (bytes) | 363,185,280 | 92,488,320 |
| Size | 346.4 MB | 88.2 MB |
| Events in quadrant A | 2,849,284 | 638,770 |
| Events in quadrant B | 3,389,044 | 626,244 |
| Events in quadrant C | 2,594,452 | 616,058 |
| Events in quadrant D | 4,217,470 | 564,770 |
| Mode M0 | |||
|---|---|---|---|
| Quadrant | BADHDUFLAG | Total packets | Discarded packets |
| A | 0 | 11329 | 2 |
| B | 0 | 13206 | 1 |
| C | 0 | 10608 | 1 |
| D | 0 | 16263 | 1 |
| Mode M9 | |||
|---|---|---|---|
| Quadrant | BADHDUFLAG | Total packets | Discarded packets |
| A | 0 | 21 | 0 |
| B | 0 | 21 | 0 |
| C | 0 | 21 | 0 |
| D | 0 | 21 | 0 |
| Mode SS | |||
|---|---|---|---|
| Quadrant | BADHDUFLAG | Total packets | Discarded packets |
| A | 0 | 104 | 0 |
| B | 0 | 104 | 0 |
| C | 0 | 104 | 0 |
| D | 0 | 104 | 0 |
| Quadrant | Total seconds | Saturated seconds | Saturation percentage |
|---|---|---|---|
| A | 5061 | 8 | 0.158072% |
| B | 5061 | 251 | 4.959494% |
| C | 5061 | 30 | 0.592768% |
| D | 5061 | 170 | 3.359020% |
Noise dominated data is calculated using 1-second bins in cleaned event files. If a bin has >2000 counts, and if more than 50% of those come from <1% of pixels, then it is considered to be noise-dominated and hence unusable.
| Quadrant | # 1 sec bins | Bins with >0 counts | Bins with >2000 counts | High rate bins dominated by noise | Noise dominated (total time) | Noise dominated (detector-on time) | Marked lightcurve |
|---|---|---|---|---|---|---|---|
| A | 7184 | 5062 | 2 | 2 | 0.03% | 0.04% | 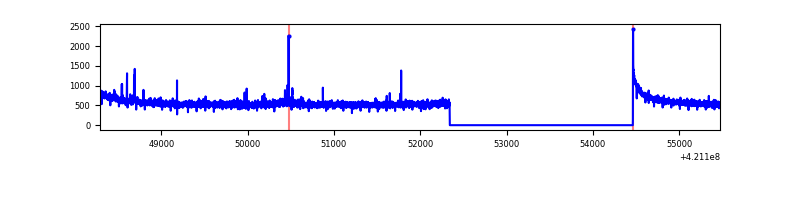 |
| B | 7184 | 5062 | 184 | 184 | 2.56% | 3.63% | 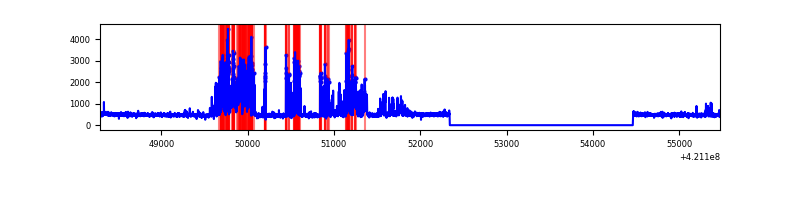 |
| C | 7184 | 5062 | 30 | 30 | 0.42% | 0.59% | 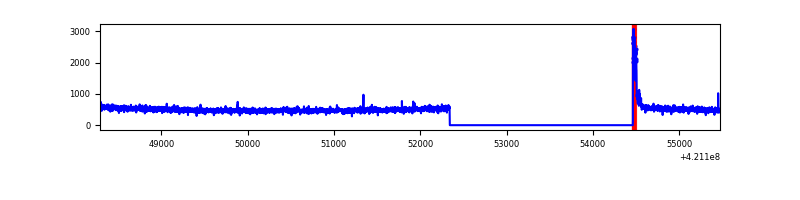 |
| D | 7184 | 5062 | 142 | 142 | 1.98% | 2.81% | 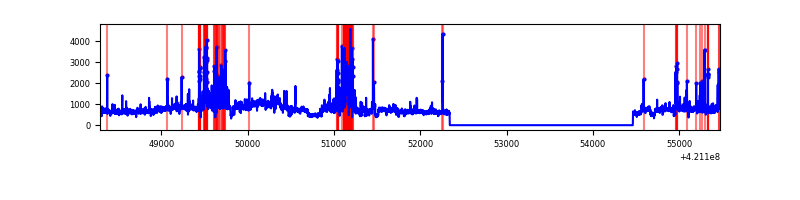 |
Top three noisy pixels from each quadrant. If the there are fewer than three noisy pixels in the level2.evt file, extra rows are filled as -1
| Pixel properties | Quadrant properties | ||||||
|---|---|---|---|---|---|---|---|
| Quadrant | DetID | PixID | Counts | Sigma | Mean | Median | Sigma |
| A | 10 | 83 | 453855 | 3662.49 | 608 | 596 | 123.8 |
| A | 2 | 79 | 24247 | 191.11 | 608 | 596 | 123.8 |
| A | 12 | 189 | 15374 | 119.41 | 608 | 596 | 123.8 |
| B | 0 | 245 | 958226 | 8572.69 | 585 | 570 | 111.7 |
| B | 0 | 186 | 101877 | 906.87 | 585 | 570 | 111.7 |
| B | 0 | 190 | 19458 | 169.08 | 585 | 570 | 111.7 |
| C | 15 | 214 | 217991 | 1637.25 | 580 | 585 | 132.8 |
| C | 0 | 10 | 94651 | 708.39 | 580 | 585 | 132.8 |
| C | 14 | 254 | 9939 | 70.44 | 580 | 585 | 132.8 |
| D | 2 | 16 | 1349844 | 9477.24 | 581 | 566 | 142.4 |
| D | 13 | 249 | 411513 | 2886.46 | 581 | 566 | 142.4 |
| D | 2 | 249 | 168943 | 1182.67 | 581 | 566 | 142.4 |
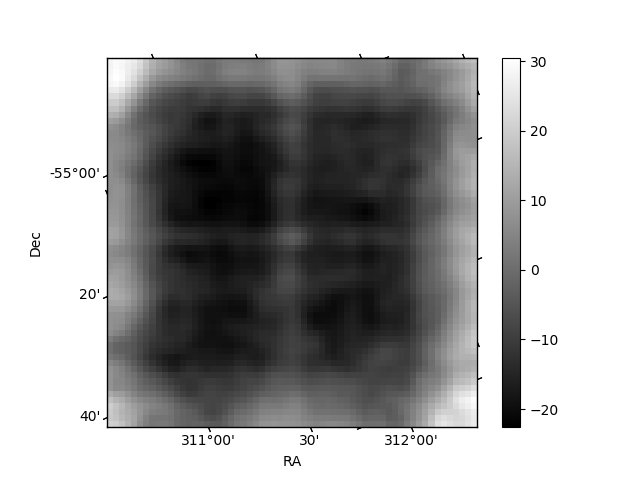
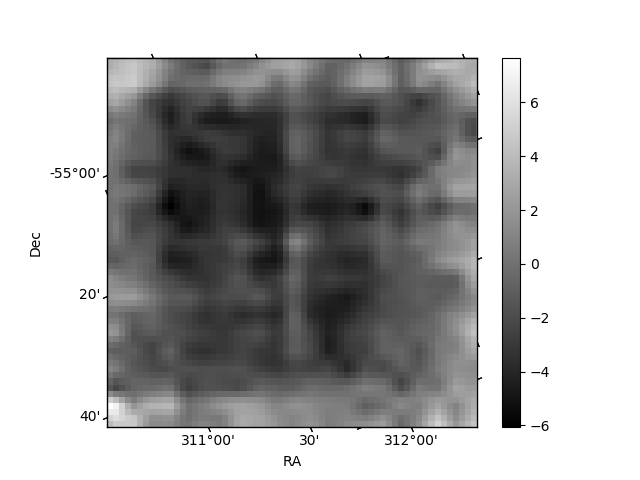
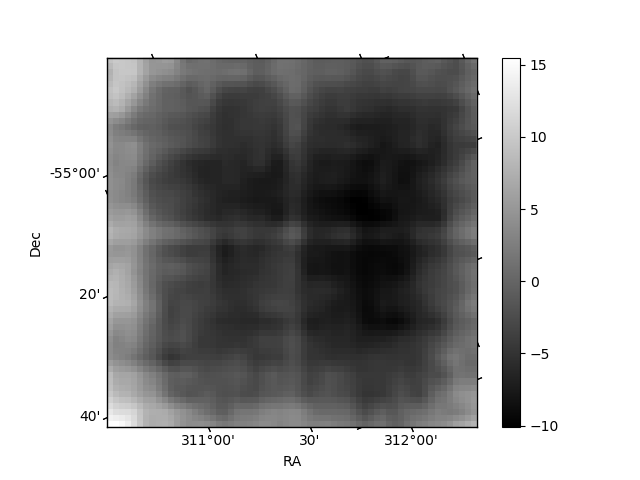
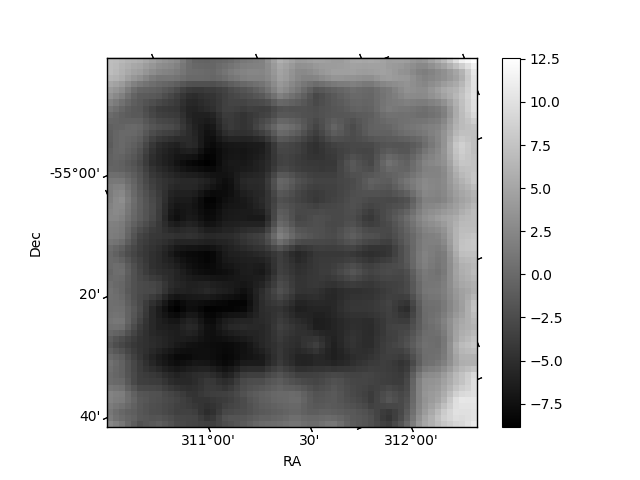
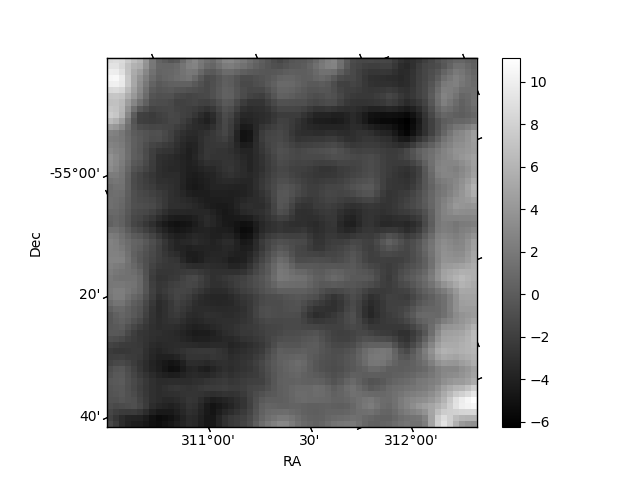
Histogram calculated using DETX and DETY for each event in the final _common_clean file
| Quadrant A | 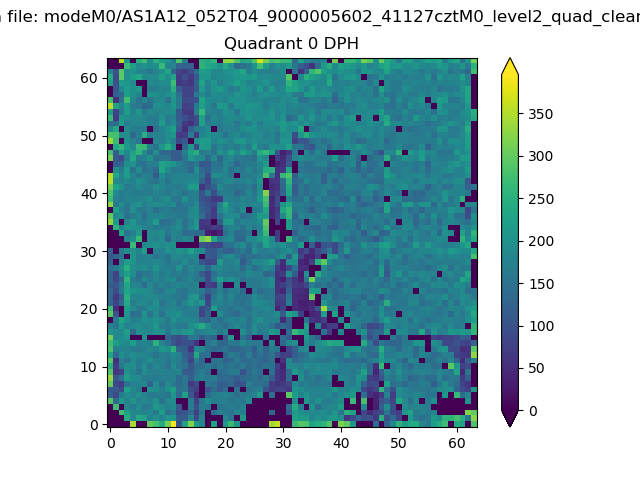 |
 |
Quadrant B |
|---|---|---|---|
| Quadrant D | 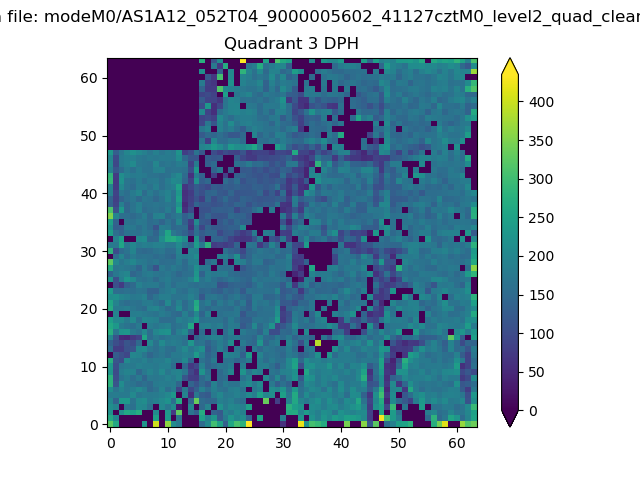 |
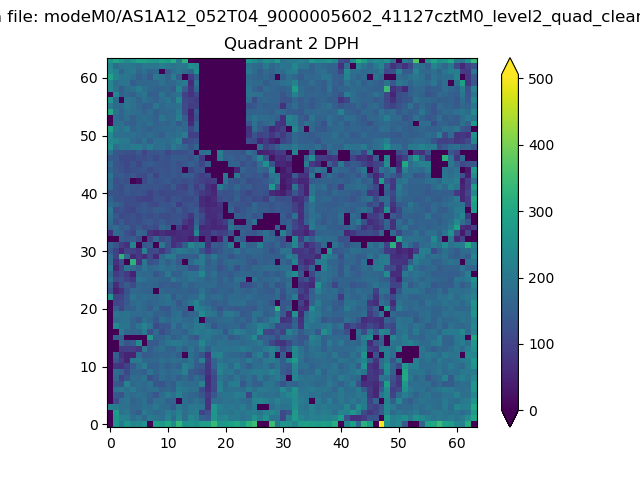 |
Quadrant C |
| Plot type | Count rate plots | Images |
|---|---|---|
| Comparison with Poisson distribution Blue bars denote a histogram of data divided into 1 sec bins. Red curve is a Poisson curve with rate = median count rate of data. |
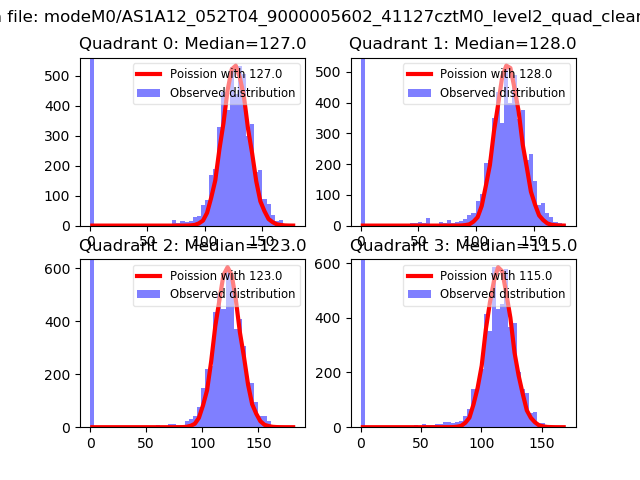 |
 |
| Quadrant-wise count rates Data is divided into 100 sec bins |
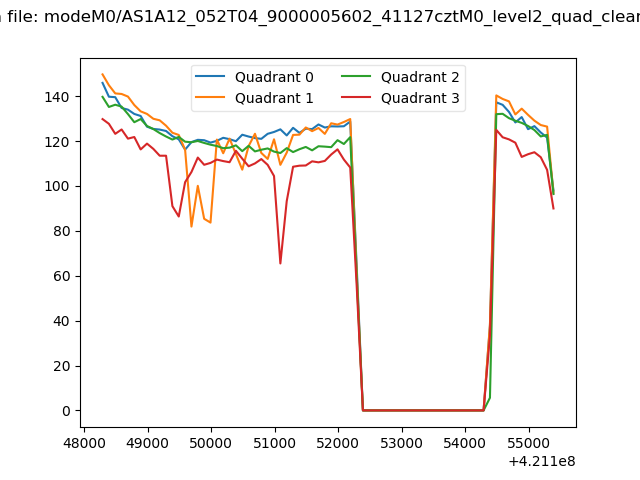 |
|
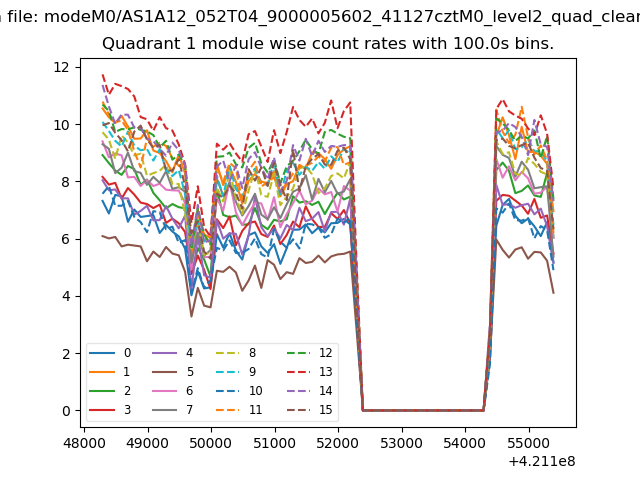
| Module-wise count rates for Quadrant A Data is divided into 100 sec bins |
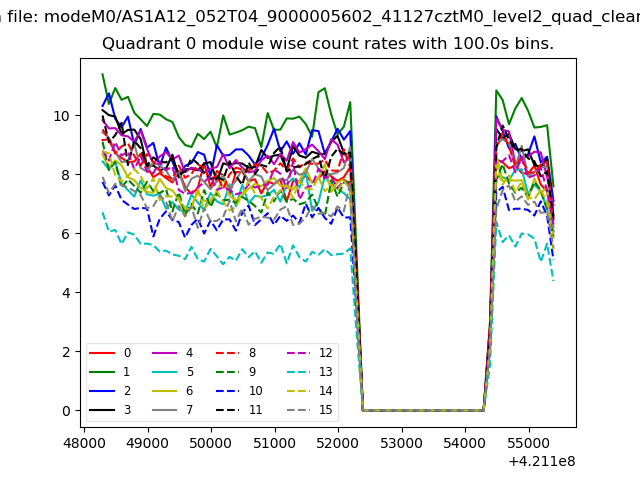 |
 |
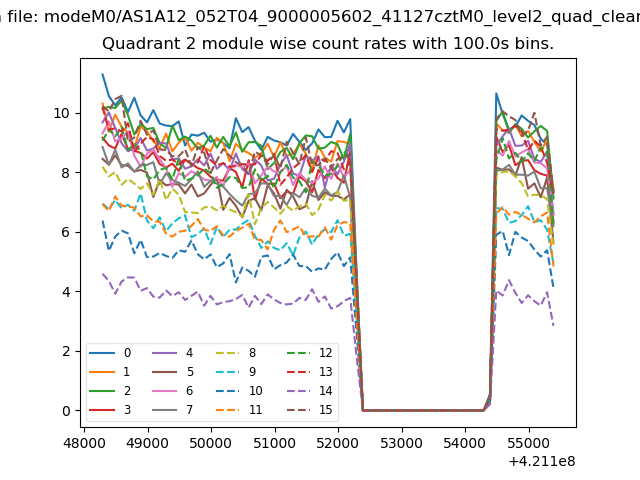
| Module-wise count rates for Quadrant B Data is divided into 100 sec bins |
 |
 |
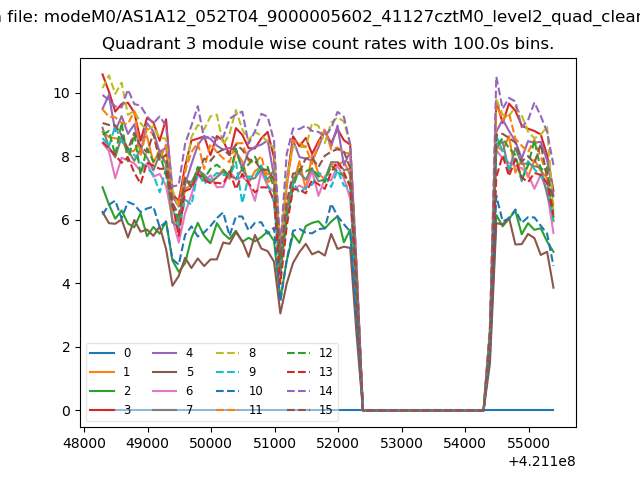
| Module-wise count rates for Quadrant C Data is divided into 100 sec bins |
 |
 |
| Module-wise count rates for Quadrant D Data is divided into 100 sec bins |
 |
 |
| Parameter | Plot |
|---|---|
| CZT HV Monitor |  |
| D_VDD | 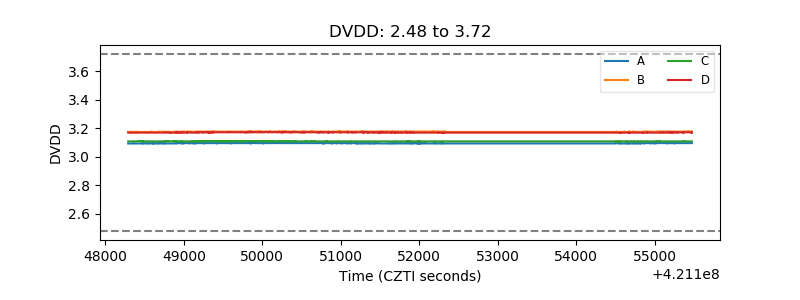 |
| Temperature 1 | 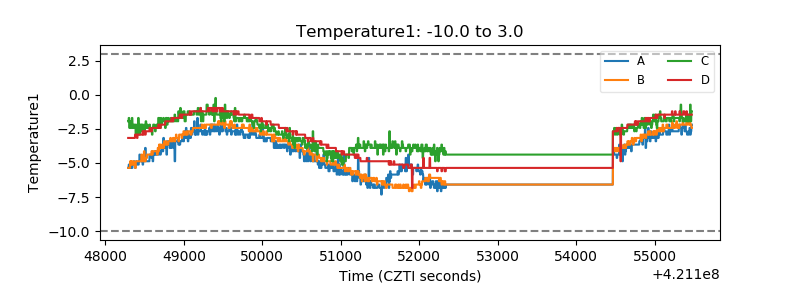 |
| Veto HV Monitor | 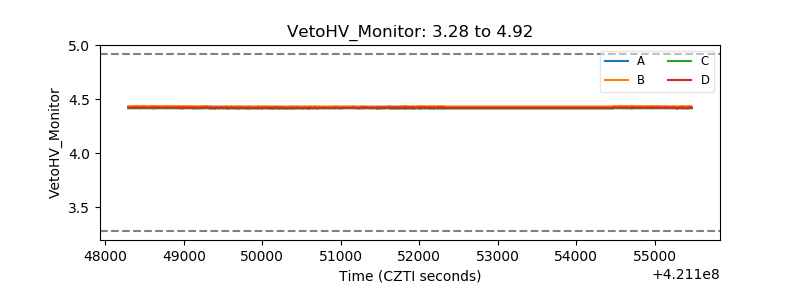 |
| Veto LLD | 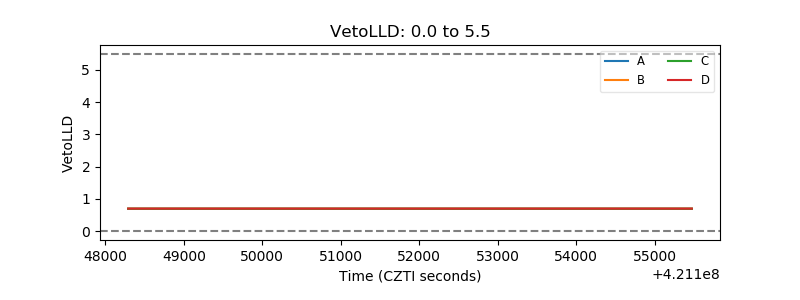 |
| Alpha Counter | 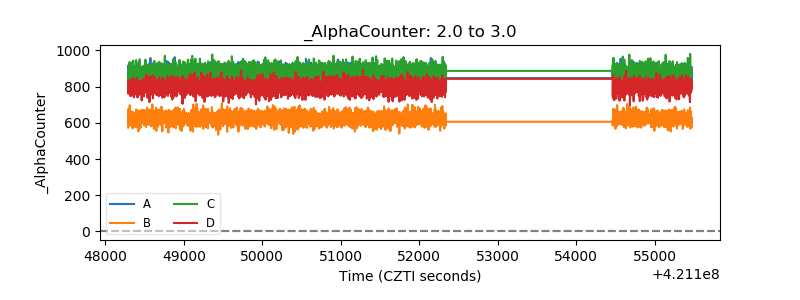 |
| _CPM_Rate | 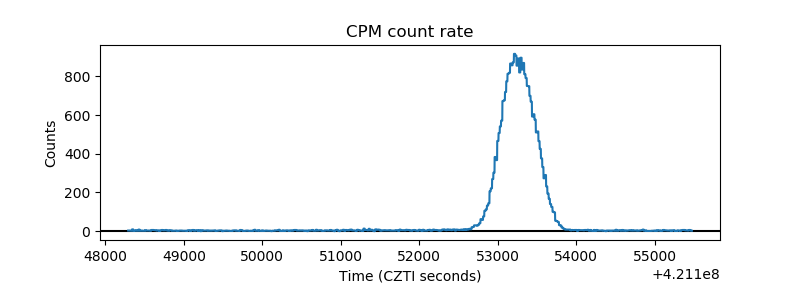 |
| CZT Counter | 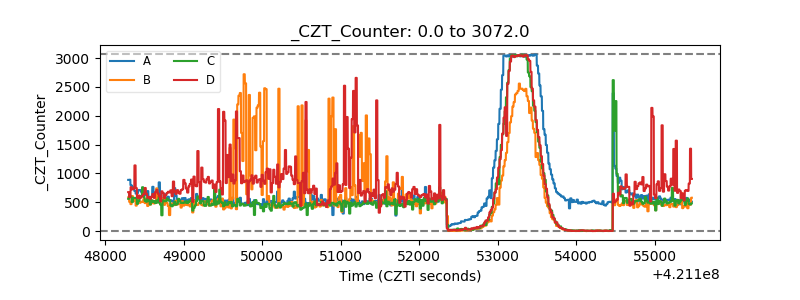 |
| +2.5 Volts monitor | 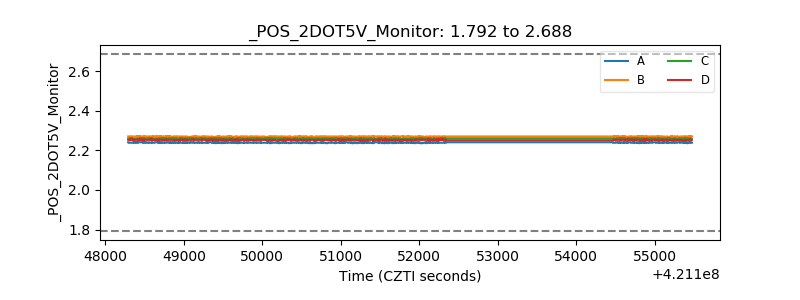 |
| +5 Volts monitor | 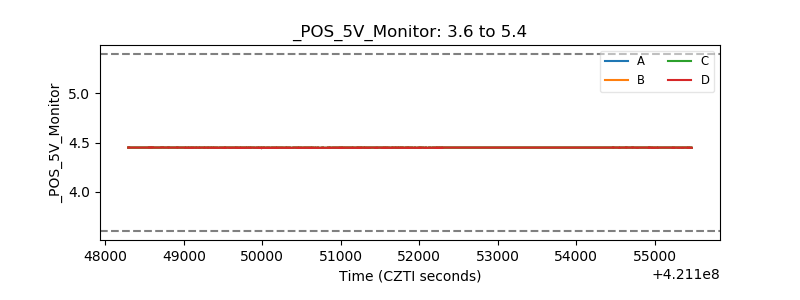 |
| _ROLL_ROT | 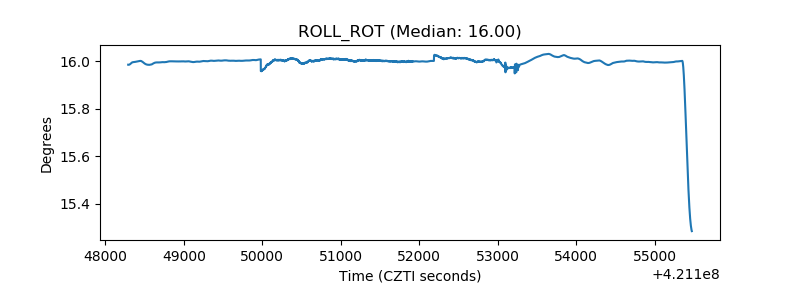 |
| _Roll_DEC | 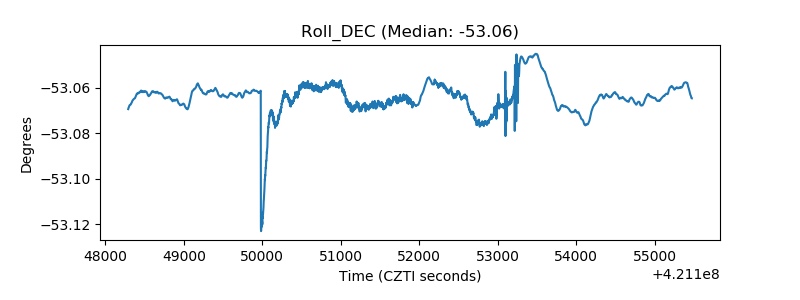 |
| _Roll_RA | 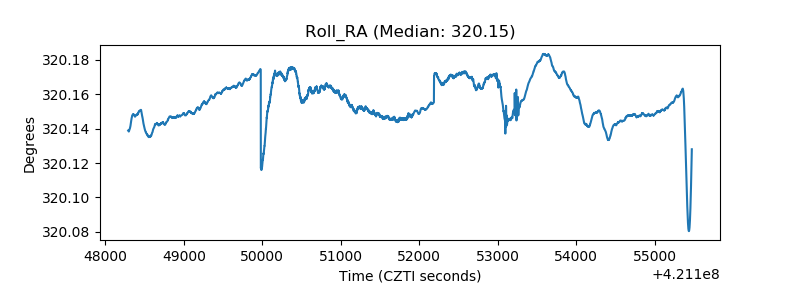 |
| Veto Counter | 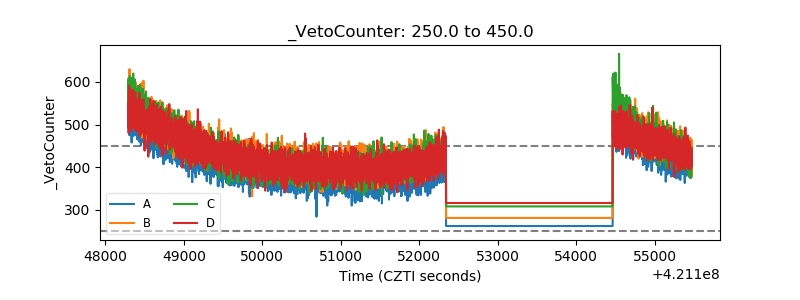 |