| Param | Original file | Final file |
|---|---|---|
| Filename | modeM0/AS1A12_052T04_9000005602_41128cztM0_level2.fits | modeM0/AS1A12_052T04_9000005602_41128cztM0_level2_quad_clean.evt |
| Size (bytes) | 347,921,280 | 92,836,800 |
| Size | 331.8 MB | 88.5 MB |
| Events in quadrant A | 2,865,768 | 635,224 |
| Events in quadrant B | 2,711,583 | 639,335 |
| Events in quadrant C | 2,787,114 | 607,249 |
| Events in quadrant D | 4,110,153 | 565,534 |
| Mode M0 | |||
|---|---|---|---|
| Quadrant | BADHDUFLAG | Total packets | Discarded packets |
| A | 0 | 11481 | 3 |
| B | 0 | 11339 | 2 |
| C | 0 | 11382 | 2 |
| D | 0 | 15855 | 2 |
| Mode M9 | |||
|---|---|---|---|
| Quadrant | BADHDUFLAG | Total packets | Discarded packets |
| A | 0 | 29 | 0 |
| B | 0 | 29 | 0 |
| C | 0 | 29 | 0 |
| D | 0 | 30 | 0 |
| Mode SS | |||
|---|---|---|---|
| Quadrant | BADHDUFLAG | Total packets | Discarded packets |
| A | 0 | 106 | 0 |
| B | 0 | 106 | 0 |
| C | 0 | 106 | 0 |
| D | 0 | 106 | 0 |
| Quadrant | Total seconds | Saturated seconds | Saturation percentage |
|---|---|---|---|
| A | 5194 | 14 | 0.269542% |
| B | 5194 | 36 | 0.693107% |
| C | 5194 | 63 | 1.212938% |
| D | 5194 | 137 | 2.637659% |
Noise dominated data is calculated using 1-second bins in cleaned event files. If a bin has >2000 counts, and if more than 50% of those come from <1% of pixels, then it is considered to be noise-dominated and hence unusable.
| Quadrant | # 1 sec bins | Bins with >0 counts | Bins with >2000 counts | High rate bins dominated by noise | Noise dominated (total time) | Noise dominated (detector-on time) | Marked lightcurve |
|---|---|---|---|---|---|---|---|
| A | 7346 | 5195 | 2 | 2 | 0.03% | 0.04% | 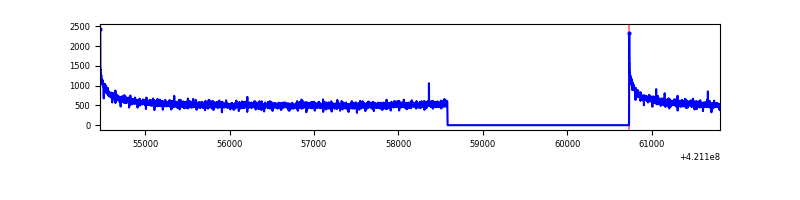 |
| B | 7346 | 5195 | 16 | 16 | 0.22% | 0.31% | 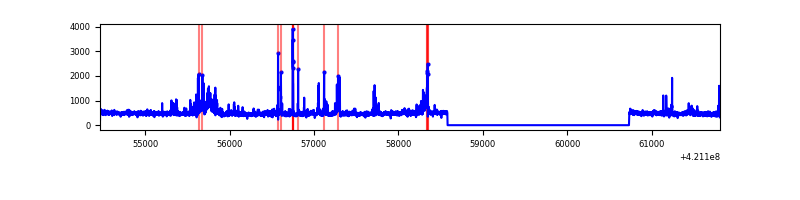 |
| C | 7346 | 5195 | 64 | 64 | 0.87% | 1.23% | 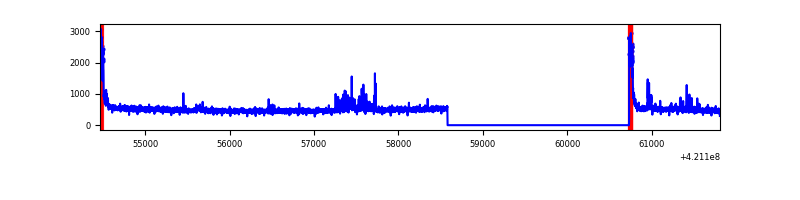 |
| D | 7346 | 5195 | 119 | 119 | 1.62% | 2.29% | 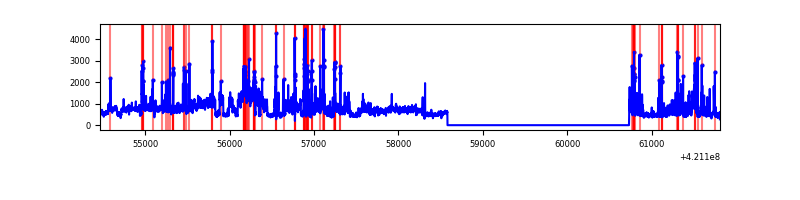 |
Top three noisy pixels from each quadrant. If the there are fewer than three noisy pixels in the level2.evt file, extra rows are filled as -1
| Pixel properties | Quadrant properties | ||||||
|---|---|---|---|---|---|---|---|
| Quadrant | DetID | PixID | Counts | Sigma | Mean | Median | Sigma |
| A | 10 | 83 | 513082 | 4184.64 | 606 | 596 | 122.5 |
| A | 13 | 254 | 9126 | 69.65 | 606 | 596 | 122.5 |
| A | 3 | 137 | 6460 | 47.88 | 606 | 596 | 122.5 |
| B | 0 | 245 | 165773 | 1456.76 | 595 | 581 | 113.4 |
| B | 0 | 186 | 77465 | 678.01 | 595 | 581 | 113.4 |
| B | 4 | 81 | 48079 | 418.87 | 595 | 581 | 113.4 |
| C | 15 | 214 | 223898 | 1655.82 | 578 | 581 | 134.9 |
| C | 0 | 10 | 188564 | 1393.83 | 578 | 581 | 134.9 |
| C | 14 | 254 | 112950 | 833.18 | 578 | 581 | 134.9 |
| D | 2 | 16 | 1151265 | 8132.66 | 583 | 566 | 141.5 |
| D | 13 | 249 | 335043 | 2363.94 | 583 | 566 | 141.5 |
| D | 2 | 249 | 181262 | 1277.08 | 583 | 566 | 141.5 |
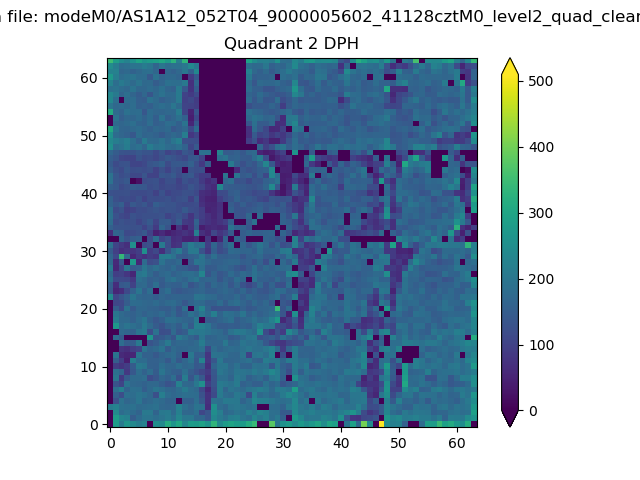
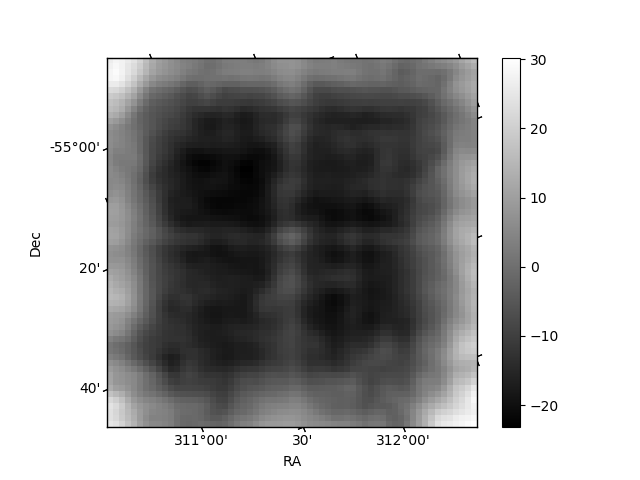
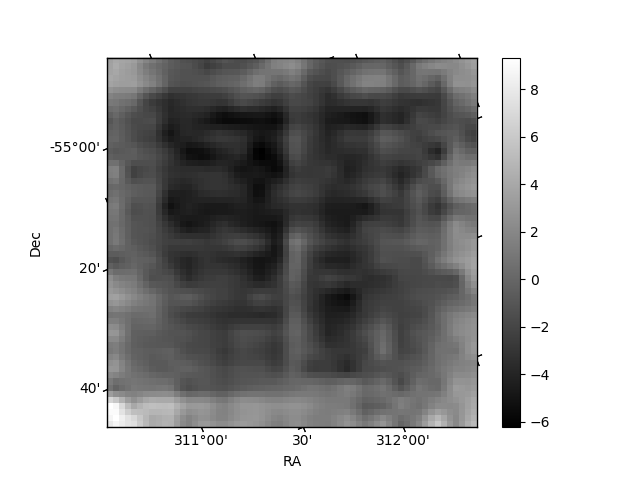
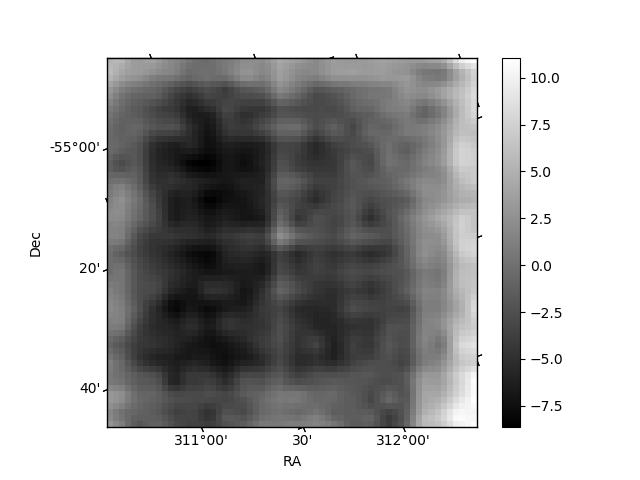
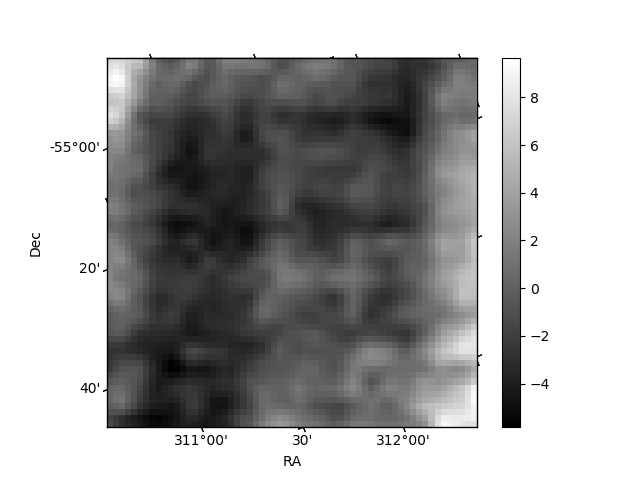
Histogram calculated using DETX and DETY for each event in the final _common_clean file
| Quadrant A | 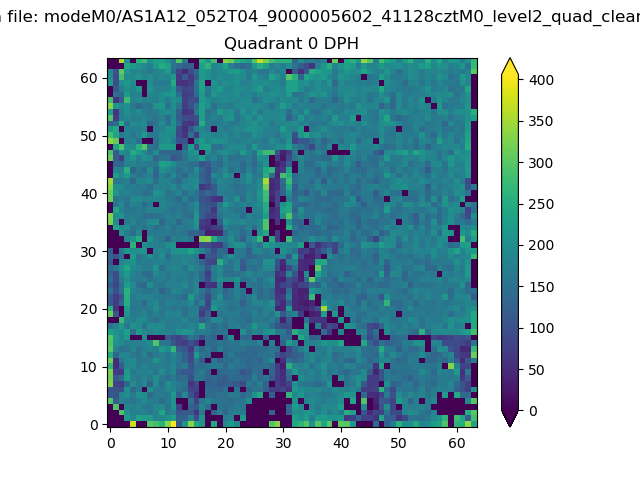 |
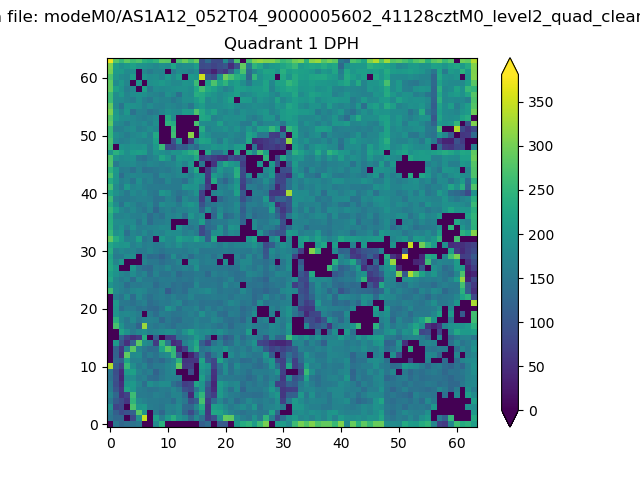 |
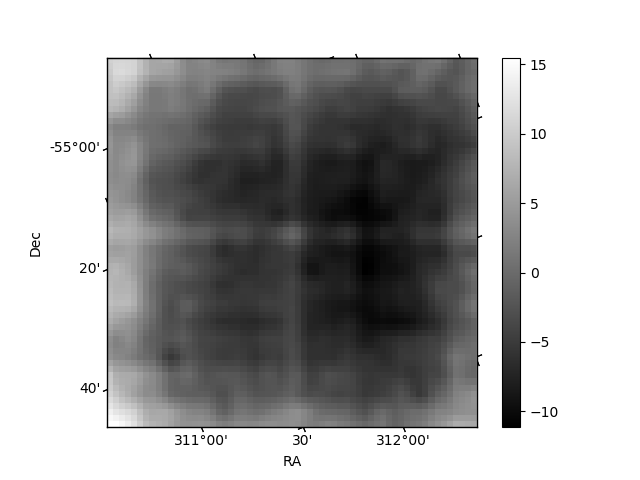
Quadrant B |
|---|---|---|---|
| Quadrant D | 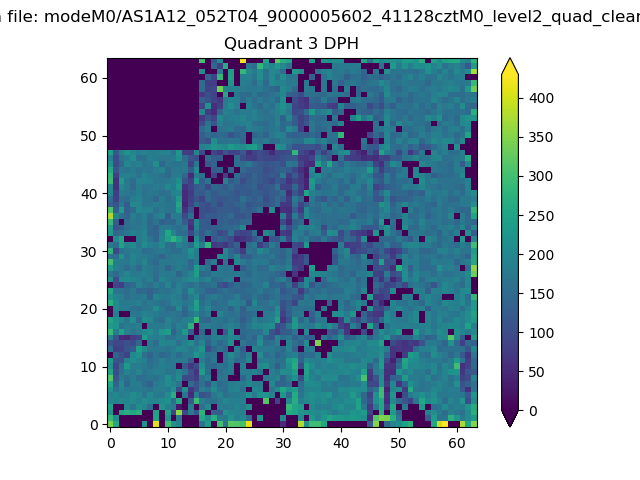 |
 |
Quadrant C |
| Plot type | Count rate plots | Images |
|---|---|---|
| Comparison with Poisson distribution Blue bars denote a histogram of data divided into 1 sec bins. Red curve is a Poisson curve with rate = median count rate of data. |
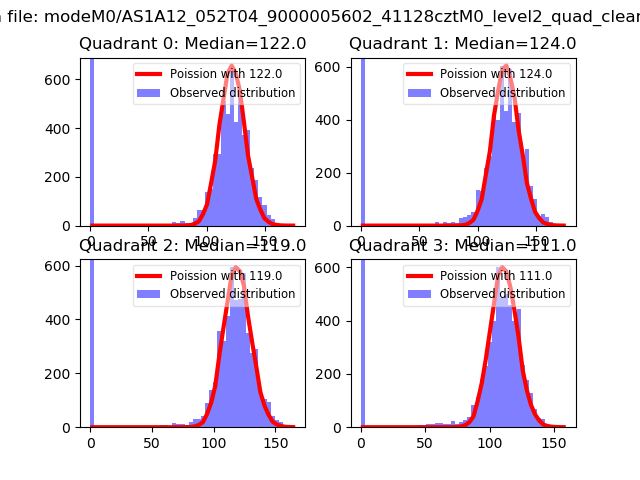 |
 |
| Quadrant-wise count rates Data is divided into 100 sec bins |
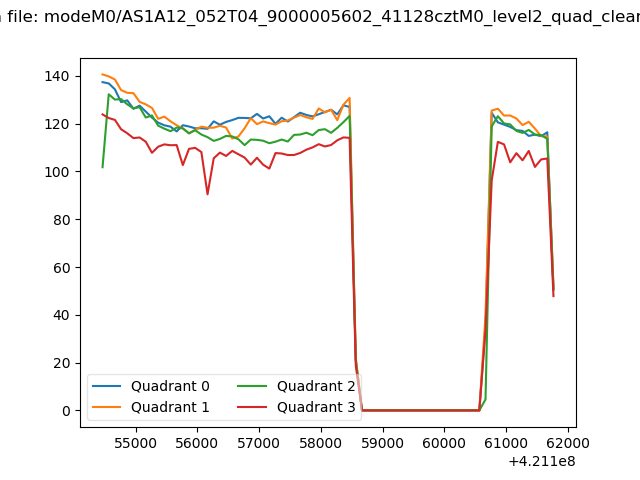 |
|
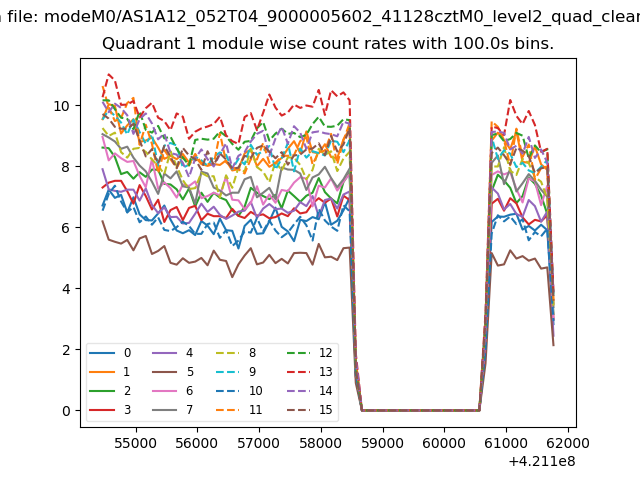
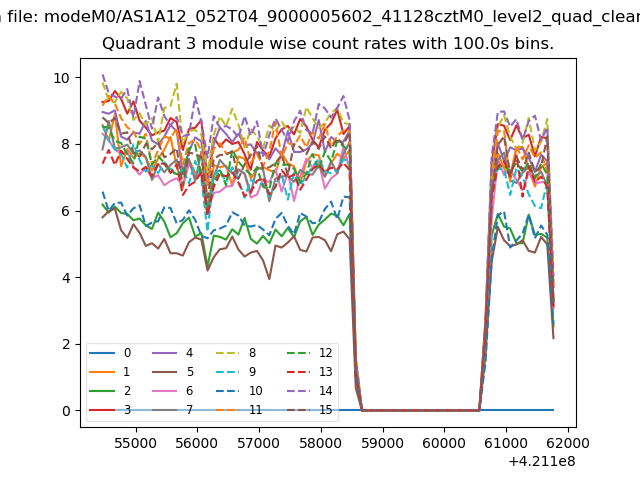
| Module-wise count rates for Quadrant A Data is divided into 100 sec bins |
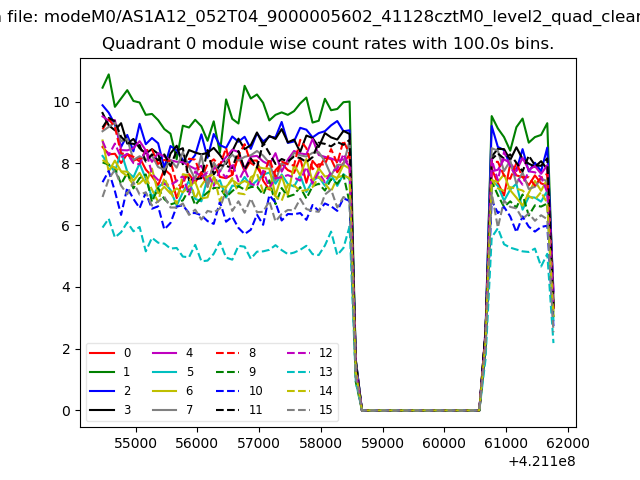 |
 |
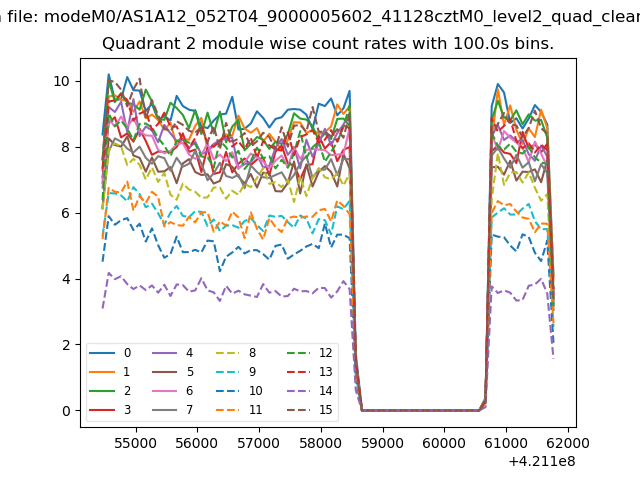
| Module-wise count rates for Quadrant B Data is divided into 100 sec bins |
 |
 |
| Module-wise count rates for Quadrant C Data is divided into 100 sec bins |
 |
 |
| Module-wise count rates for Quadrant D Data is divided into 100 sec bins |
 |
 |
| Parameter | Plot |
|---|---|
| CZT HV Monitor | 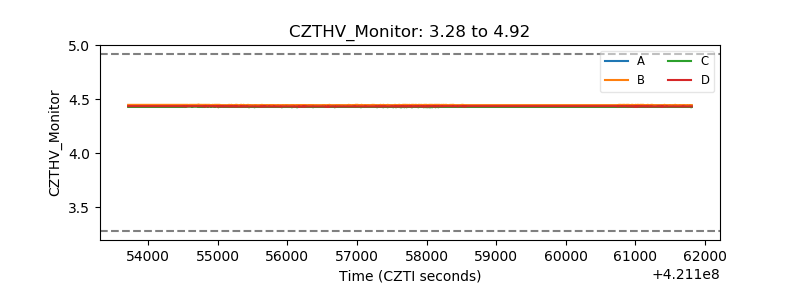 |
| D_VDD | 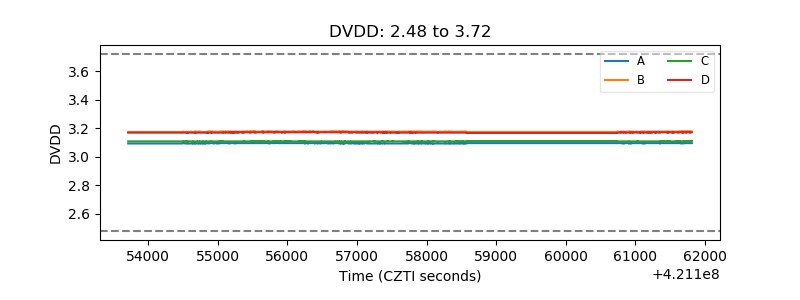 |
| Temperature 1 | 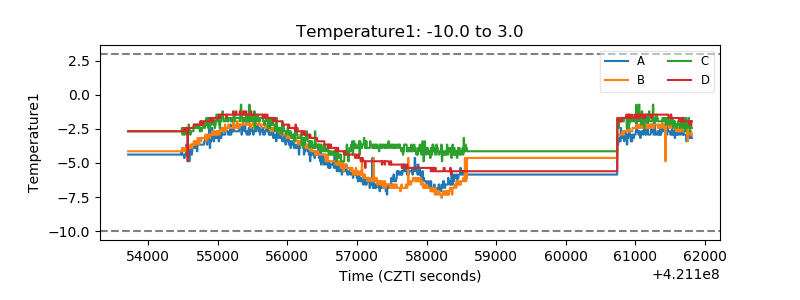 |
| Veto HV Monitor | 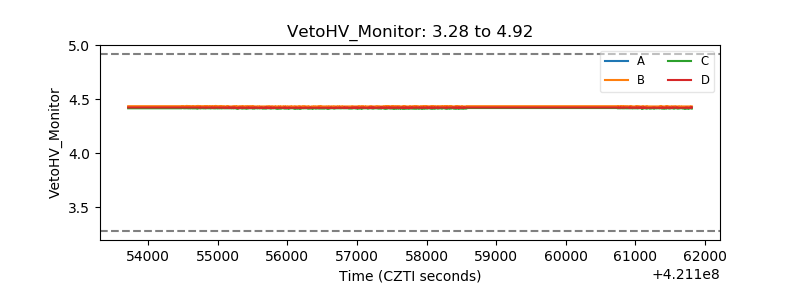 |
| Veto LLD | 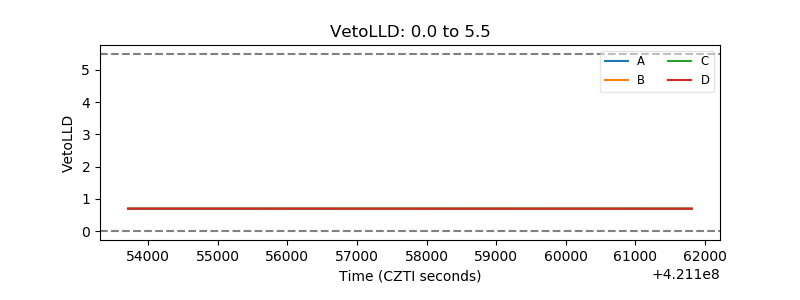 |
| Alpha Counter | 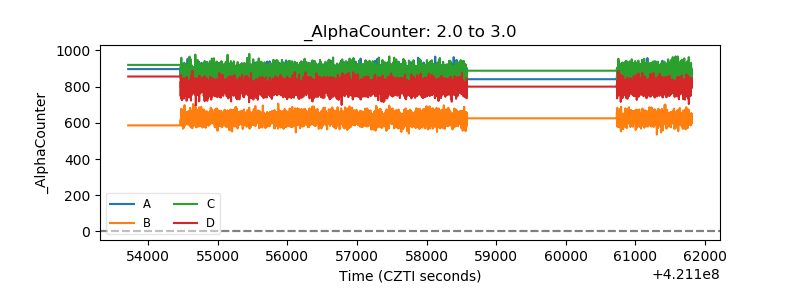 |
| _CPM_Rate | 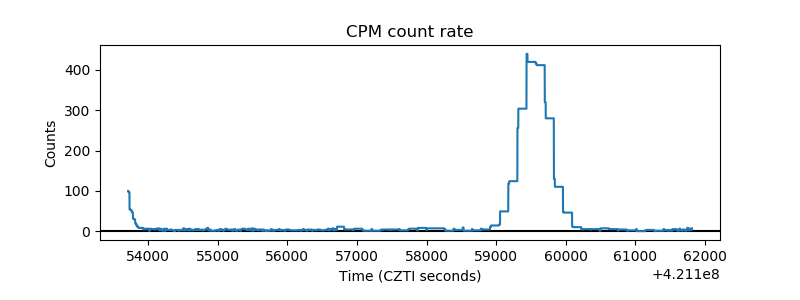 |
| CZT Counter | 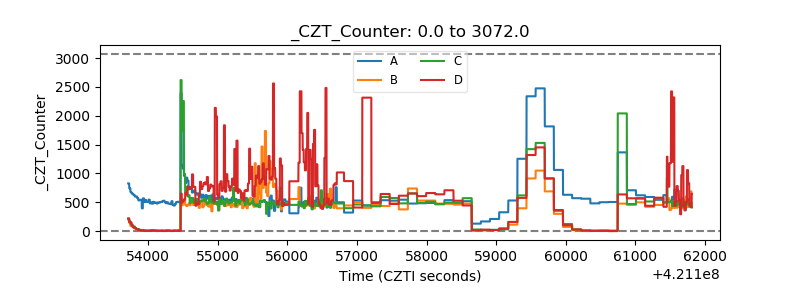 |
| +2.5 Volts monitor | 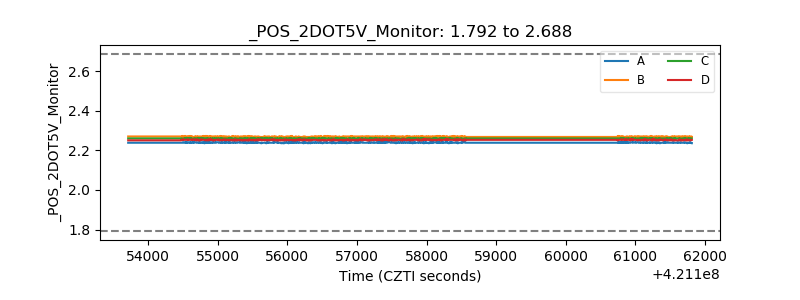 |
| +5 Volts monitor |  |
| _ROLL_ROT | 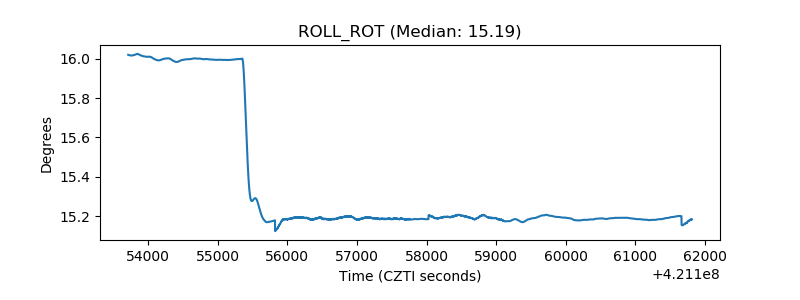 |
| _Roll_DEC | 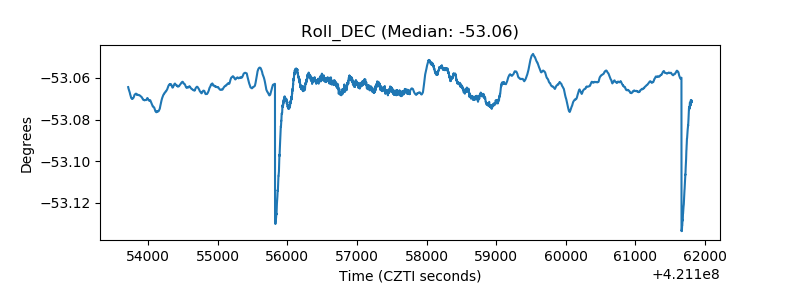 |
| _Roll_RA | 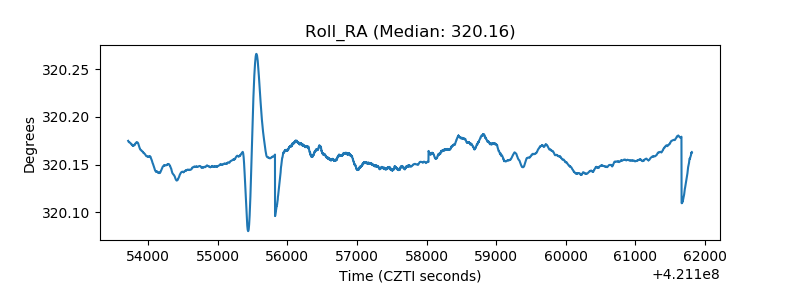 |
| Veto Counter | 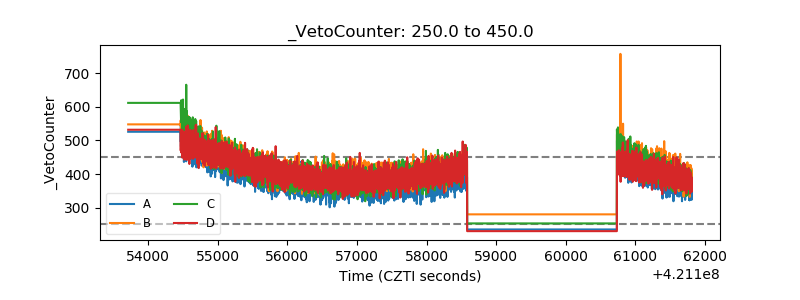 |