| Param | Original file | Final file |
|---|---|---|
| Filename | modeM0/AS1A12_052T04_9000005602_41129cztM0_level2.fits | modeM0/AS1A12_052T04_9000005602_41129cztM0_level2_quad_clean.evt |
| Size (bytes) | 357,554,880 | 87,618,240 |
| Size | 341.0 MB | 83.6 MB |
| Events in quadrant A | 2,814,399 | 604,738 |
| Events in quadrant B | 3,323,047 | 582,701 |
| Events in quadrant C | 2,897,091 | 571,190 |
| Events in quadrant D | 3,798,468 | 532,102 |
| Mode M0 | |||
|---|---|---|---|
| Quadrant | BADHDUFLAG | Total packets | Discarded packets |
| A | 0 | 11405 | 3 |
| B | 0 | 13295 | 2 |
| C | 0 | 11820 | 2 |
| D | 0 | 14883 | 2 |
| Mode M9 | |||
|---|---|---|---|
| Quadrant | BADHDUFLAG | Total packets | Discarded packets |
| A | 0 | 24 | 0 |
| B | 0 | 24 | 0 |
| C | 0 | 24 | 0 |
| D | 0 | 25 | 0 |
| Mode SS | |||
|---|---|---|---|
| Quadrant | BADHDUFLAG | Total packets | Discarded packets |
| A | 0 | 106 | 0 |
| B | 0 | 106 | 0 |
| C | 0 | 106 | 0 |
| D | 0 | 106 | 0 |
| Quadrant | Total seconds | Saturated seconds | Saturation percentage |
|---|---|---|---|
| A | 5171 | 18 | 0.348095% |
| B | 5171 | 307 | 5.936956% |
| C | 5171 | 111 | 2.146587% |
| D | 5171 | 216 | 4.177142% |
Noise dominated data is calculated using 1-second bins in cleaned event files. If a bin has >2000 counts, and if more than 50% of those come from <1% of pixels, then it is considered to be noise-dominated and hence unusable.
| Quadrant | # 1 sec bins | Bins with >0 counts | Bins with >2000 counts | High rate bins dominated by noise | Noise dominated (total time) | Noise dominated (detector-on time) | Marked lightcurve |
|---|---|---|---|---|---|---|---|
| A | 7206 | 5172 | 2 | 2 | 0.03% | 0.04% | 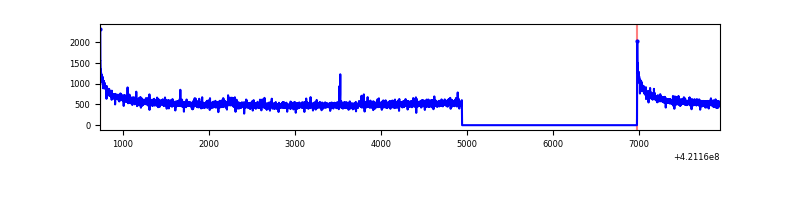 |
| B | 7206 | 5172 | 244 | 244 | 3.39% | 4.72% | 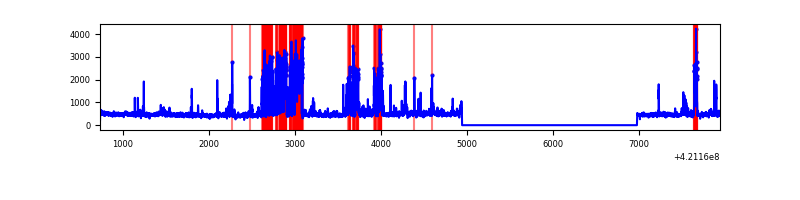 |
| C | 7206 | 5172 | 97 | 97 | 1.35% | 1.88% | 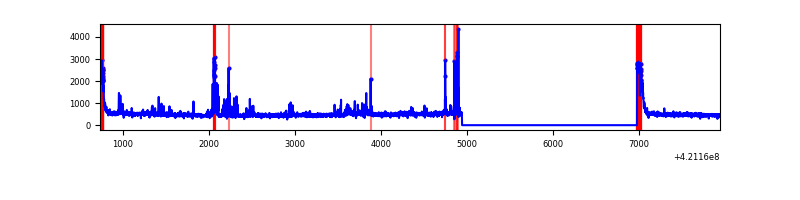 |
| D | 7206 | 5172 | 182 | 182 | 2.53% | 3.52% | 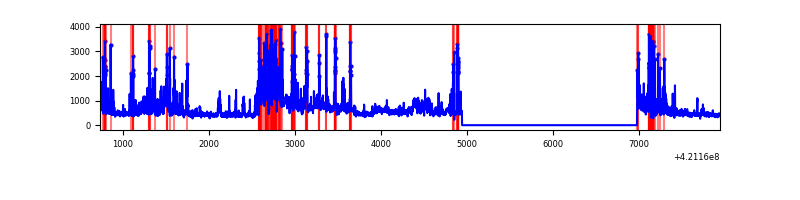 |
Top three noisy pixels from each quadrant. If the there are fewer than three noisy pixels in the level2.evt file, extra rows are filled as -1
| Pixel properties | Quadrant properties | ||||||
|---|---|---|---|---|---|---|---|
| Quadrant | DetID | PixID | Counts | Sigma | Mean | Median | Sigma |
| A | 10 | 83 | 518398 | 4343.54 | 584 | 572 | 119.2 |
| A | 12 | 189 | 26850 | 220.42 | 584 | 572 | 119.2 |
| A | 15 | 235 | 9606 | 75.78 | 584 | 572 | 119.2 |
| B | 0 | 245 | 987374 | 9098.43 | 566 | 551 | 108.5 |
| B | 0 | 190 | 42160 | 383.63 | 566 | 551 | 108.5 |
| B | 5 | 255 | 34139 | 309.68 | 566 | 551 | 108.5 |
| C | 14 | 254 | 251320 | 1923.12 | 556 | 560 | 130.4 |
| C | 0 | 10 | 246044 | 1882.65 | 556 | 560 | 130.4 |
| C | 15 | 214 | 220501 | 1686.76 | 556 | 560 | 130.4 |
| D | 2 | 16 | 728514 | 5355.48 | 557 | 542 | 135.9 |
| D | 13 | 249 | 416444 | 3059.67 | 557 | 542 | 135.9 |
| D | 2 | 249 | 401353 | 2948.65 | 557 | 542 | 135.9 |
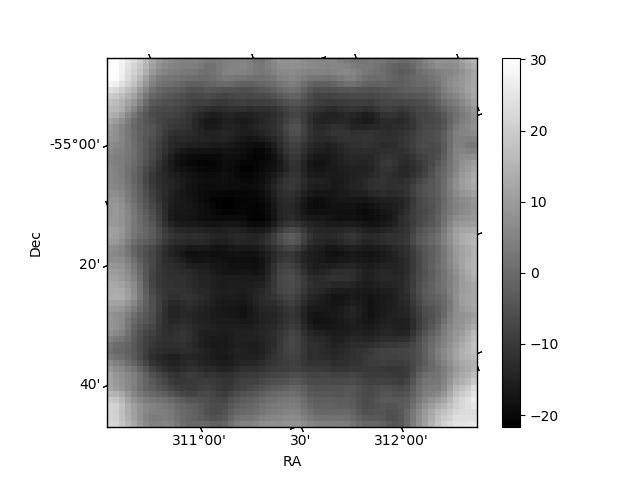
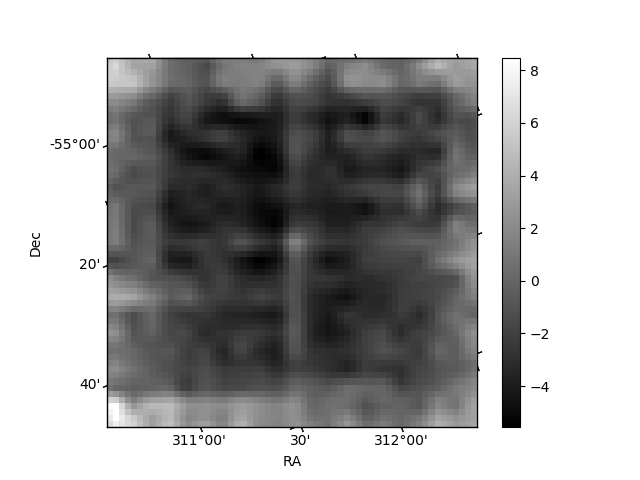
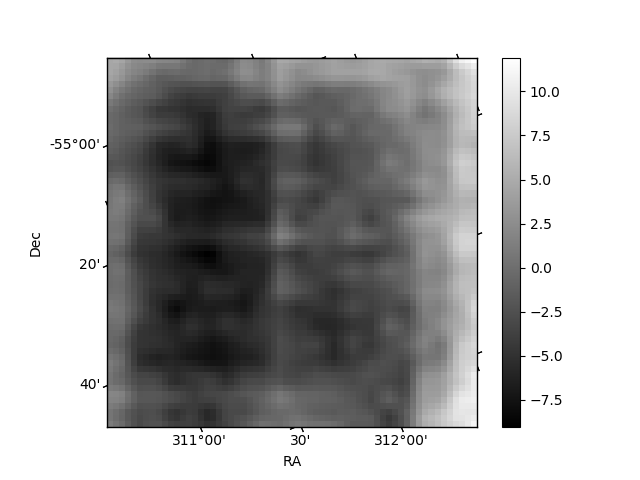
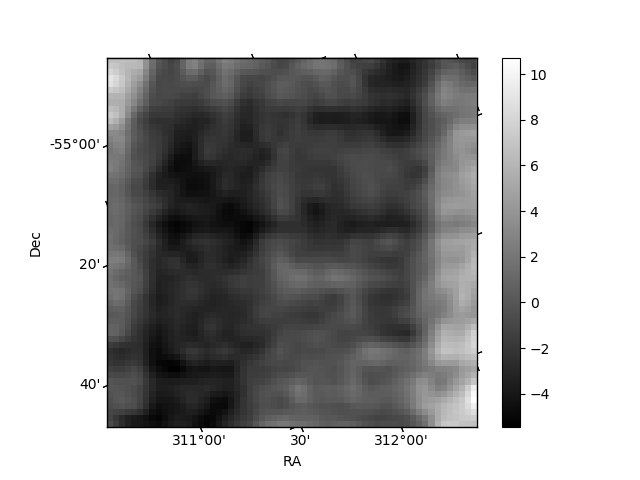
Histogram calculated using DETX and DETY for each event in the final _common_clean file
| Quadrant A | 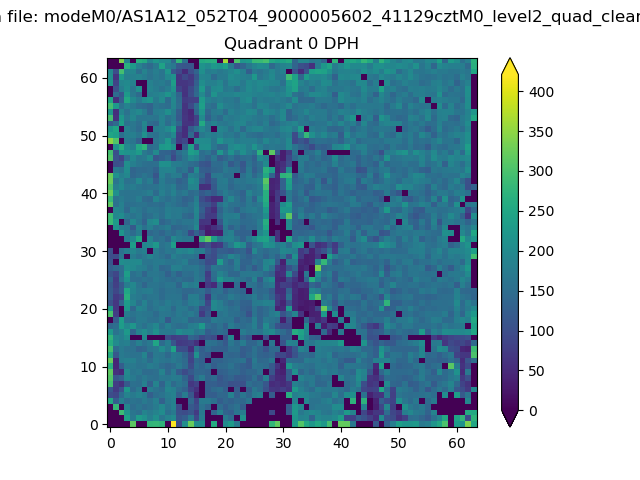 |
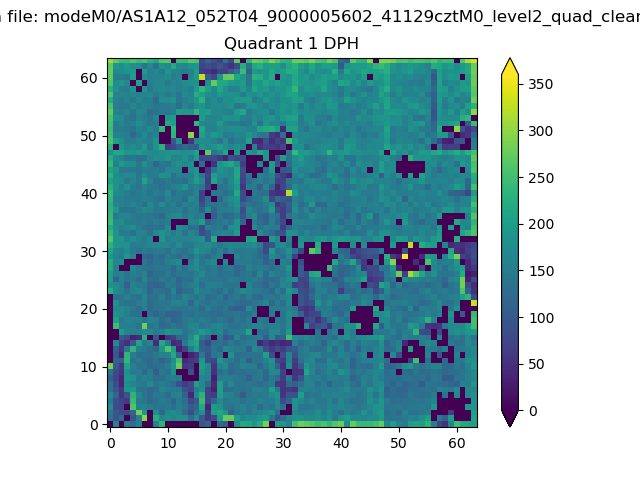 |
Quadrant B |
|---|---|---|---|
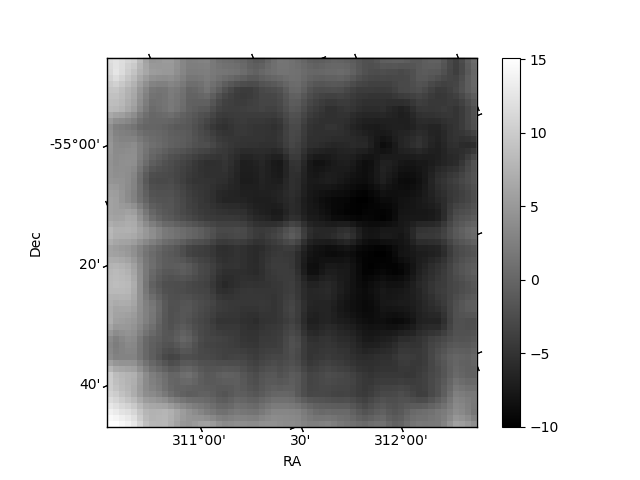
| Quadrant D | 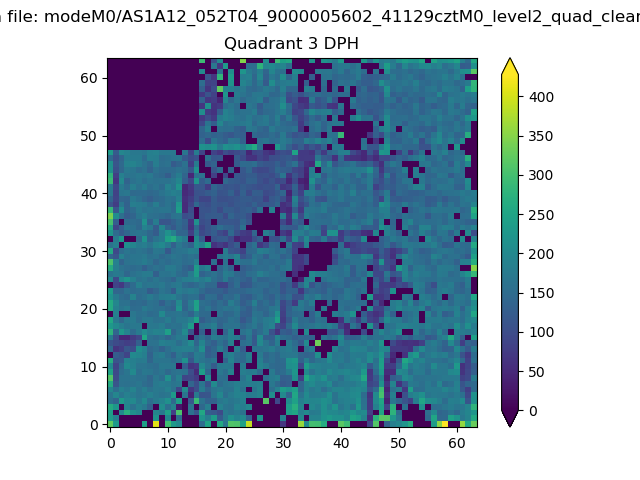 |
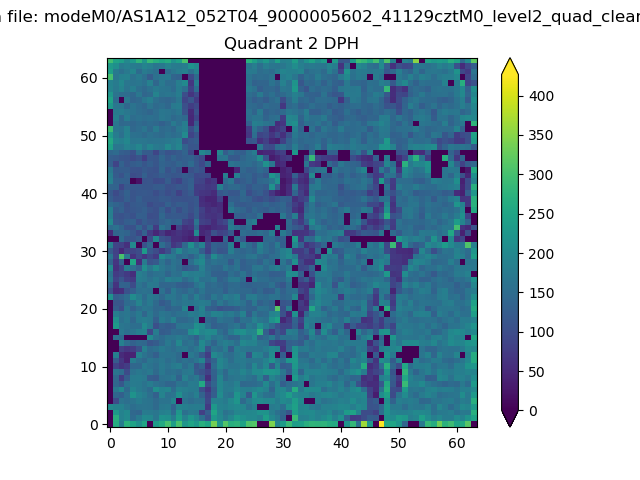 |
Quadrant C |
| Plot type | Count rate plots | Images |
|---|---|---|
| Comparison with Poisson distribution Blue bars denote a histogram of data divided into 1 sec bins. Red curve is a Poisson curve with rate = median count rate of data. |
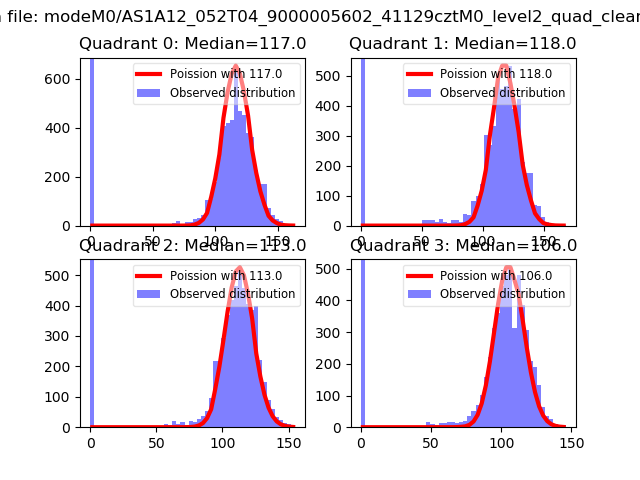 |
 |
| Quadrant-wise count rates Data is divided into 100 sec bins |
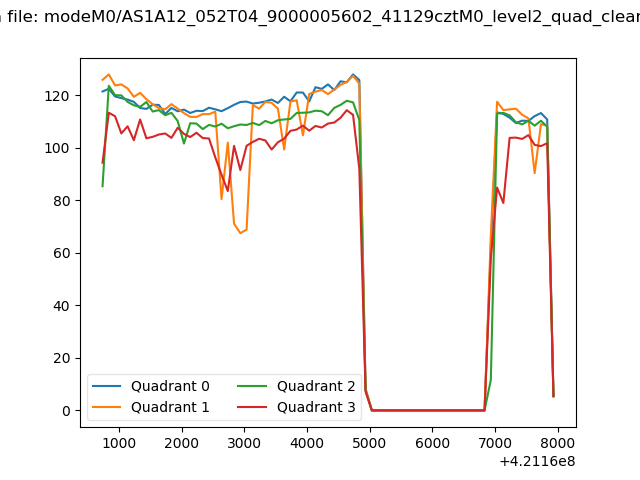 |
|
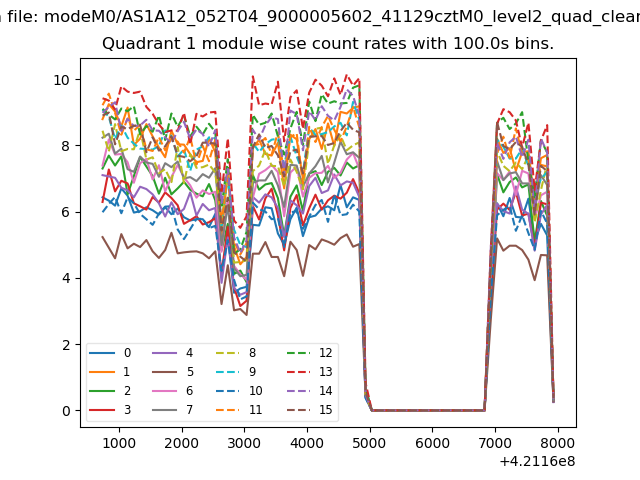
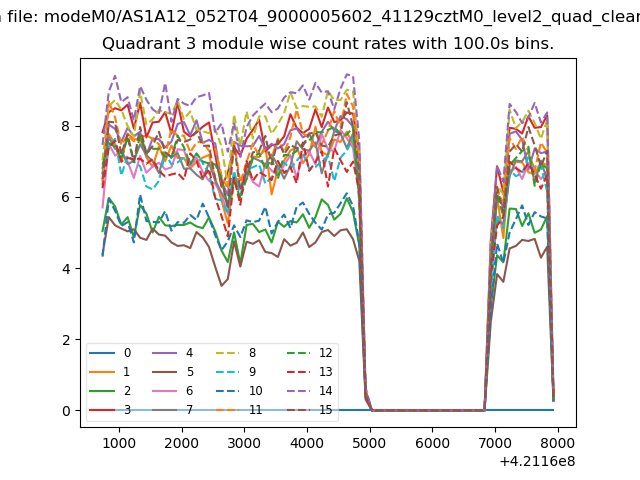
| Module-wise count rates for Quadrant A Data is divided into 100 sec bins |
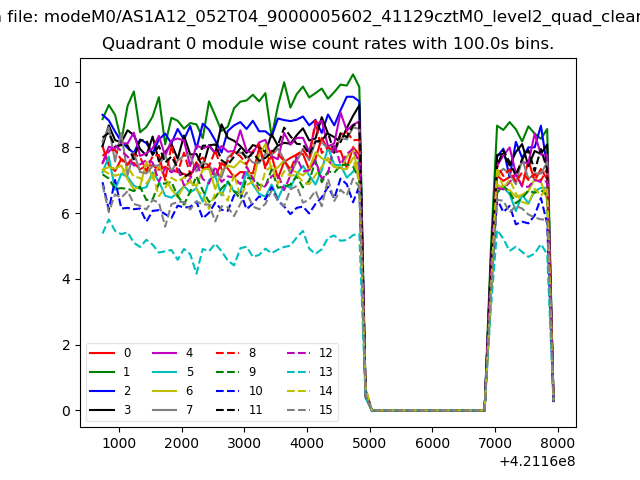 |
 |
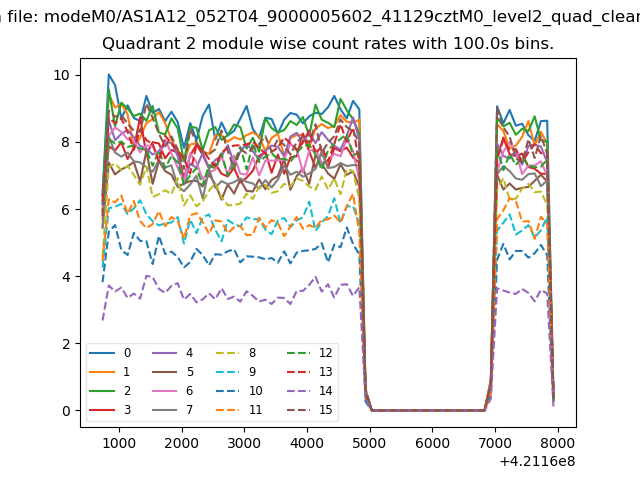
| Module-wise count rates for Quadrant B Data is divided into 100 sec bins |
 |
 |
| Module-wise count rates for Quadrant C Data is divided into 100 sec bins |
 |
 |
| Module-wise count rates for Quadrant D Data is divided into 100 sec bins |
 |
 |
| Parameter | Plot |
|---|---|
| CZT HV Monitor |  |
| D_VDD | 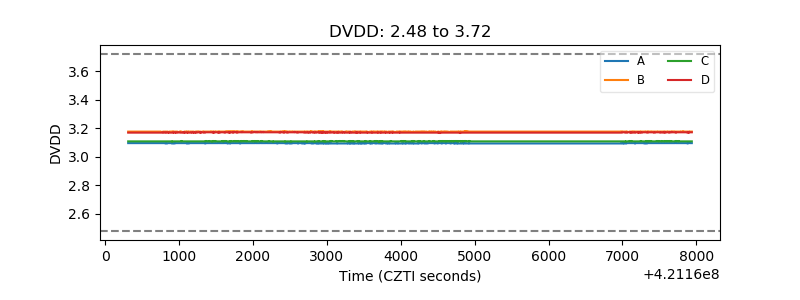 |
| Temperature 1 | 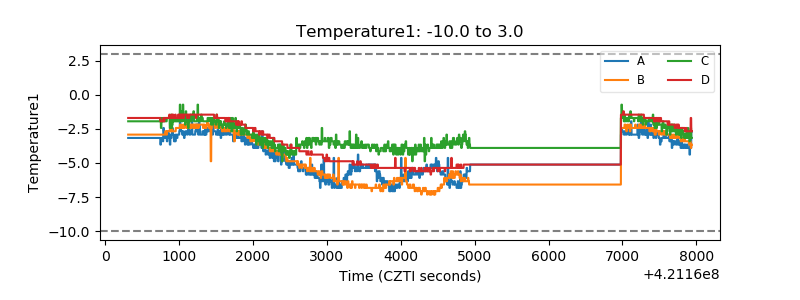 |
| Veto HV Monitor | 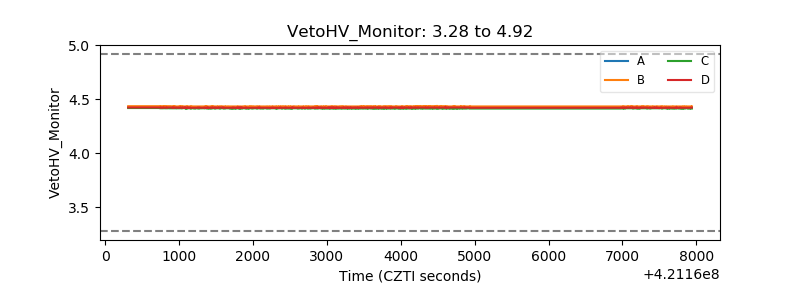 |
| Veto LLD | 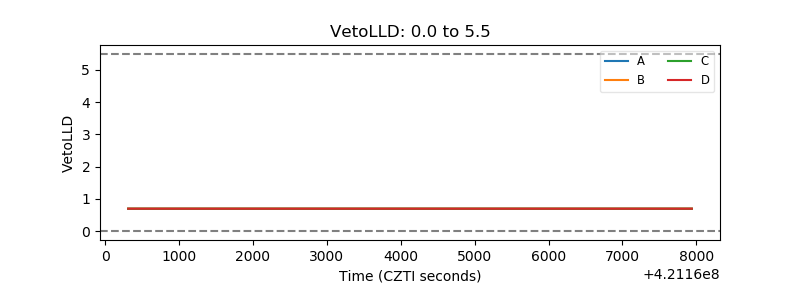 |
| Alpha Counter | 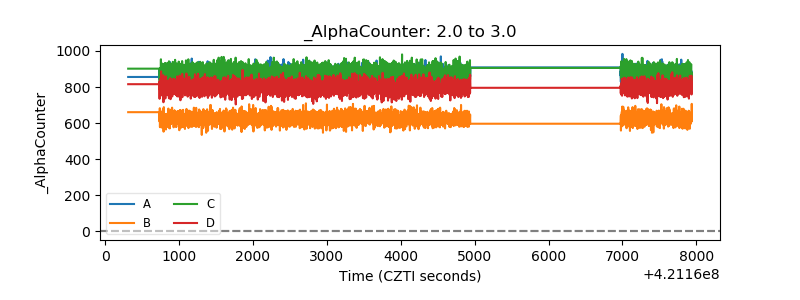 |
| _CPM_Rate | 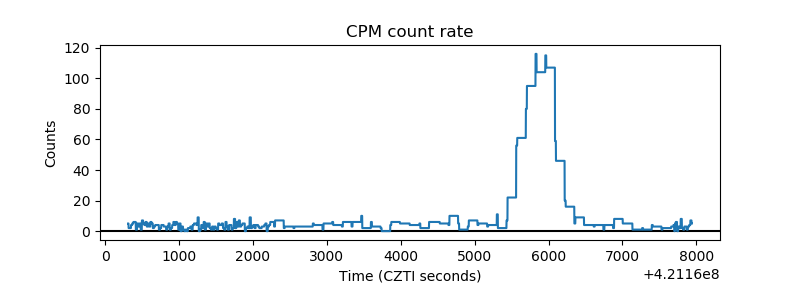 |
| CZT Counter | 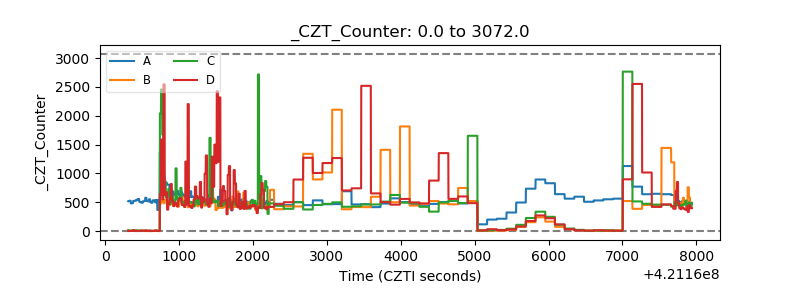 |
| +2.5 Volts monitor | 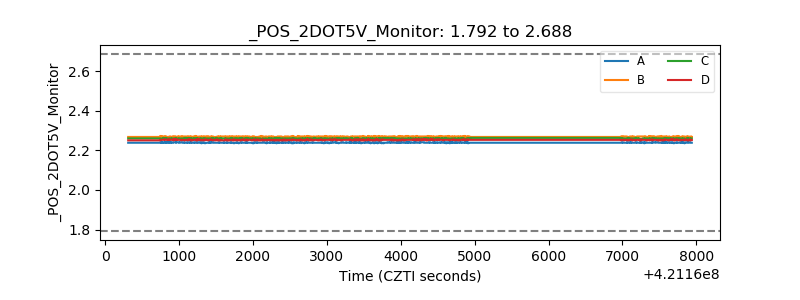 |
| +5 Volts monitor | 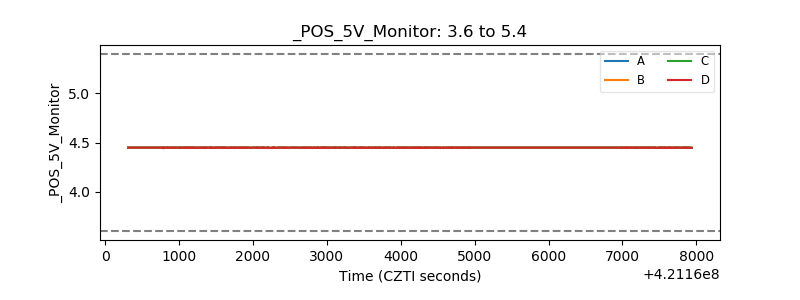 |
| _ROLL_ROT | 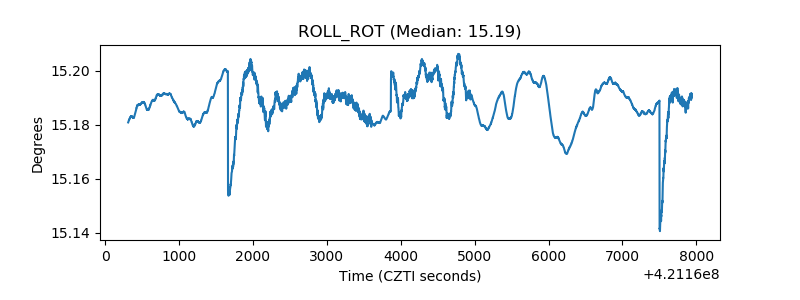 |
| _Roll_DEC | 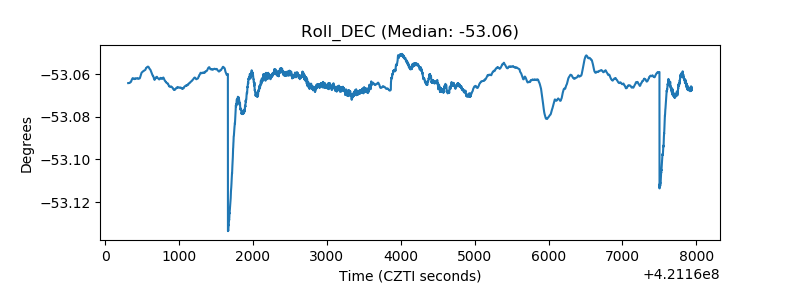 |
| _Roll_RA | 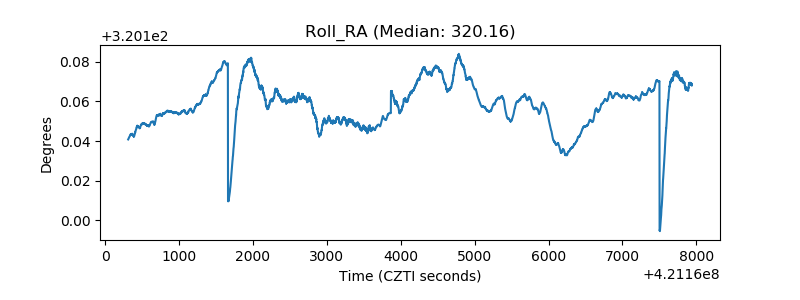 |
| Veto Counter | 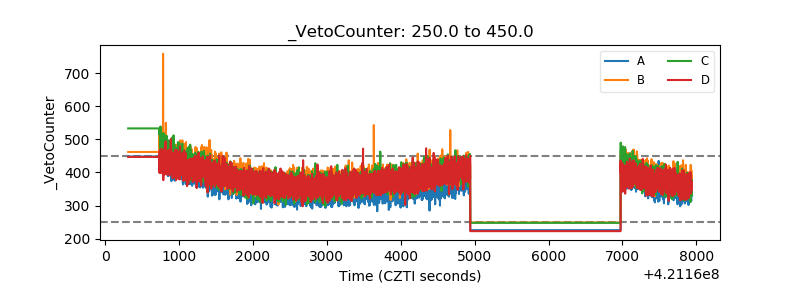 |