| Param | Original file | Final file |
|---|---|---|
| Filename | modeM0/AS1A12_052T04_9000005602_41132cztM0_level2.fits | modeM0/AS1A12_052T04_9000005602_41132cztM0_level2_quad_clean.evt |
| Size (bytes) | 374,189,760 | 95,195,520 |
| Size | 356.9 MB | 90.8 MB |
| Events in quadrant A | 3,041,716 | 650,257 |
| Events in quadrant B | 3,791,255 | 642,073 |
| Events in quadrant C | 3,169,886 | 603,767 |
| Events in quadrant D | 3,392,639 | 577,512 |
| Mode M0 | |||
|---|---|---|---|
| Quadrant | BADHDUFLAG | Total packets | Discarded packets |
| A | 0 | 12516 | 3 |
| B | 0 | 15285 | 2 |
| C | 0 | 13217 | 2 |
| D | 0 | 14261 | 2 |
| Mode M9 | |||
|---|---|---|---|
| Quadrant | BADHDUFLAG | Total packets | Discarded packets |
| A | 0 | 23 | 0 |
| B | 0 | 23 | 0 |
| C | 0 | 23 | 0 |
| D | 0 | 24 | 0 |
| Mode SS | |||
|---|---|---|---|
| Quadrant | BADHDUFLAG | Total packets | Discarded packets |
| A | 0 | 118 | 0 |
| B | 0 | 118 | 0 |
| C | 0 | 118 | 0 |
| D | 0 | 118 | 0 |
| Quadrant | Total seconds | Saturated seconds | Saturation percentage |
|---|---|---|---|
| A | 5854 | 17 | 0.290400% |
| B | 5854 | 161 | 2.750256% |
| C | 5854 | 155 | 2.647762% |
| D | 5854 | 125 | 2.135292% |
Noise dominated data is calculated using 1-second bins in cleaned event files. If a bin has >2000 counts, and if more than 50% of those come from <1% of pixels, then it is considered to be noise-dominated and hence unusable.
| Quadrant | # 1 sec bins | Bins with >0 counts | Bins with >2000 counts | High rate bins dominated by noise | Noise dominated (total time) | Noise dominated (detector-on time) | Marked lightcurve |
|---|---|---|---|---|---|---|---|
| A | 7166 | 5855 | 4 | 4 | 0.06% | 0.07% | 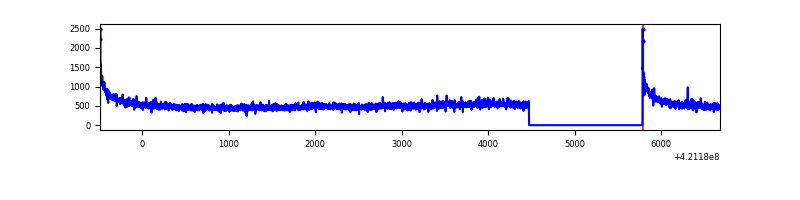 |
| B | 7166 | 5855 | 110 | 110 | 1.54% | 1.88% | 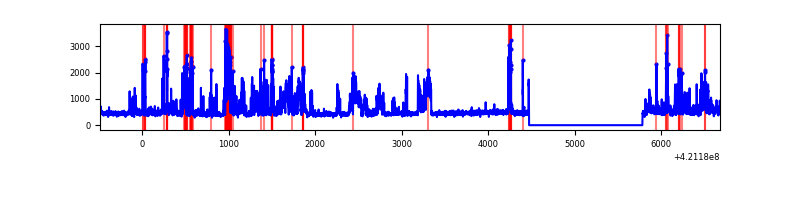 |
| C | 7166 | 5855 | 139 | 139 | 1.94% | 2.37% | 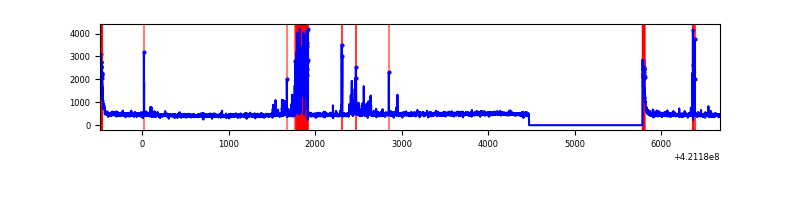 |
| D | 7166 | 5855 | 108 | 108 | 1.51% | 1.84% | 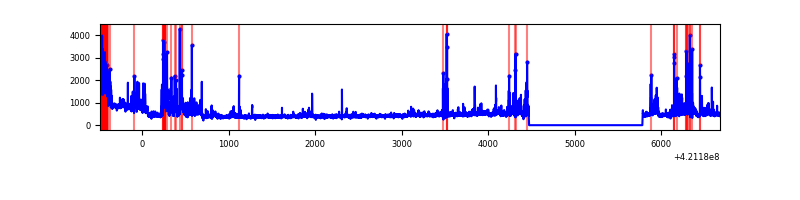 |
Top three noisy pixels from each quadrant. If the there are fewer than three noisy pixels in the level2.evt file, extra rows are filled as -1
| Pixel properties | Quadrant properties | ||||||
|---|---|---|---|---|---|---|---|
| Quadrant | DetID | PixID | Counts | Sigma | Mean | Median | Sigma |
| A | 10 | 83 | 541225 | 4136.89 | 634 | 622 | 130.7 |
| A | 12 | 189 | 33517 | 251.72 | 634 | 622 | 130.7 |
| A | 13 | 254 | 9660 | 69.16 | 634 | 622 | 130.7 |
| B | 0 | 245 | 1189547 | 9899.77 | 622 | 602 | 120.1 |
| B | 5 | 255 | 67244 | 554.9 | 622 | 602 | 120.1 |
| B | 0 | 190 | 51276 | 421.94 | 622 | 602 | 120.1 |
| C | 14 | 254 | 363982 | 2532.85 | 610 | 615 | 143.5 |
| C | 15 | 214 | 250184 | 1739.62 | 610 | 615 | 143.5 |
| C | 0 | 10 | 134408 | 932.6 | 610 | 615 | 143.5 |
| D | 2 | 16 | 657067 | 4358.97 | 615 | 597 | 150.6 |
| D | 2 | 249 | 152041 | 1005.59 | 615 | 597 | 150.6 |
| D | 9 | 19 | 87800 | 579.03 | 615 | 597 | 150.6 |
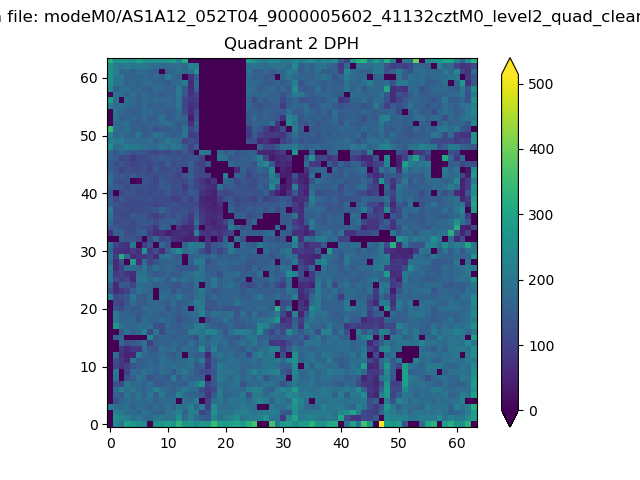
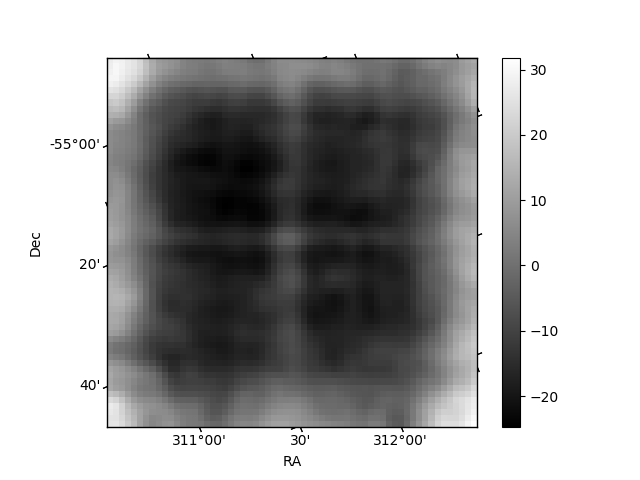
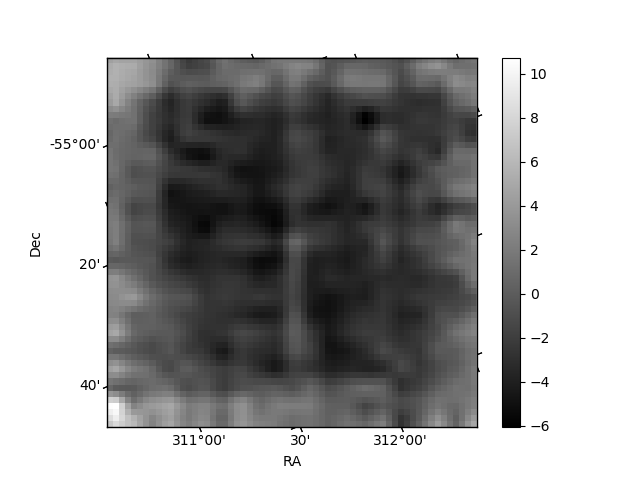
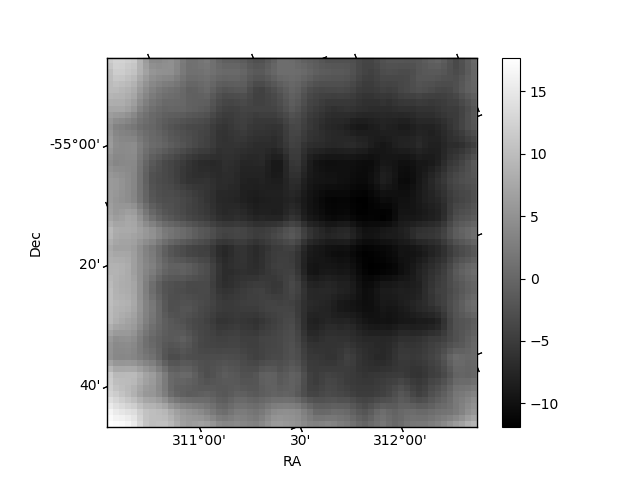
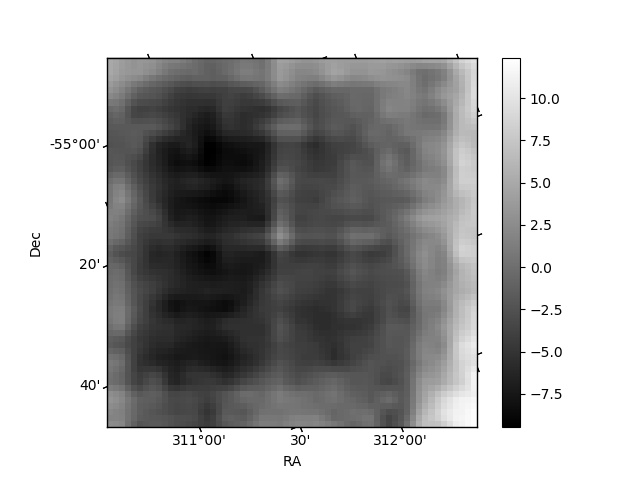
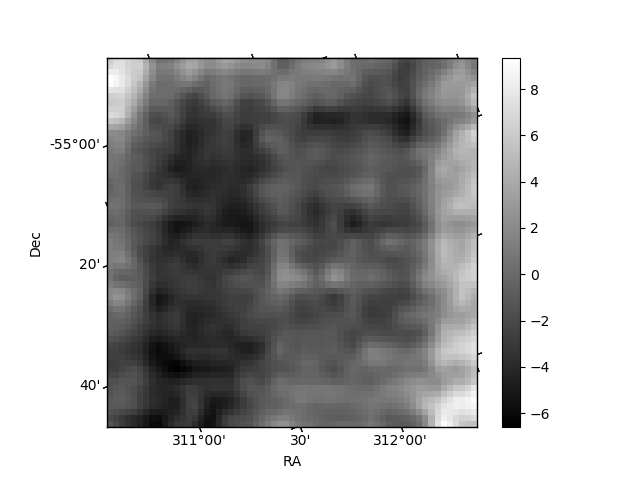
Histogram calculated using DETX and DETY for each event in the final _common_clean file
| Quadrant A | 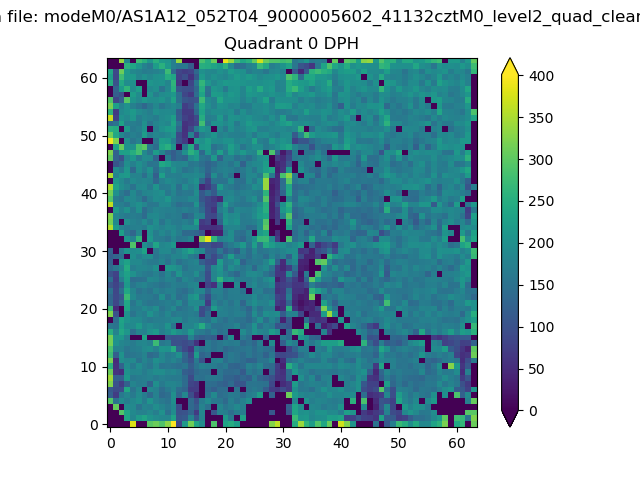 |
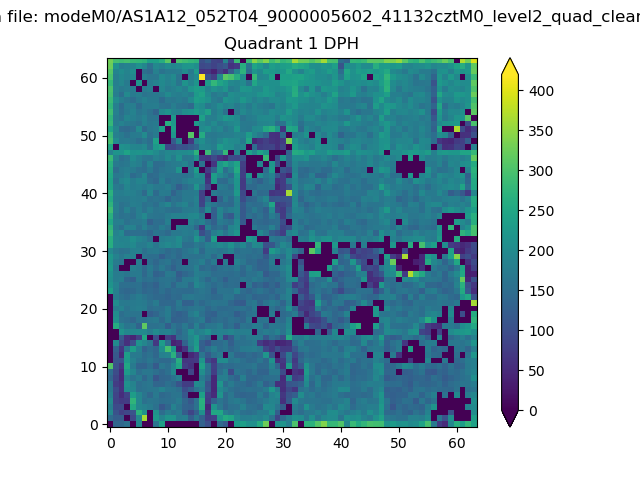 |
Quadrant B |
|---|---|---|---|
| Quadrant D | 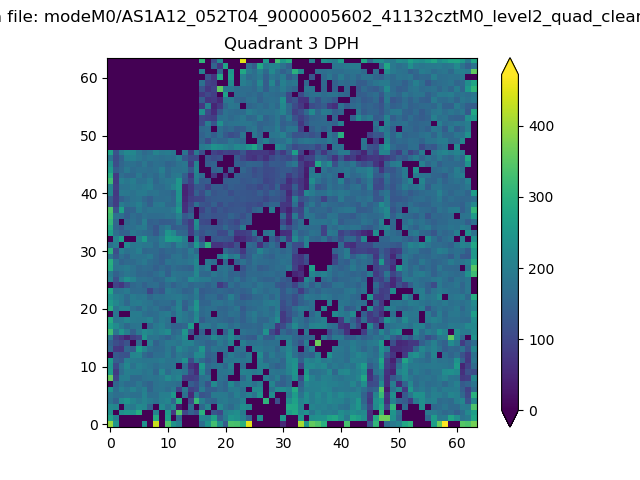 |
 |
Quadrant C |
| Plot type | Count rate plots | Images |
|---|---|---|
| Comparison with Poisson distribution Blue bars denote a histogram of data divided into 1 sec bins. Red curve is a Poisson curve with rate = median count rate of data. |
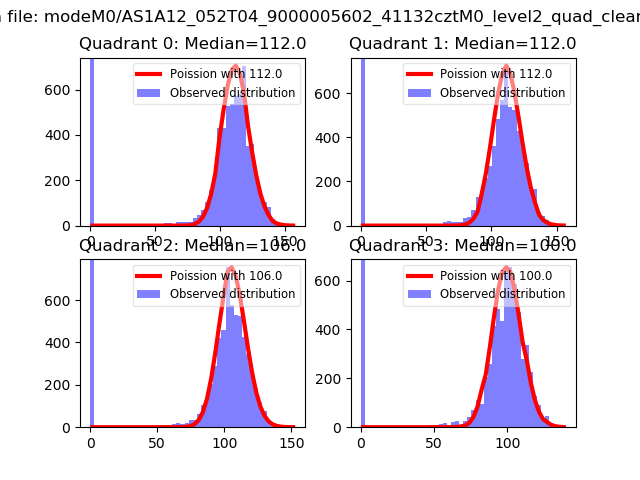 |
 |
| Quadrant-wise count rates Data is divided into 100 sec bins |
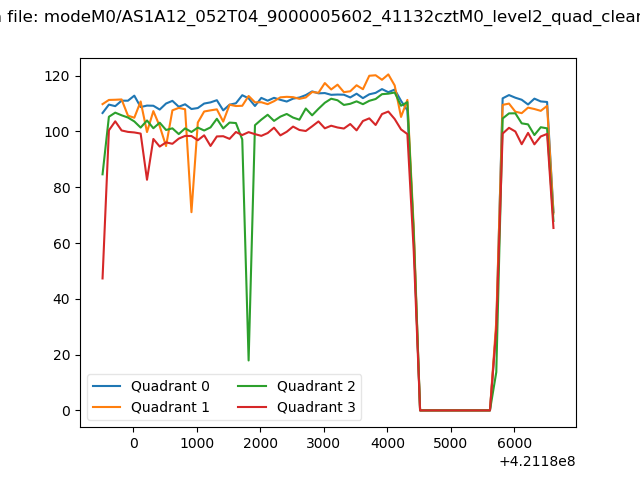 |
|
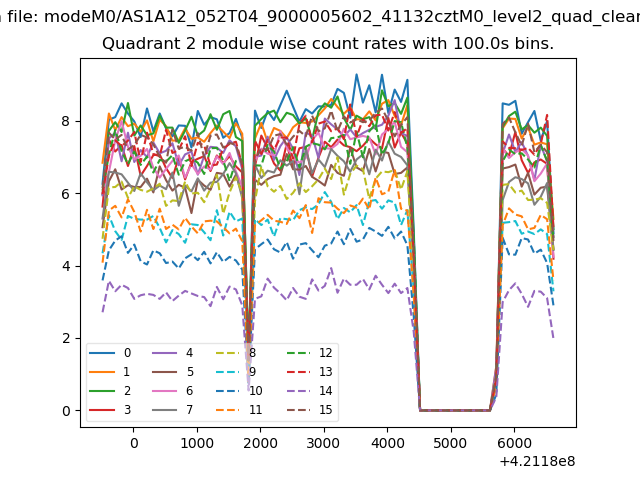
| Module-wise count rates for Quadrant A Data is divided into 100 sec bins |
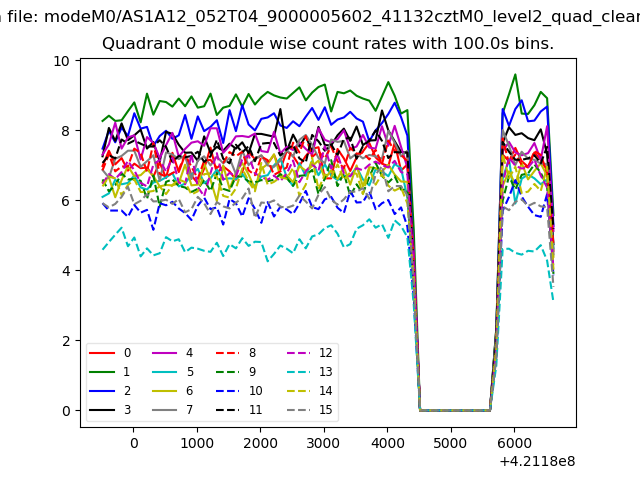 |
 |
| Module-wise count rates for Quadrant B Data is divided into 100 sec bins |
 |
 |
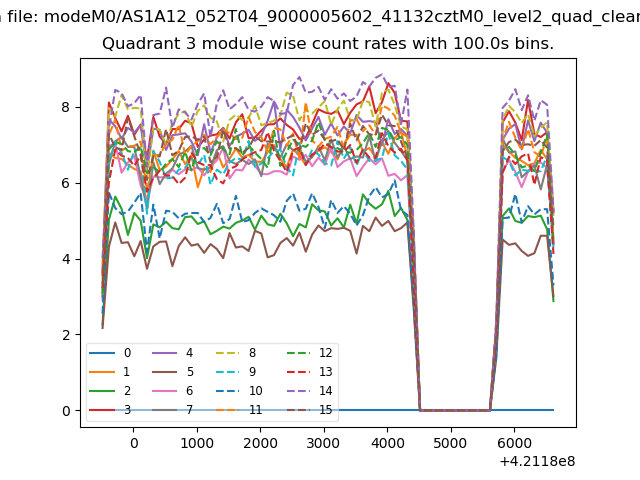
| Module-wise count rates for Quadrant C Data is divided into 100 sec bins |
 |
 |
| Module-wise count rates for Quadrant D Data is divided into 100 sec bins |
 |
 |
| Parameter | Plot |
|---|---|
| CZT HV Monitor | 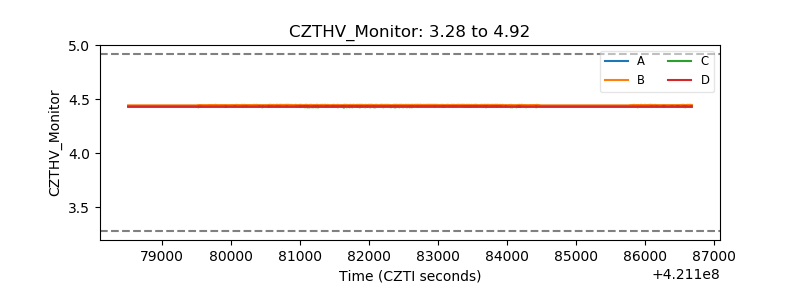 |
| D_VDD | 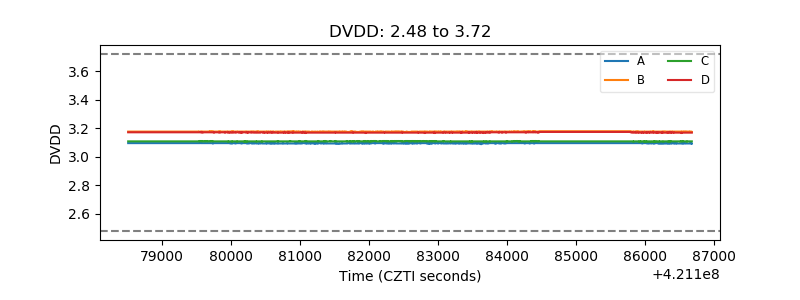 |
| Temperature 1 | 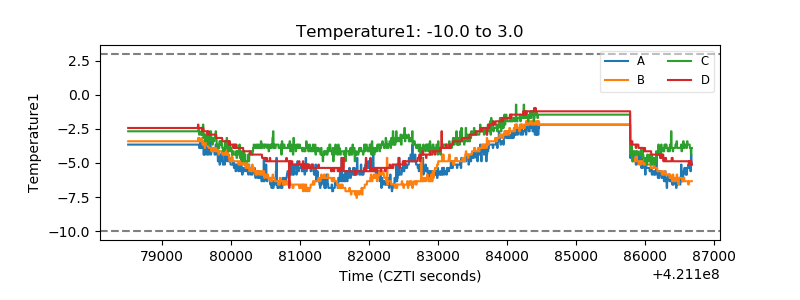 |
| Veto HV Monitor | 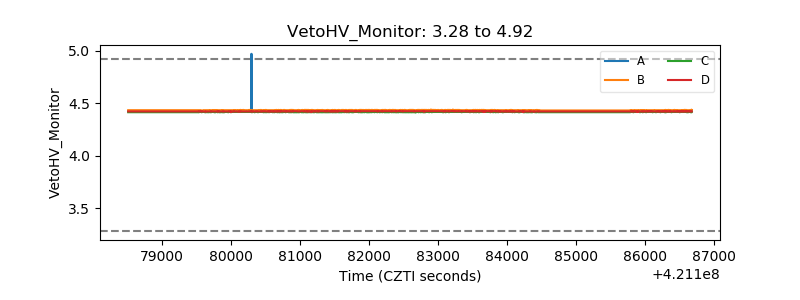 |
| Veto LLD | 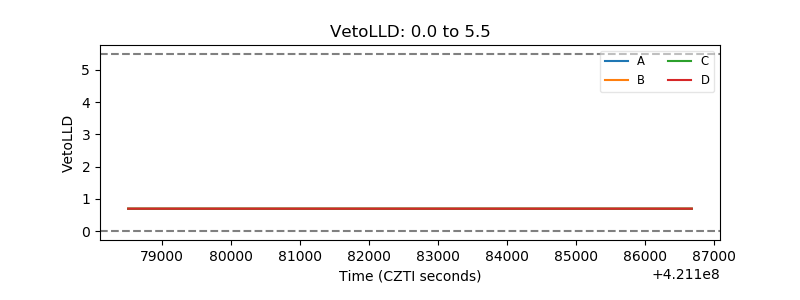 |
| Alpha Counter | 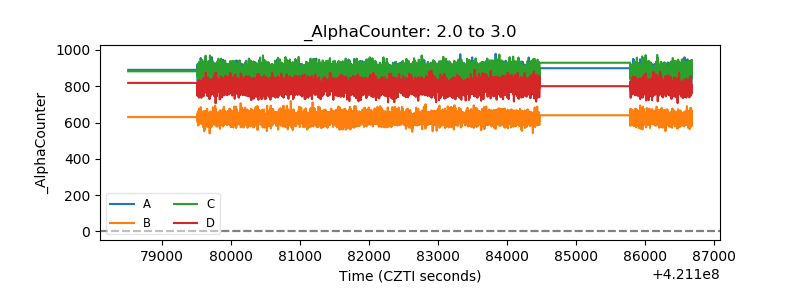 |
| _CPM_Rate | 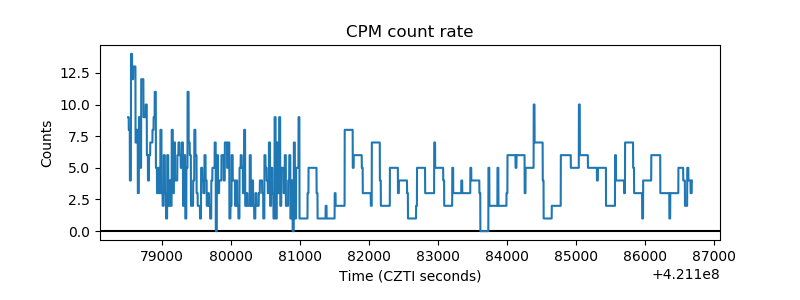 |
| CZT Counter | 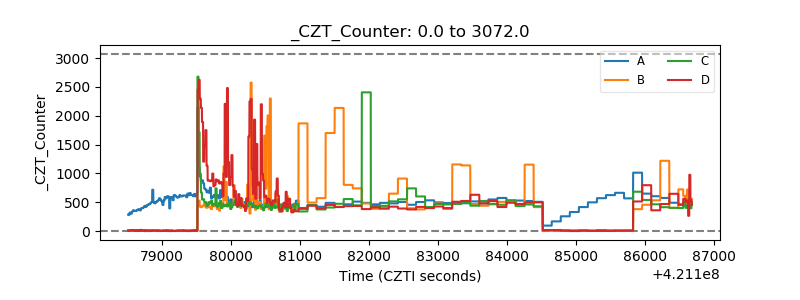 |
| +2.5 Volts monitor | 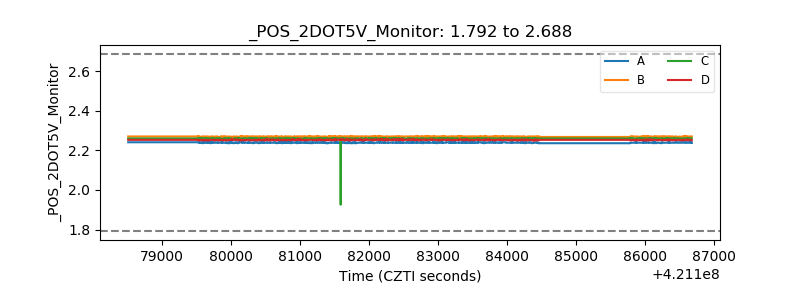 |
| +5 Volts monitor | 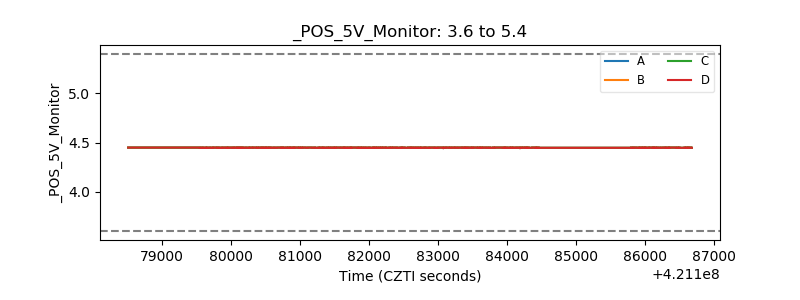 |
| _ROLL_ROT | 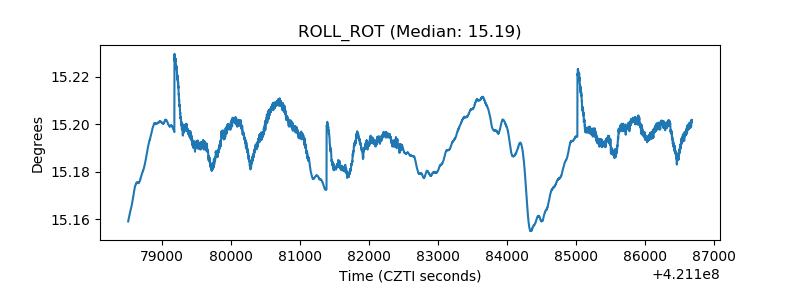 |
| _Roll_DEC | 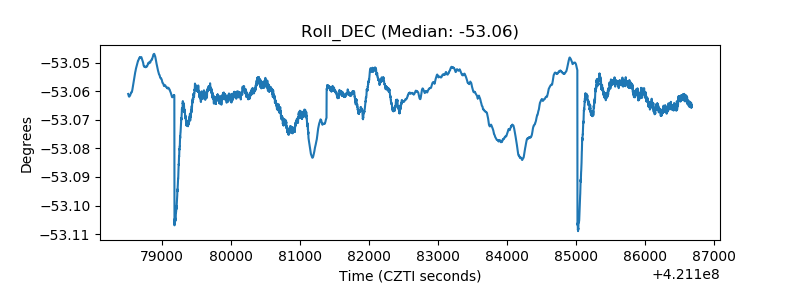 |
| _Roll_RA | 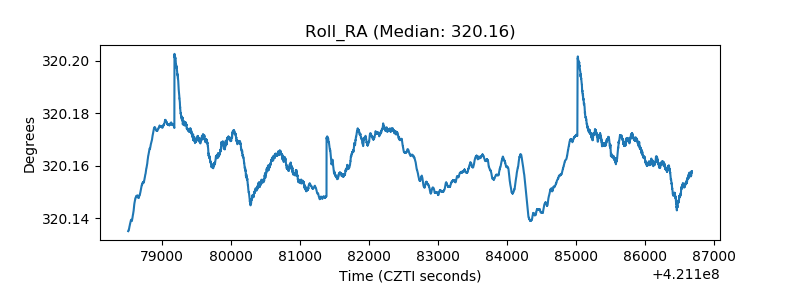 |
| Veto Counter |  |