| Param | Original file | Final file |
|---|---|---|
| Filename | modeM0/AS1A12_052T04_9000005602_41135cztM0_level2.fits | modeM0/AS1A12_052T04_9000005602_41135cztM0_level2_quad_clean.evt |
| Size (bytes) | 445,322,880 | 109,169,280 |
| Size | 424.7 MB | 104.1 MB |
| Events in quadrant A | 3,556,742 | 746,352 |
| Events in quadrant B | 4,612,235 | 718,658 |
| Events in quadrant C | 4,210,815 | 700,889 |
| Events in quadrant D | 3,576,849 | 666,381 |
| Mode M0 | |||
|---|---|---|---|
| Quadrant | BADHDUFLAG | Total packets | Discarded packets |
| A | 0 | 14776 | 3 |
| B | 0 | 18410 | 2 |
| C | 0 | 16980 | 2 |
| D | 0 | 15475 | 2 |
| Mode M9 | |||
|---|---|---|---|
| Quadrant | BADHDUFLAG | Total packets | Discarded packets |
| A | 0 | 17 | 0 |
| B | 0 | 17 | 0 |
| C | 0 | 17 | 0 |
| D | 0 | 18 | 0 |
| Mode SS | |||
|---|---|---|---|
| Quadrant | BADHDUFLAG | Total packets | Discarded packets |
| A | 0 | 138 | 0 |
| B | 0 | 138 | 0 |
| C | 0 | 138 | 0 |
| D | 0 | 138 | 0 |
| Quadrant | Total seconds | Saturated seconds | Saturation percentage |
|---|---|---|---|
| A | 6791 | 17 | 0.250331% |
| B | 6791 | 389 | 5.728170% |
| C | 6791 | 167 | 2.459137% |
| D | 6791 | 71 | 1.045501% |
Noise dominated data is calculated using 1-second bins in cleaned event files. If a bin has >2000 counts, and if more than 50% of those come from <1% of pixels, then it is considered to be noise-dominated and hence unusable.
| Quadrant | # 1 sec bins | Bins with >0 counts | Bins with >2000 counts | High rate bins dominated by noise | Noise dominated (total time) | Noise dominated (detector-on time) | Marked lightcurve |
|---|---|---|---|---|---|---|---|
| A | 8102 | 6792 | 4 | 4 | 0.05% | 0.06% | 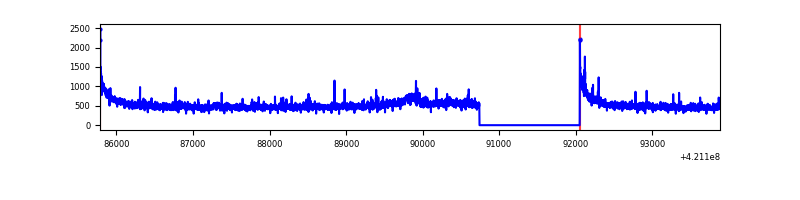 |
| B | 8102 | 6792 | 257 | 257 | 3.17% | 3.78% | 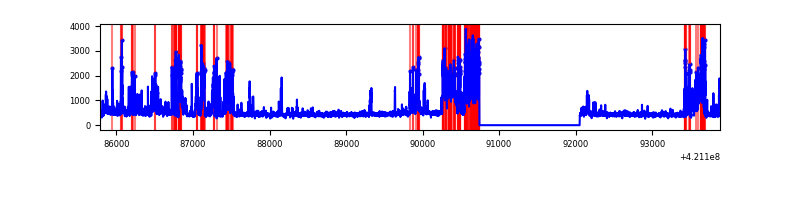 |
| C | 8102 | 6792 | 138 | 138 | 1.70% | 2.03% | 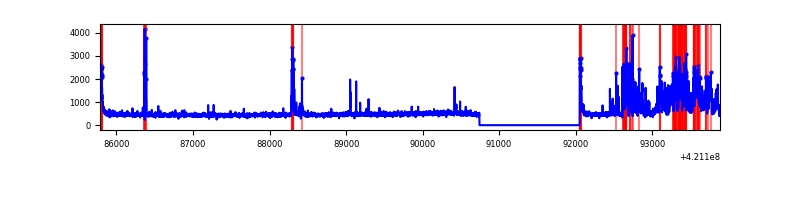 |
| D | 8102 | 6792 | 61 | 61 | 0.75% | 0.90% | 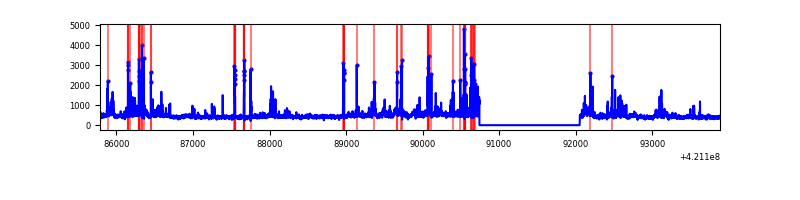 |
Top three noisy pixels from each quadrant. If the there are fewer than three noisy pixels in the level2.evt file, extra rows are filled as -1
| Pixel properties | Quadrant properties | ||||||
|---|---|---|---|---|---|---|---|
| Quadrant | DetID | PixID | Counts | Sigma | Mean | Median | Sigma |
| A | 10 | 83 | 594597 | 3956.78 | 728 | 713 | 150.1 |
| A | 12 | 189 | 81163 | 536.0 | 728 | 713 | 150.1 |
| A | 2 | 79 | 45348 | 297.38 | 728 | 713 | 150.1 |
| B | 0 | 245 | 1276085 | 9191.68 | 711 | 692 | 138.8 |
| B | 0 | 186 | 371432 | 2671.9 | 711 | 692 | 138.8 |
| B | 5 | 255 | 90896 | 650.09 | 711 | 692 | 138.8 |
| C | 9 | 54 | 926491 | 5609.74 | 708 | 712 | 165.0 |
| C | 15 | 214 | 289219 | 1748.2 | 708 | 712 | 165.0 |
| C | 0 | 10 | 113399 | 682.83 | 708 | 712 | 165.0 |
| D | 2 | 16 | 368809 | 2127.0 | 710 | 689 | 173.1 |
| D | 2 | 249 | 155376 | 893.78 | 710 | 689 | 173.1 |
| D | 13 | 249 | 153987 | 885.76 | 710 | 689 | 173.1 |
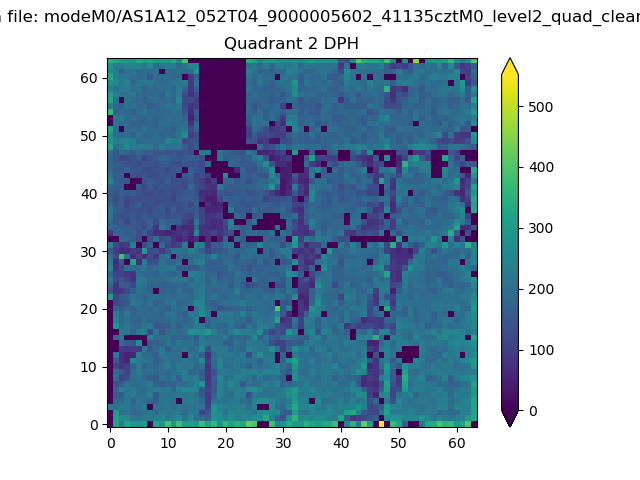
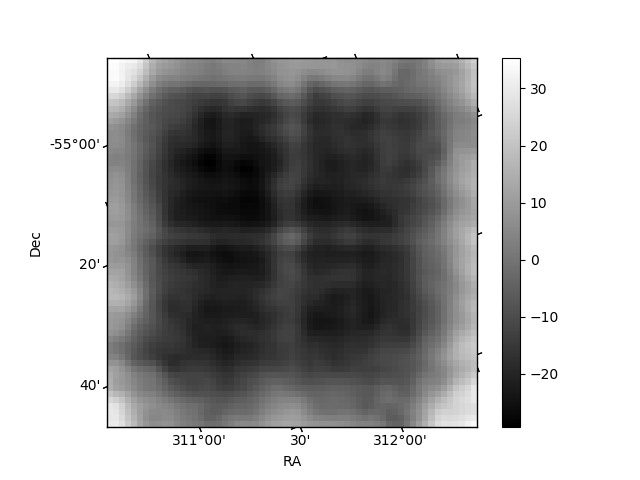
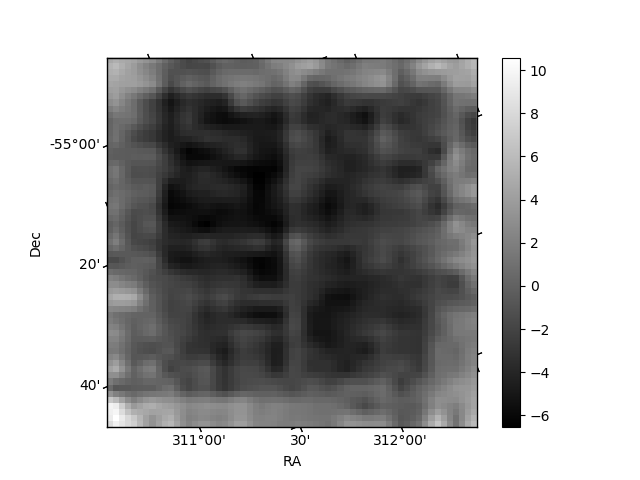
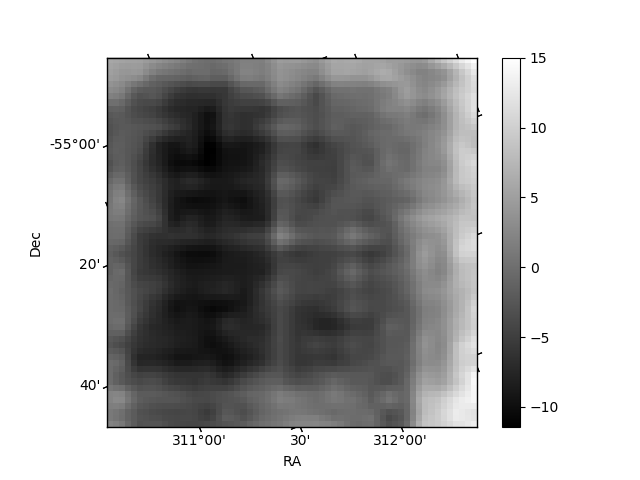
Histogram calculated using DETX and DETY for each event in the final _common_clean file
| Quadrant A | 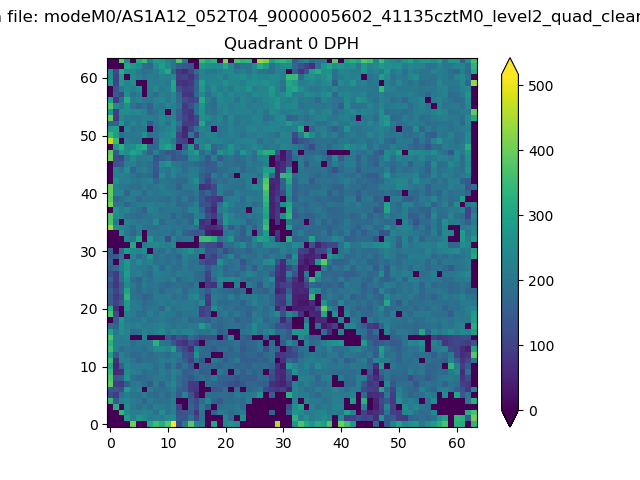 |
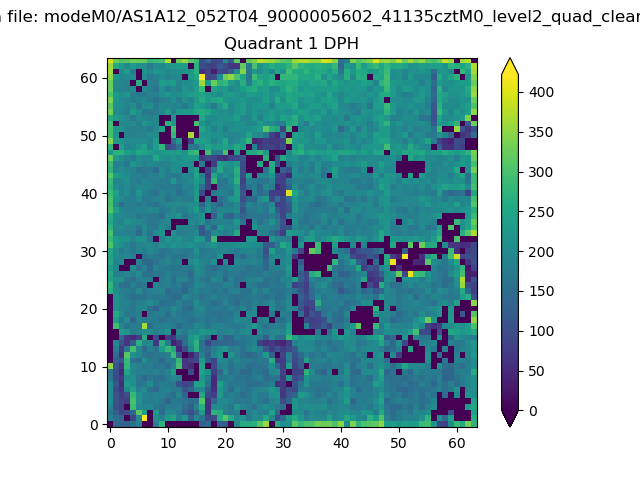 |
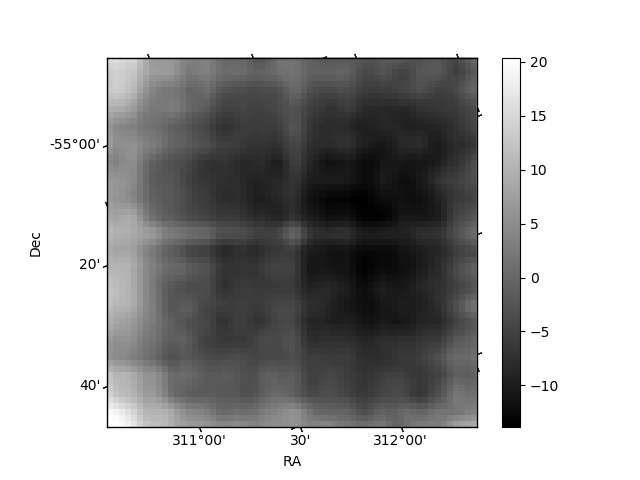
Quadrant B |
|---|---|---|---|
| Quadrant D | 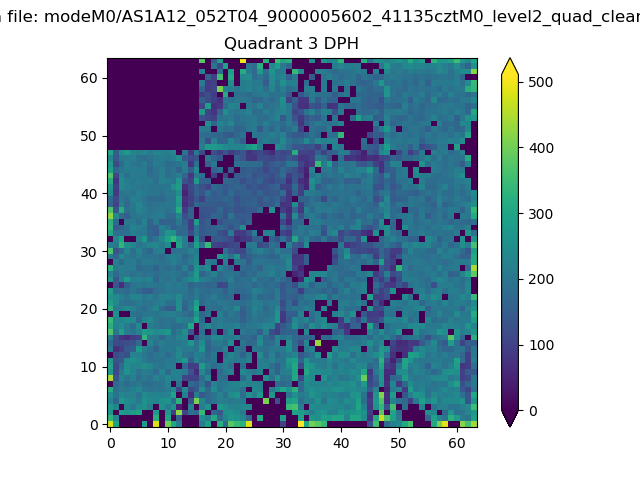 |
 |
Quadrant C |
| Plot type | Count rate plots | Images |
|---|---|---|
| Comparison with Poisson distribution Blue bars denote a histogram of data divided into 1 sec bins. Red curve is a Poisson curve with rate = median count rate of data. |
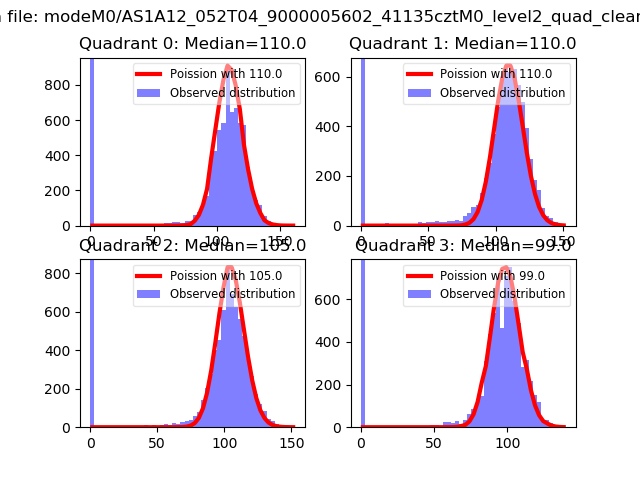 |
 |
| Quadrant-wise count rates Data is divided into 100 sec bins |
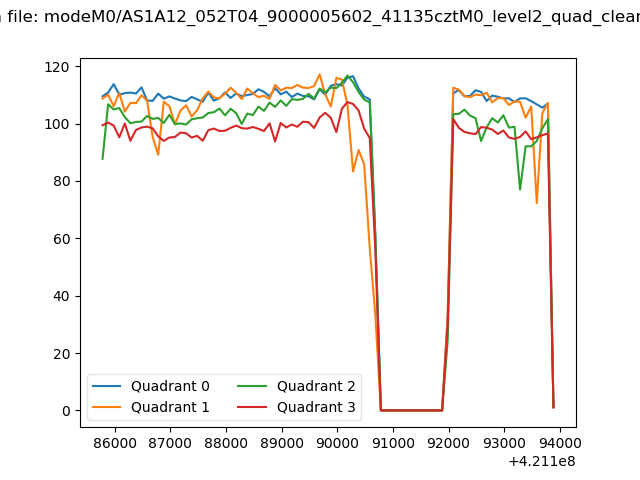 |
|
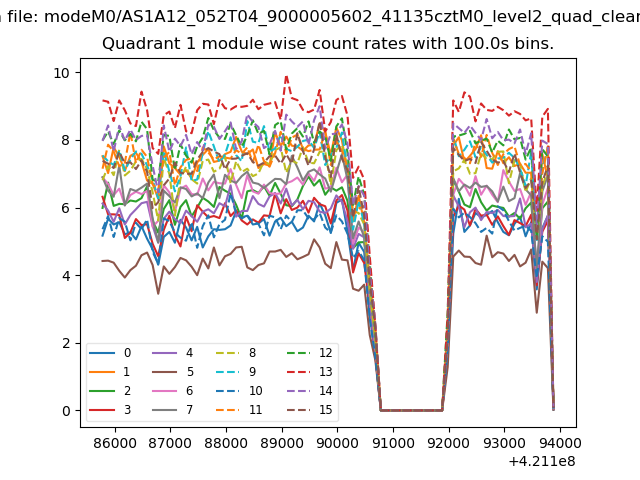
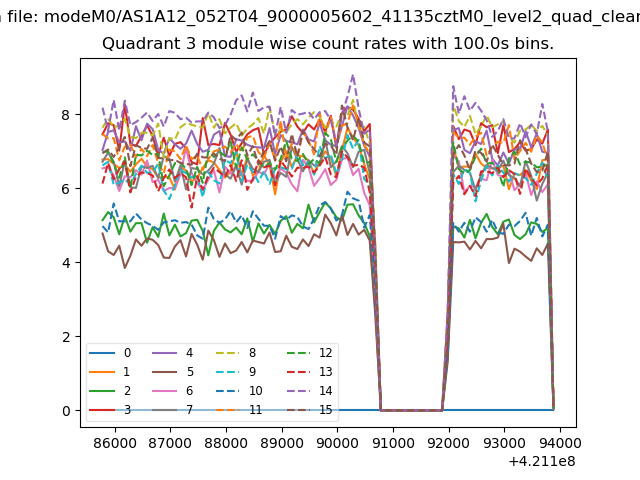
| Module-wise count rates for Quadrant A Data is divided into 100 sec bins |
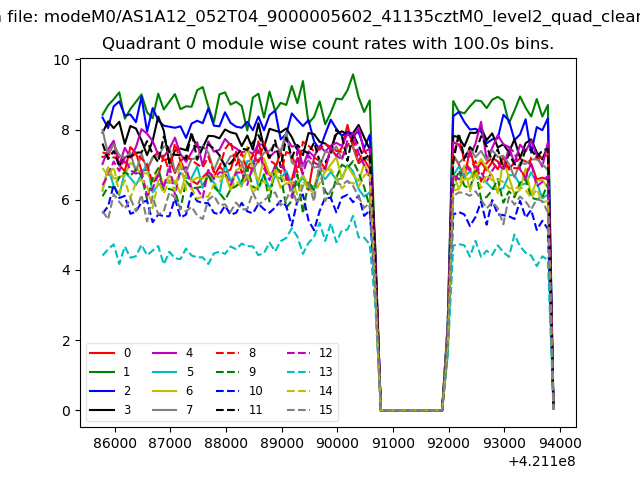 |
 |
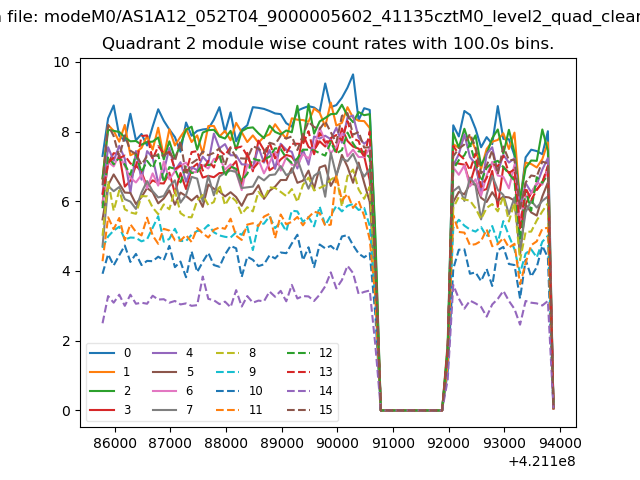
| Module-wise count rates for Quadrant B Data is divided into 100 sec bins |
 |
 |
| Module-wise count rates for Quadrant C Data is divided into 100 sec bins |
 |
 |
| Module-wise count rates for Quadrant D Data is divided into 100 sec bins |
 |
 |
| Parameter | Plot |
|---|---|
| CZT HV Monitor | 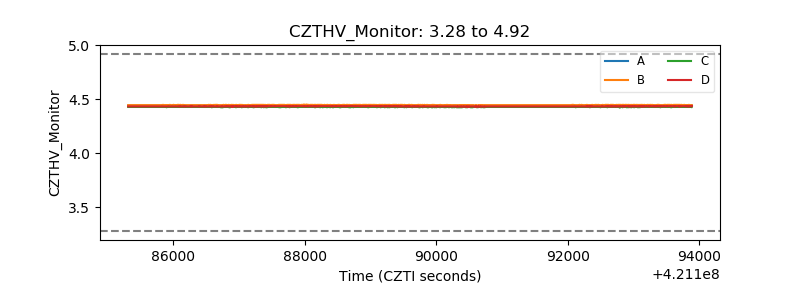 |
| D_VDD | 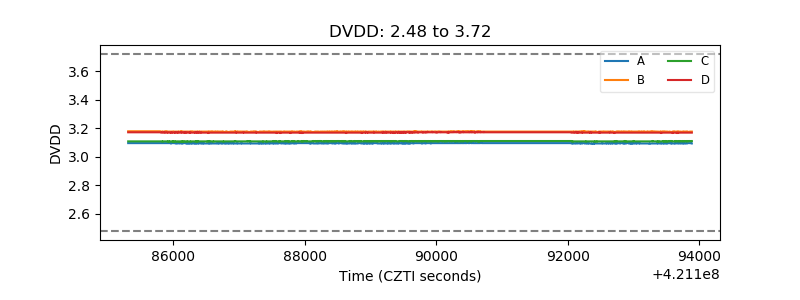 |
| Temperature 1 | 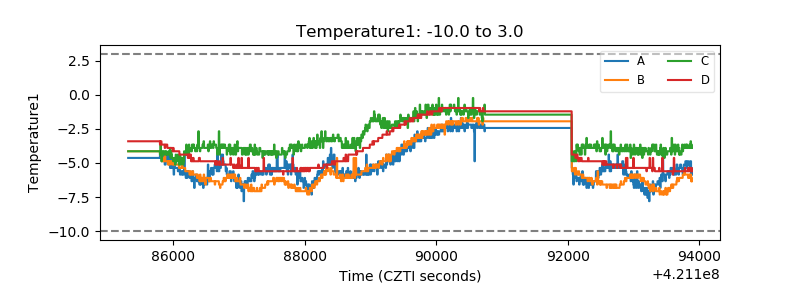 |
| Veto HV Monitor | 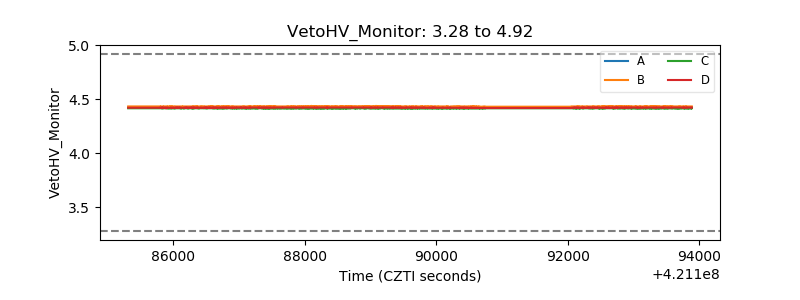 |
| Veto LLD | 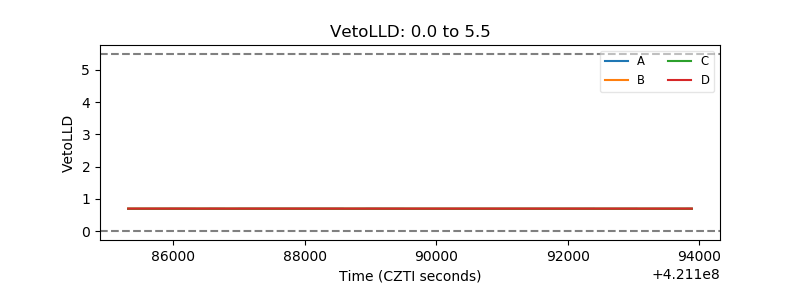 |
| Alpha Counter | 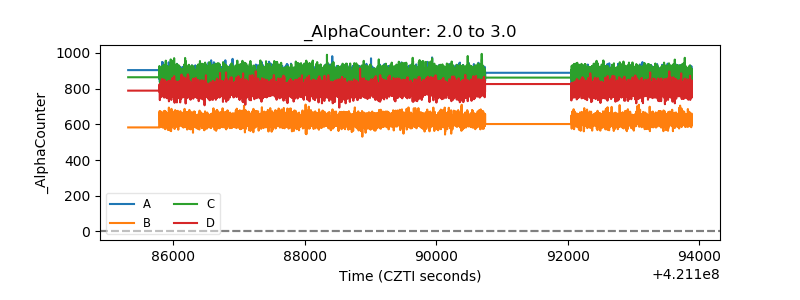 |
| _CPM_Rate | 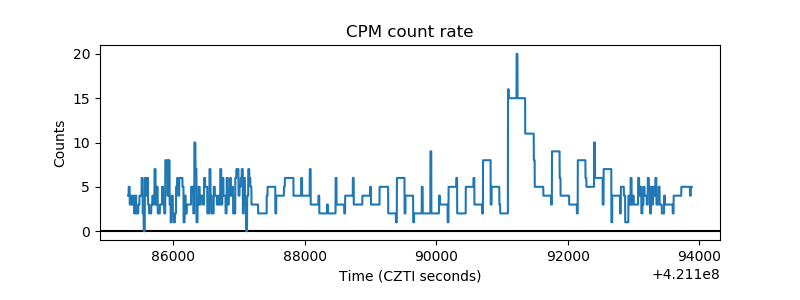 |
| CZT Counter | 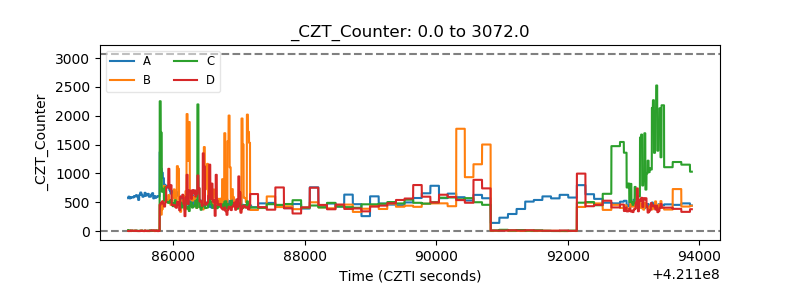 |
| +2.5 Volts monitor | 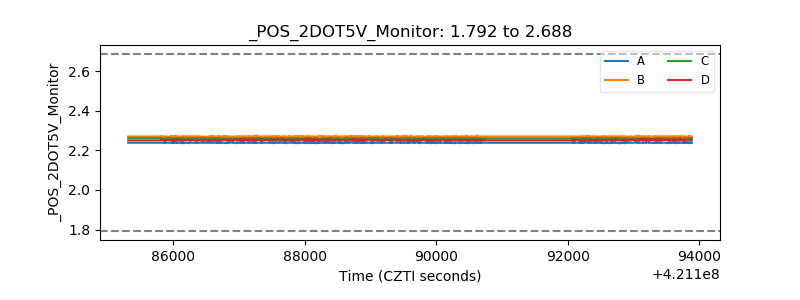 |
| +5 Volts monitor | 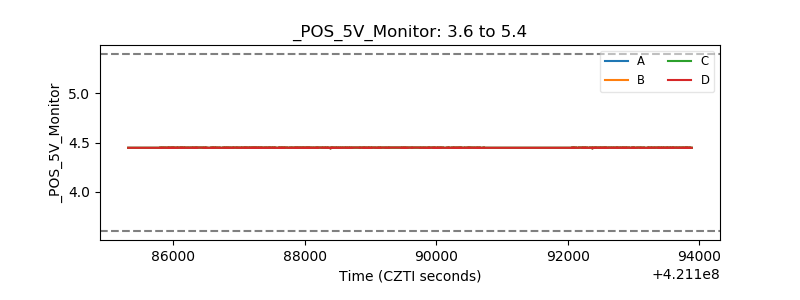 |
| _ROLL_ROT | 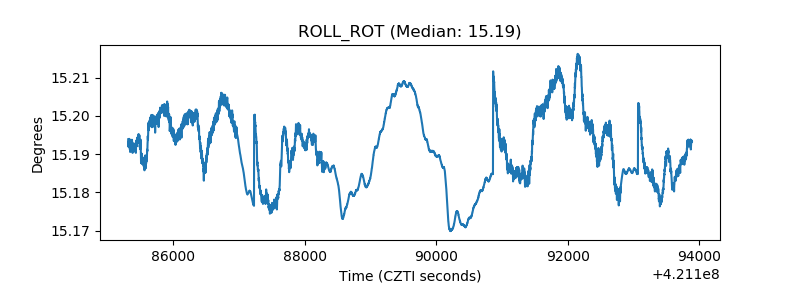 |
| _Roll_DEC | 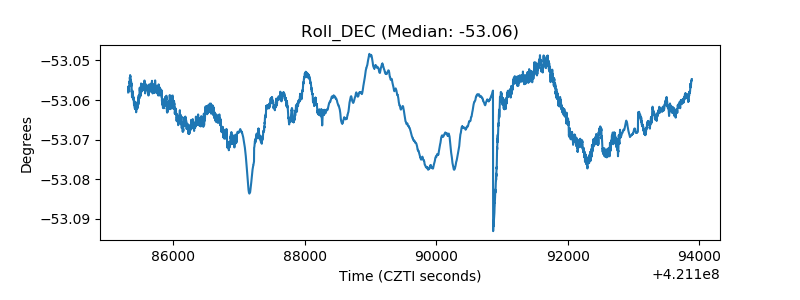 |
| _Roll_RA | 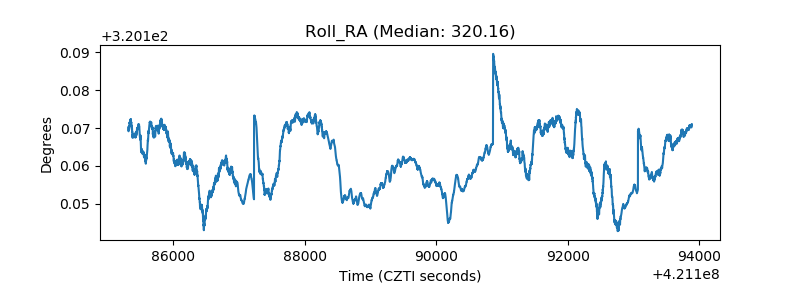 |
| Veto Counter | 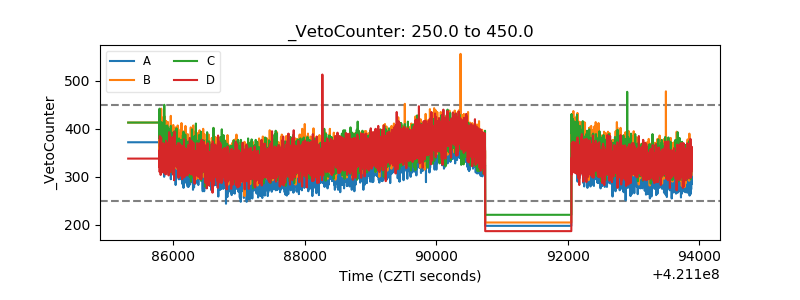 |