| Param | Original file | Final file |
|---|---|---|
| Filename | modeM0/AS1A12_052T04_9000005602_41136cztM0_level2.fits | modeM0/AS1A12_052T04_9000005602_41136cztM0_level2_quad_clean.evt |
| Size (bytes) | 888,393,600 | 206,922,240 |
| Size | 847.2 MB | 197.3 MB |
| Events in quadrant A | 6,736,491 | 1,419,491 |
| Events in quadrant B | 11,241,364 | 1,289,070 |
| Events in quadrant C | 6,823,061 | 1,380,410 |
| Events in quadrant D | 7,068,277 | 1,269,866 |
| Mode M0 | |||
|---|---|---|---|
| Quadrant | BADHDUFLAG | Total packets | Discarded packets |
| A | 0 | 27938 | 3 |
| B | 0 | 42642 | 2 |
| C | 0 | 28668 | 2 |
| D | 0 | 30770 | 2 |
| Mode M9 | |||
|---|---|---|---|
| Quadrant | BADHDUFLAG | Total packets | Discarded packets |
| A | 0 | 28 | 0 |
| B | 0 | 28 | 0 |
| C | 0 | 28 | 0 |
| D | 0 | 28 | 0 |
| Mode SS | |||
|---|---|---|---|
| Quadrant | BADHDUFLAG | Total packets | Discarded packets |
| A | 0 | 266 | 0 |
| B | 0 | 266 | 0 |
| C | 0 | 266 | 0 |
| D | 0 | 266 | 0 |
| Quadrant | Total seconds | Saturated seconds | Saturation percentage |
|---|---|---|---|
| A | 13115 | 30 | 0.228746% |
| B | 13115 | 1579 | 12.039649% |
| C | 13115 | 108 | 0.823485% |
| D | 13115 | 262 | 1.997713% |
Noise dominated data is calculated using 1-second bins in cleaned event files. If a bin has >2000 counts, and if more than 50% of those come from <1% of pixels, then it is considered to be noise-dominated and hence unusable.
| Quadrant | # 1 sec bins | Bins with >0 counts | Bins with >2000 counts | High rate bins dominated by noise | Noise dominated (total time) | Noise dominated (detector-on time) | Marked lightcurve |
|---|---|---|---|---|---|---|---|
| A | 15919 | 13117 | 14 | 14 | 0.09% | 0.11% | 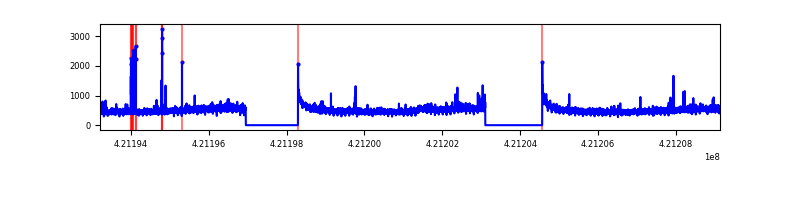 |
| B | 15919 | 13117 | 1177 | 1177 | 7.39% | 8.97% | 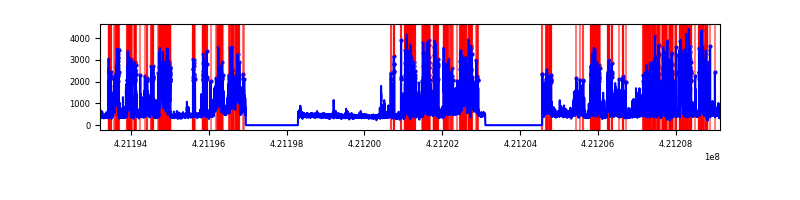 |
| C | 15919 | 13117 | 84 | 84 | 0.53% | 0.64% | 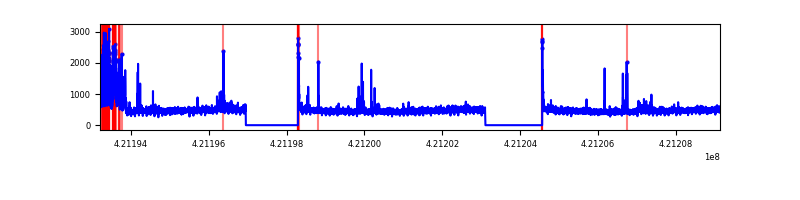 |
| D | 15919 | 13117 | 187 | 187 | 1.17% | 1.43% | 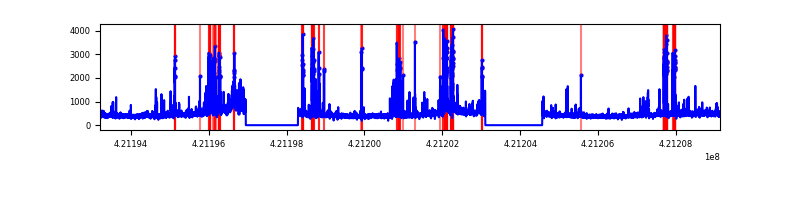 |
Top three noisy pixels from each quadrant. If the there are fewer than three noisy pixels in the level2.evt file, extra rows are filled as -1
| Pixel properties | Quadrant properties | ||||||
|---|---|---|---|---|---|---|---|
| Quadrant | DetID | PixID | Counts | Sigma | Mean | Median | Sigma |
| A | 10 | 83 | 974959 | 3348.34 | 1428 | 1400 | 290.8 |
| A | 2 | 79 | 125091 | 425.41 | 1428 | 1400 | 290.8 |
| A | 12 | 189 | 96535 | 327.19 | 1428 | 1400 | 290.8 |
| B | 0 | 245 | 4680979 | 17914.4 | 1357 | 1320 | 261.2 |
| B | 0 | 186 | 983884 | 3761.39 | 1357 | 1320 | 261.2 |
| B | 7 | 202 | 109960 | 415.89 | 1357 | 1320 | 261.2 |
| C | 9 | 54 | 647101 | 2004.78 | 1392 | 1401 | 322.1 |
| C | 15 | 214 | 545665 | 1689.84 | 1392 | 1401 | 322.1 |
| C | 14 | 254 | 110097 | 337.48 | 1392 | 1401 | 322.1 |
| D | 13 | 249 | 697075 | 2055.79 | 1395 | 1356 | 338.4 |
| D | 2 | 249 | 585404 | 1725.81 | 1395 | 1356 | 338.4 |
| D | 2 | 16 | 382272 | 1125.57 | 1395 | 1356 | 338.4 |
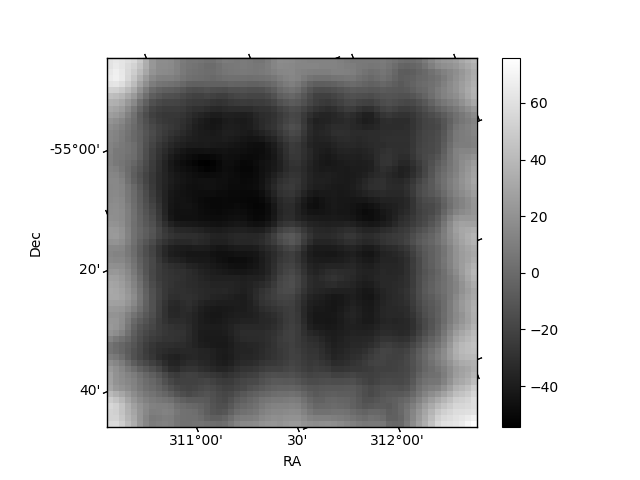
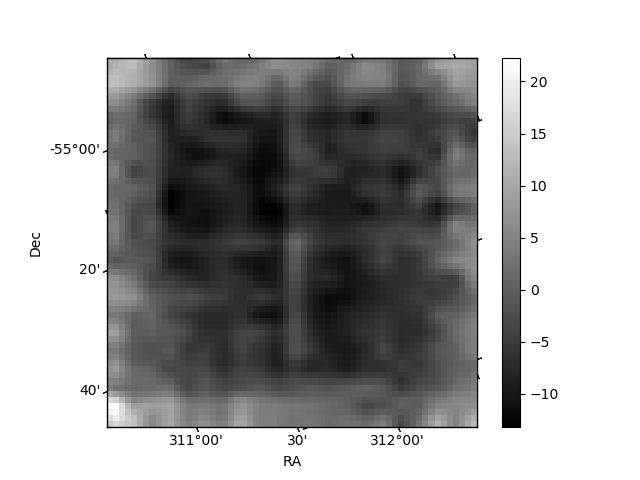
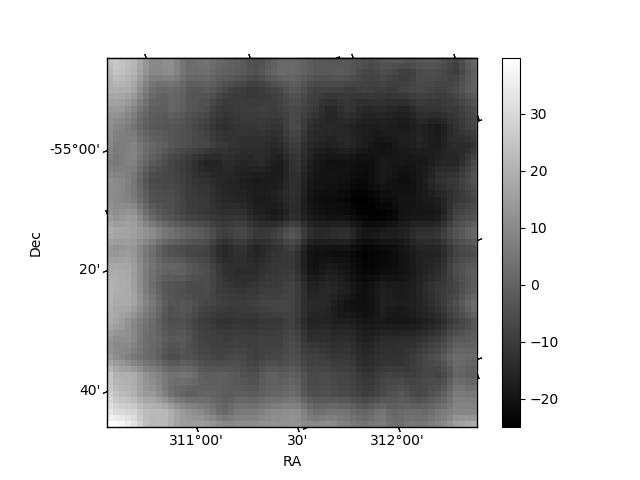
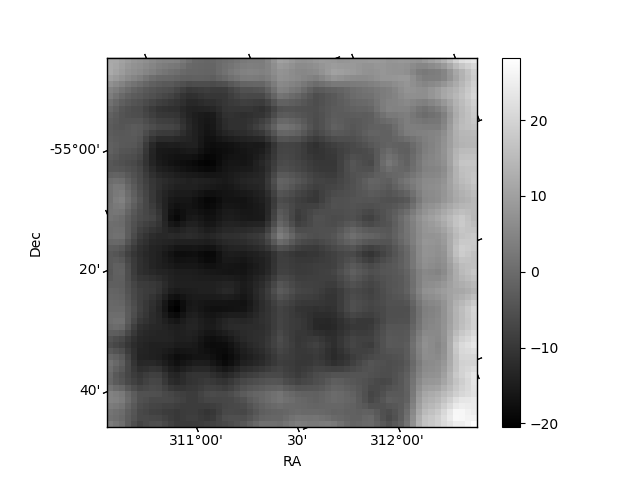
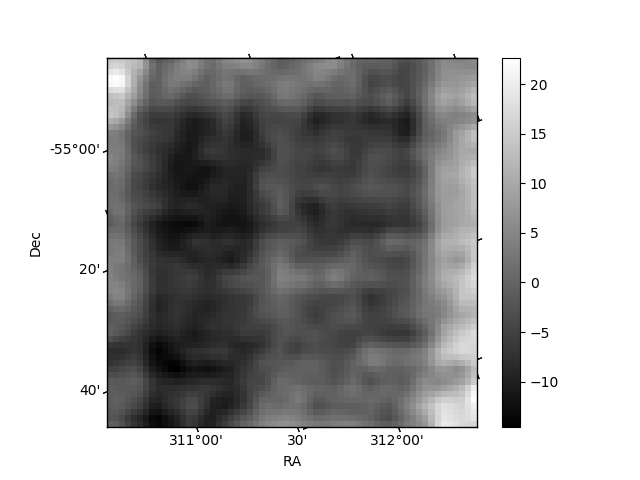
Histogram calculated using DETX and DETY for each event in the final _common_clean file
| Quadrant A | 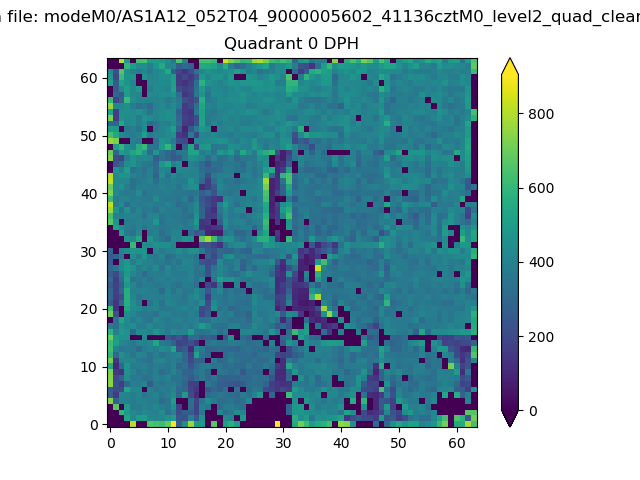 |
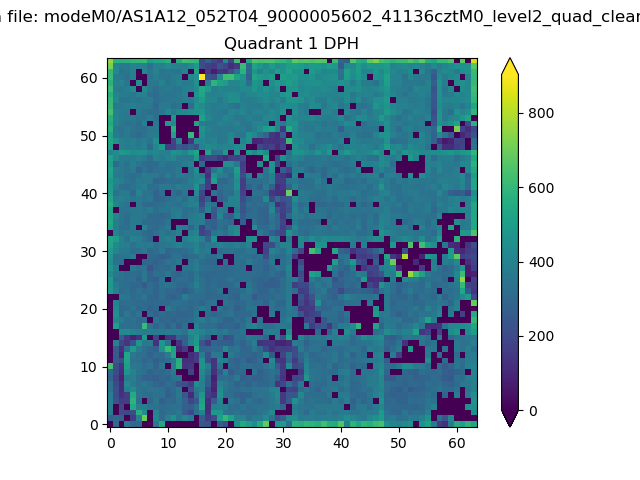 |
Quadrant B |
|---|---|---|---|
| Quadrant D | 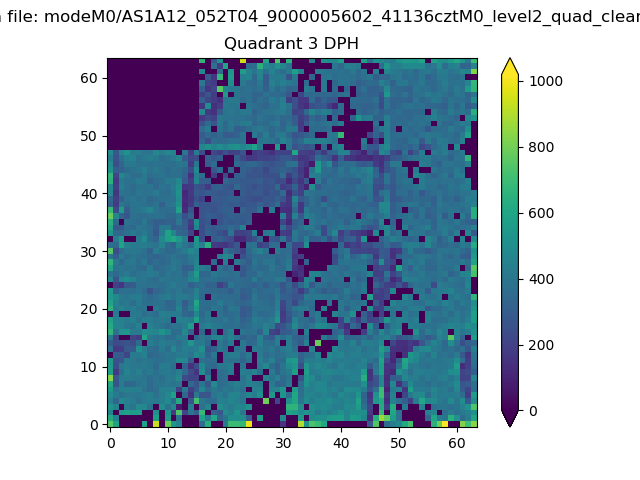 |
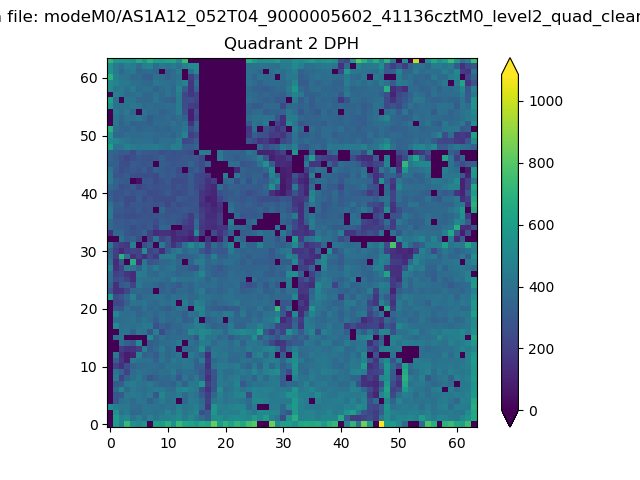 |
Quadrant C |
| Plot type | Count rate plots | Images |
|---|---|---|
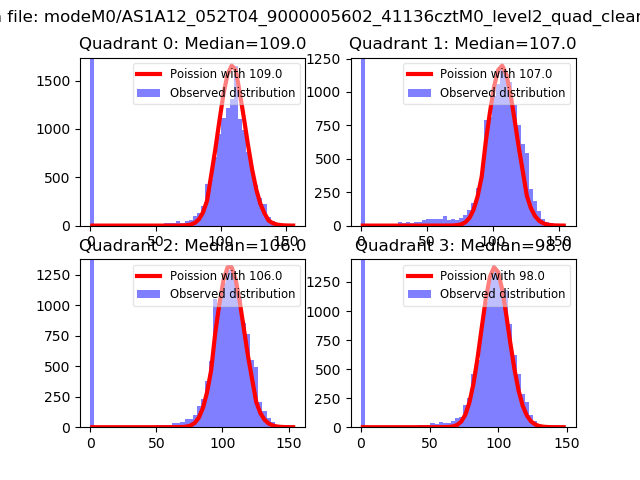
| Comparison with Poisson distribution Blue bars denote a histogram of data divided into 1 sec bins. Red curve is a Poisson curve with rate = median count rate of data. |
 |
 |
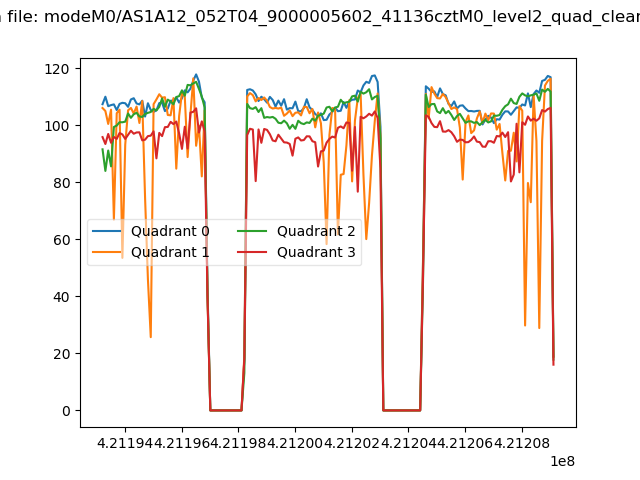
| Quadrant-wise count rates Data is divided into 100 sec bins |
 |
|
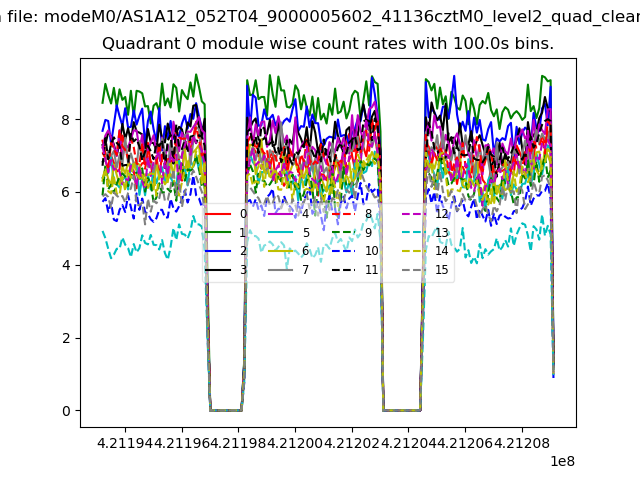
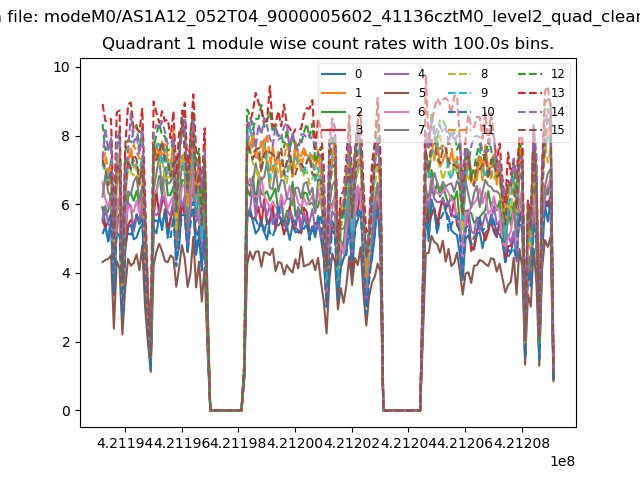
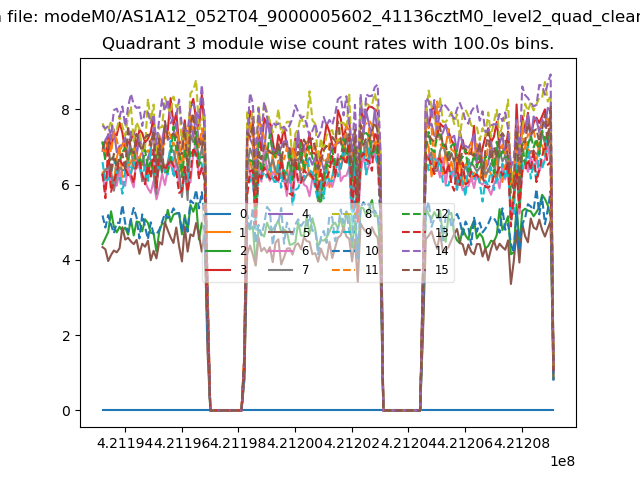
| Module-wise count rates for Quadrant A Data is divided into 100 sec bins |
 |
 |
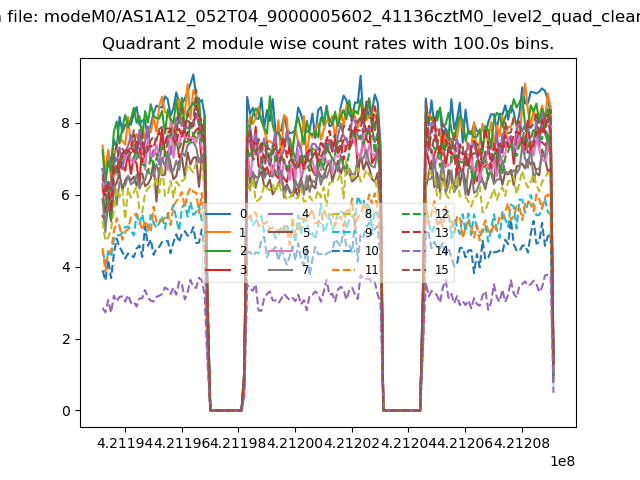
| Module-wise count rates for Quadrant B Data is divided into 100 sec bins |
 |
 |
| Module-wise count rates for Quadrant C Data is divided into 100 sec bins |
 |
 |
| Module-wise count rates for Quadrant D Data is divided into 100 sec bins |
 |
 |
| Parameter | Plot |
|---|---|
| CZT HV Monitor | 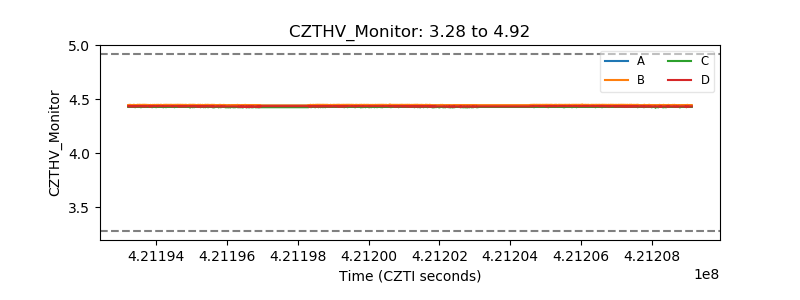 |
| D_VDD | 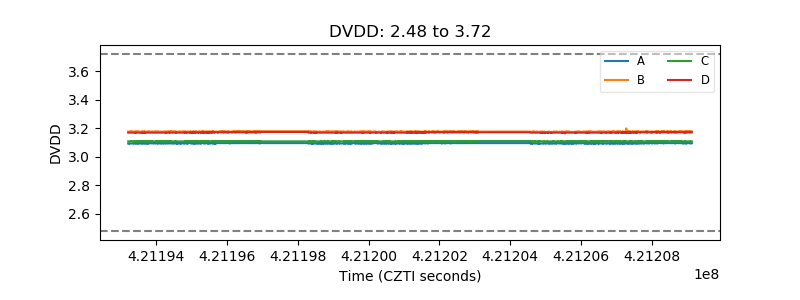 |
| Temperature 1 | 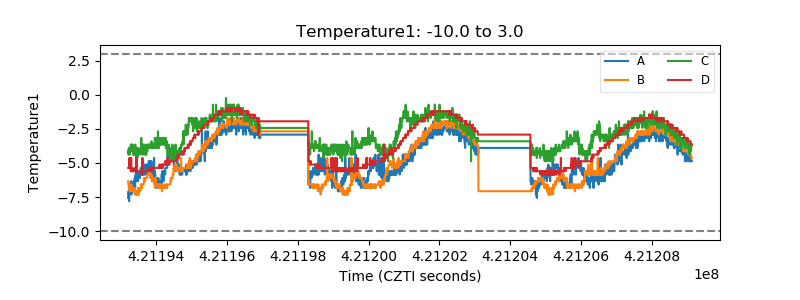 |
| Veto HV Monitor | 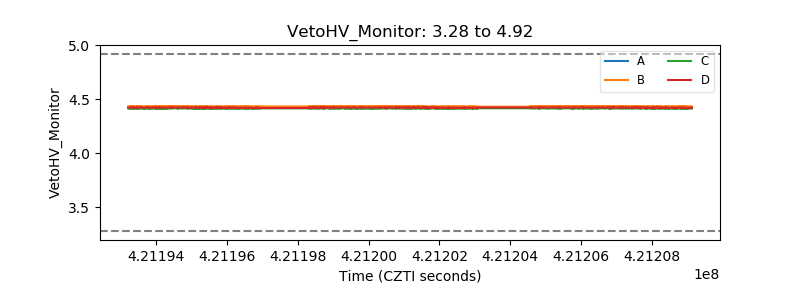 |
| Veto LLD | 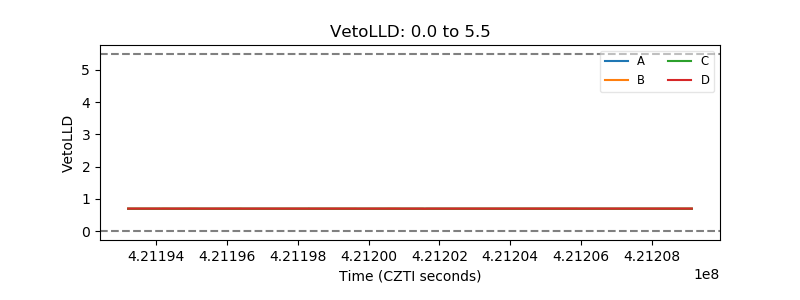 |
| Alpha Counter | 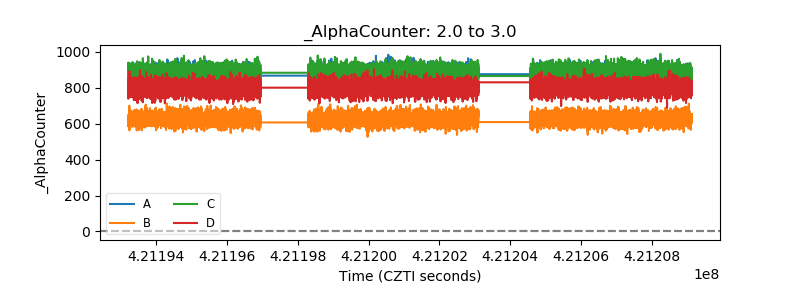 |
| _CPM_Rate | 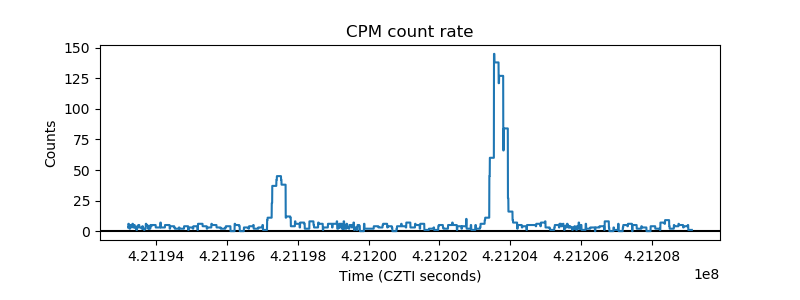 |
| CZT Counter | 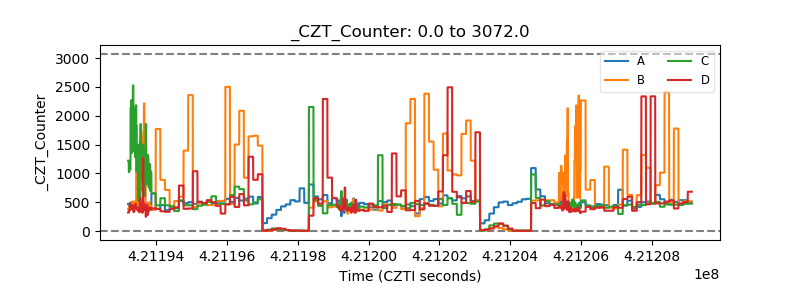 |
| +2.5 Volts monitor | 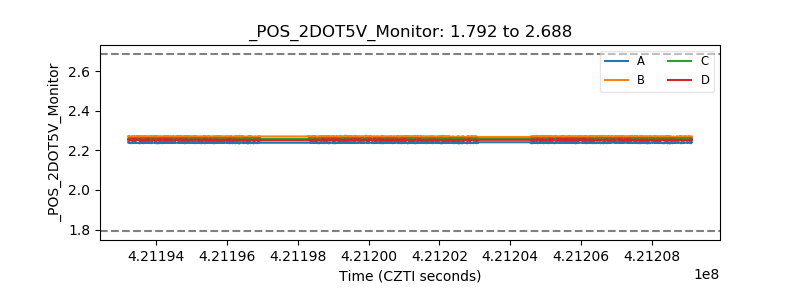 |
| +5 Volts monitor | 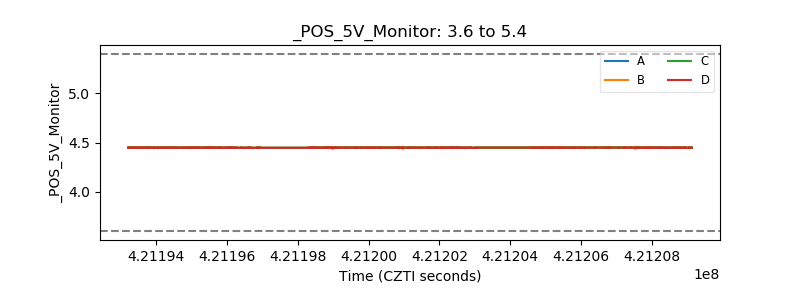 |
| _ROLL_ROT | 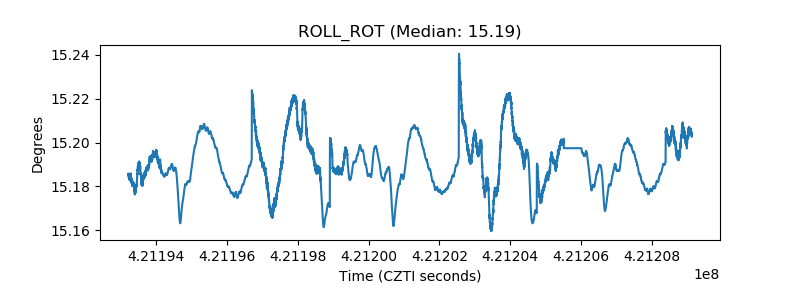 |
| _Roll_DEC | 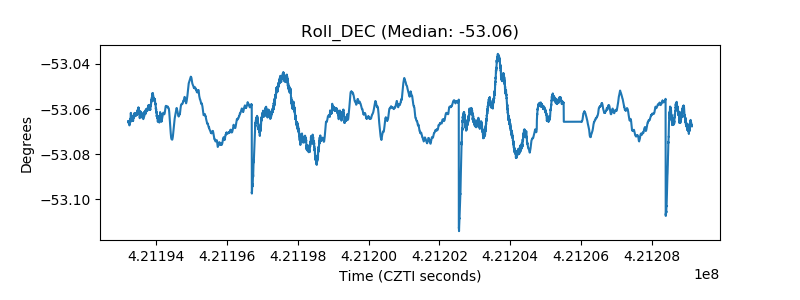 |
| _Roll_RA | 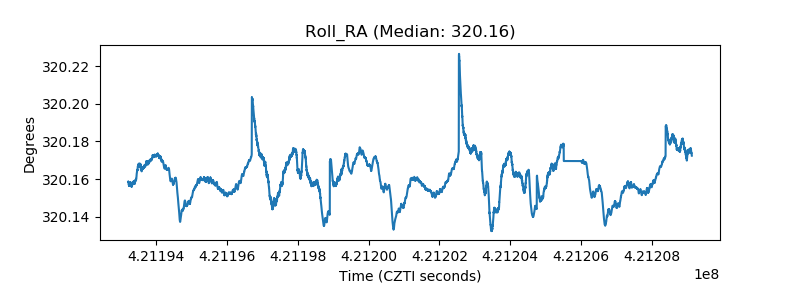 |
| Veto Counter | 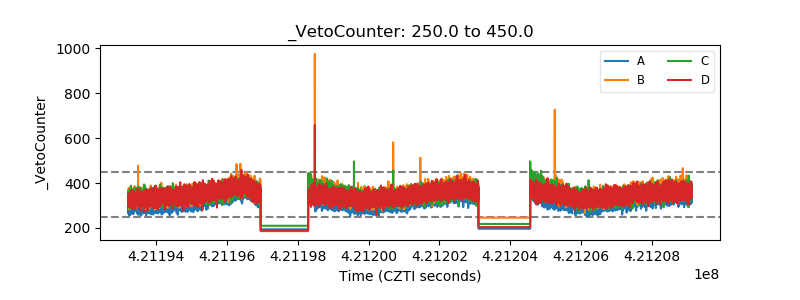 |