| Param | Original file | Final file |
|---|---|---|
| Filename | modeM0/AS1A12_052T04_9000005602_41139cztM0_level2.fits | modeM0/AS1A12_052T04_9000005602_41139cztM0_level2_quad_clean.evt |
| Size (bytes) | 678,067,200 | 156,084,480 |
| Size | 646.7 MB | 148.9 MB |
| Events in quadrant A | 5,149,608 | 1,083,439 |
| Events in quadrant B | 6,705,303 | 1,019,073 |
| Events in quadrant C | 4,885,971 | 1,056,257 |
| Events in quadrant D | 7,609,248 | 897,384 |
| Mode M0 | |||
|---|---|---|---|
| Quadrant | BADHDUFLAG | Total packets | Discarded packets |
| A | 0 | 20988 | 3 |
| B | 0 | 26741 | 2 |
| C | 0 | 20483 | 2 |
| D | 0 | 29346 | 2 |
| Mode M9 | |||
|---|---|---|---|
| Quadrant | BADHDUFLAG | Total packets | Discarded packets |
| A | 0 | 51 | 0 |
| B | 0 | 51 | 0 |
| C | 0 | 51 | 0 |
| D | 0 | 51 | 0 |
| Mode SS | |||
|---|---|---|---|
| Quadrant | BADHDUFLAG | Total packets | Discarded packets |
| A | 0 | 200 | 0 |
| B | 0 | 200 | 0 |
| C | 0 | 200 | 0 |
| D | 0 | 200 | 0 |
| Quadrant | Total seconds | Saturated seconds | Saturation percentage |
|---|---|---|---|
| A | 9663 | 15 | 0.155231% |
| B | 9663 | 892 | 9.231088% |
| C | 9663 | 56 | 0.579530% |
| D | 9663 | 1036 | 10.721308% |
Noise dominated data is calculated using 1-second bins in cleaned event files. If a bin has >2000 counts, and if more than 50% of those come from <1% of pixels, then it is considered to be noise-dominated and hence unusable.
| Quadrant | # 1 sec bins | Bins with >0 counts | Bins with >2000 counts | High rate bins dominated by noise | Noise dominated (total time) | Noise dominated (detector-on time) | Marked lightcurve |
|---|---|---|---|---|---|---|---|
| A | 14834 | 9666 | 2 | 2 | 0.01% | 0.02% |  |
| B | 14834 | 9666 | 688 | 688 | 4.64% | 7.12% |  |
| C | 14833 | 9665 | 44 | 44 | 0.30% | 0.46% |  |
| D | 14834 | 9666 | 958 | 958 | 6.46% | 9.91% |  |
Top three noisy pixels from each quadrant. If the there are fewer than three noisy pixels in the level2.evt file, extra rows are filled as -1
| Pixel properties | Quadrant properties | ||||||
|---|---|---|---|---|---|---|---|
| Quadrant | DetID | PixID | Counts | Sigma | Mean | Median | Sigma |
| A | 10 | 83 | 786750 | 3593.09 | 1075 | 1052 | 218.7 |
| A | 12 | 189 | 117203 | 531.17 | 1075 | 1052 | 218.7 |
| A | 2 | 79 | 64088 | 288.27 | 1075 | 1052 | 218.7 |
| B | 0 | 245 | 2657478 | 13543.79 | 1018 | 992 | 196.1 |
| B | 12 | 111 | 24862 | 121.7 | 1018 | 992 | 196.1 |
| B | 0 | 190 | 24752 | 121.14 | 1018 | 992 | 196.1 |
| C | 15 | 214 | 407358 | 1683.83 | 1045 | 1051 | 241.3 |
| C | 14 | 254 | 264253 | 1090.77 | 1045 | 1051 | 241.3 |
| C | 0 | 10 | 123867 | 508.98 | 1045 | 1051 | 241.3 |
| D | 2 | 249 | 1925399 | 7950.21 | 996 | 969 | 242.1 |
| D | 13 | 249 | 836546 | 3451.94 | 996 | 969 | 242.1 |
| D | 2 | 16 | 675435 | 2786.35 | 996 | 969 | 242.1 |
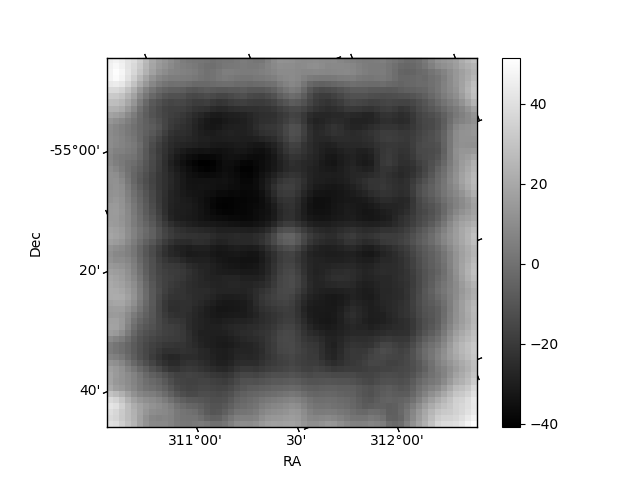
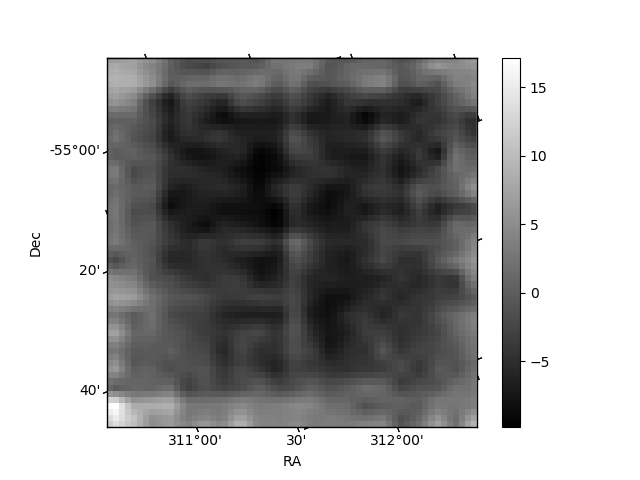
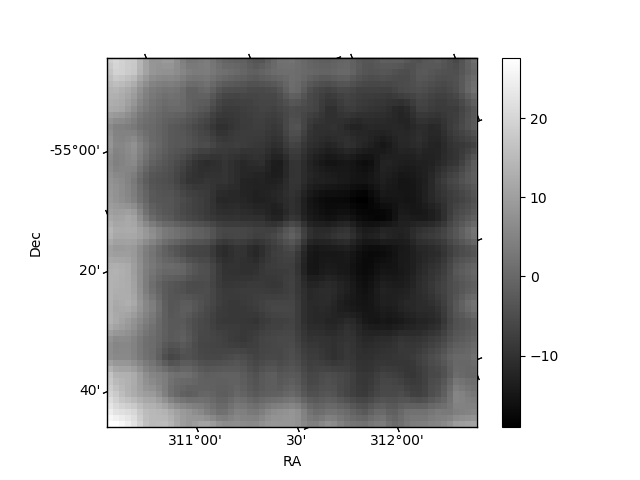
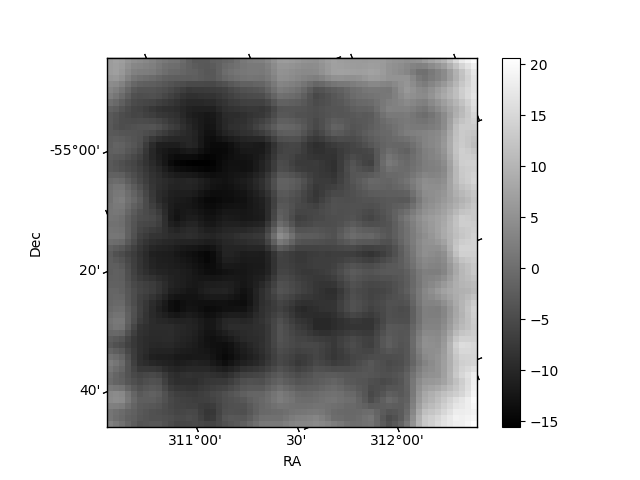
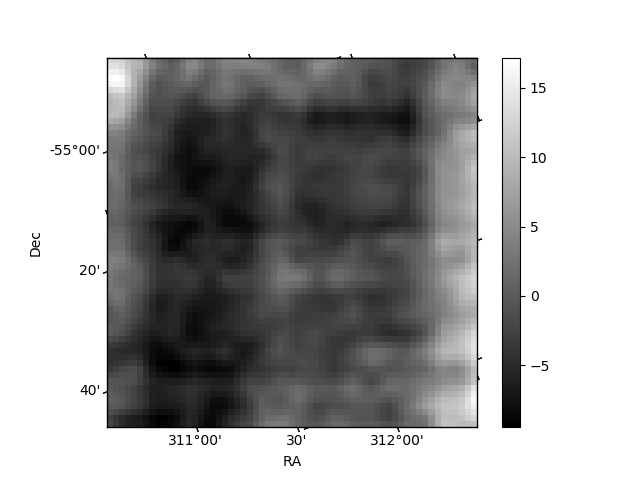
Histogram calculated using DETX and DETY for each event in the final _common_clean file
| Quadrant A | 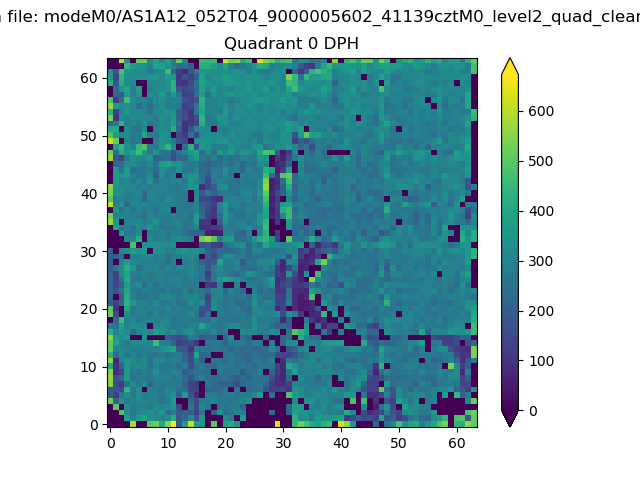 |
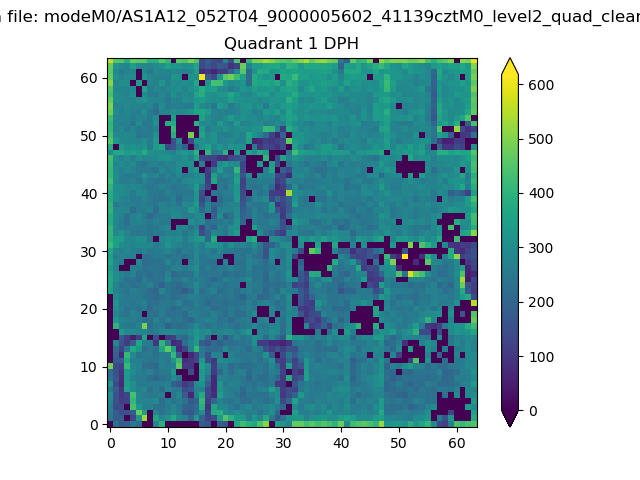 |
Quadrant B |
|---|---|---|---|
| Quadrant D | 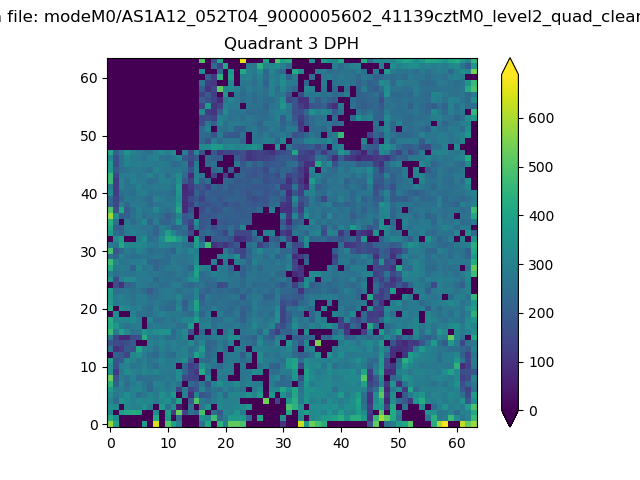 |
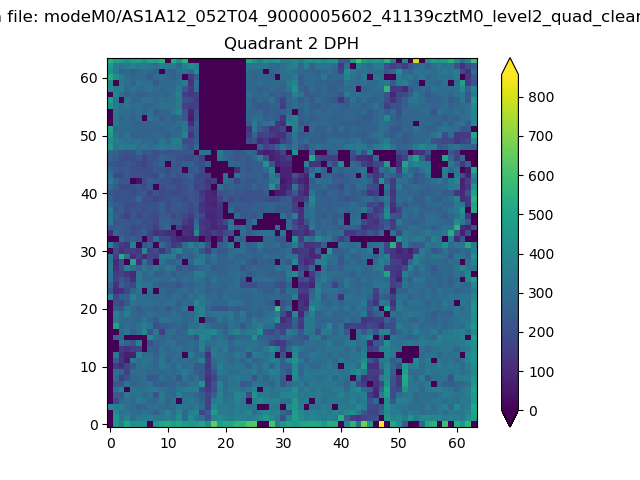 |
Quadrant C |
| Plot type | Count rate plots | Images |
|---|---|---|
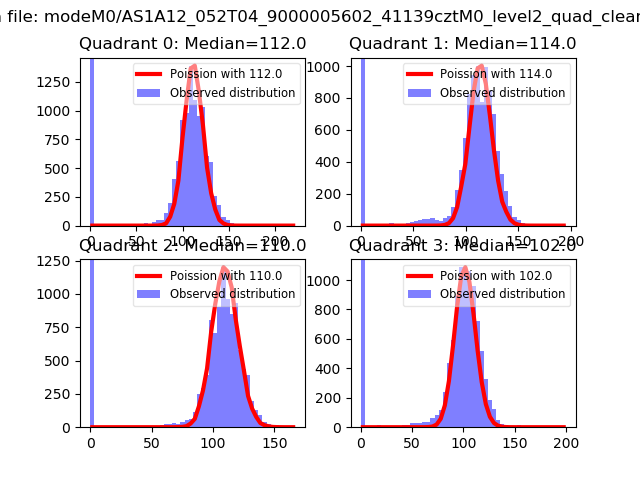
| Comparison with Poisson distribution Blue bars denote a histogram of data divided into 1 sec bins. Red curve is a Poisson curve with rate = median count rate of data. |
 |
 |
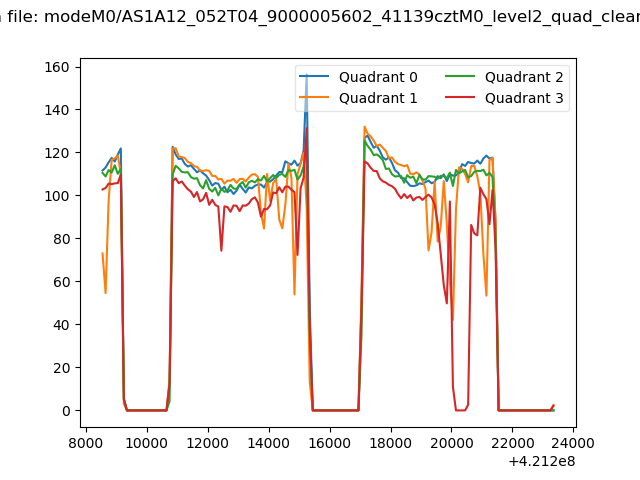
| Quadrant-wise count rates Data is divided into 100 sec bins |
 |
|
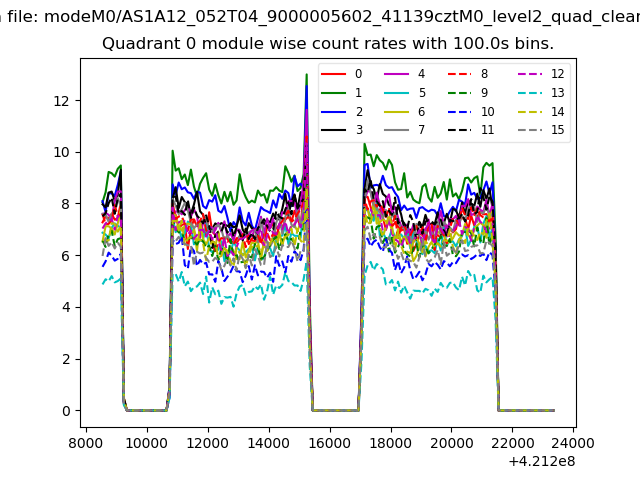
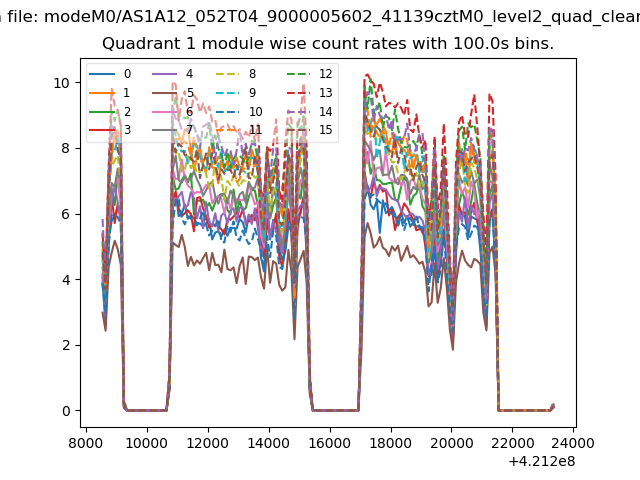
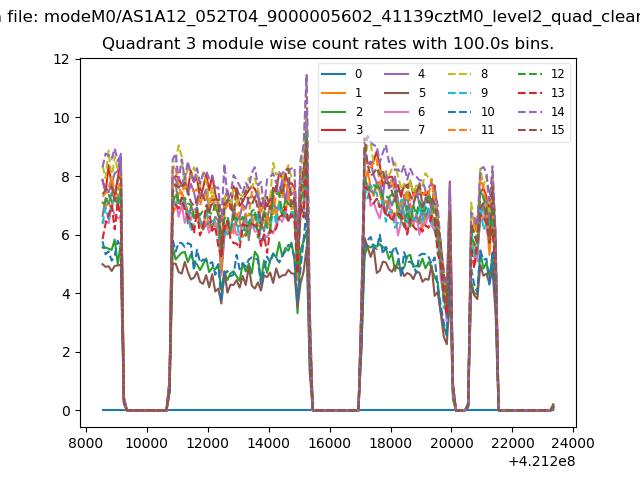
| Module-wise count rates for Quadrant A Data is divided into 100 sec bins |
 |
 |
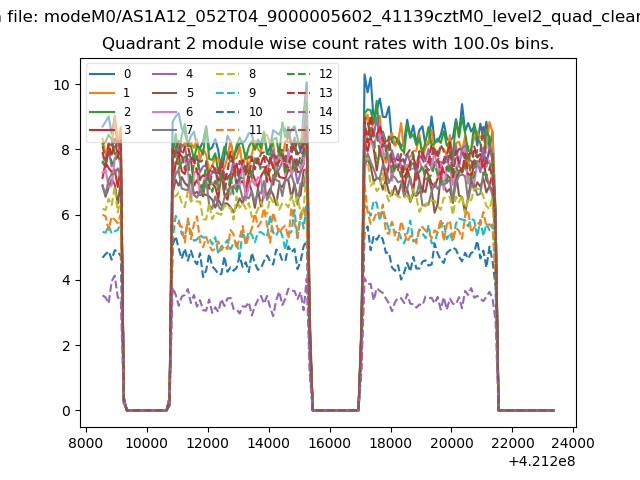
| Module-wise count rates for Quadrant B Data is divided into 100 sec bins |
 |
 |
| Module-wise count rates for Quadrant C Data is divided into 100 sec bins |
 |
 |
| Module-wise count rates for Quadrant D Data is divided into 100 sec bins |
 |
 |
| Parameter | Plot |
|---|---|
| CZT HV Monitor | 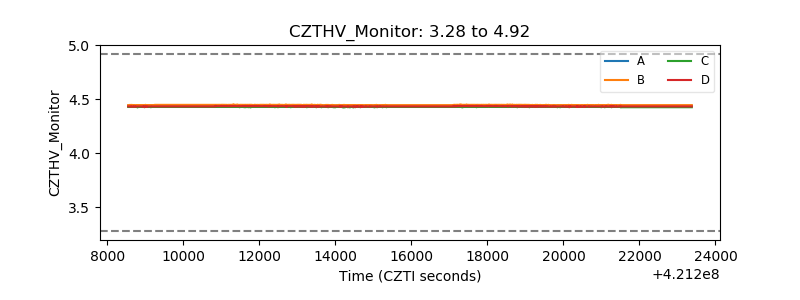 |
| D_VDD | 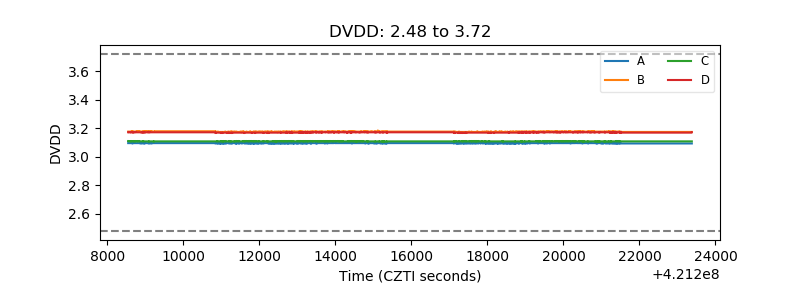 |
| Temperature 1 | 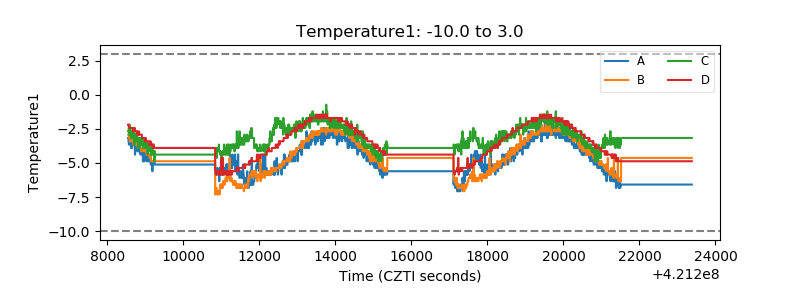 |
| Veto HV Monitor | 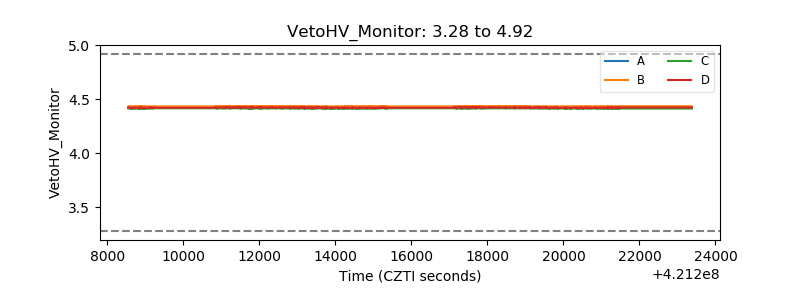 |
| Veto LLD | 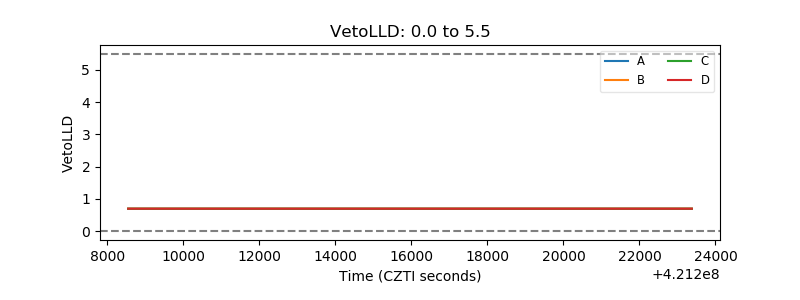 |
| Alpha Counter | 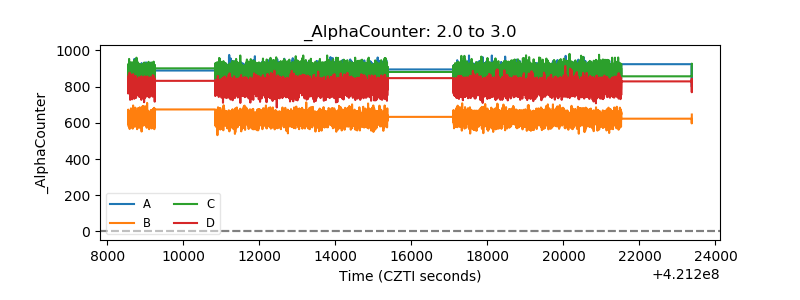 |
| _CPM_Rate | 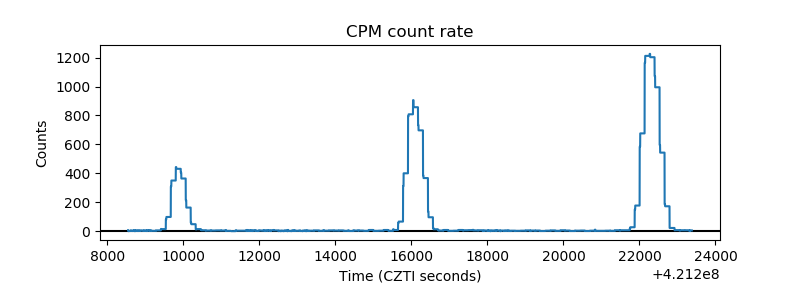 |
| CZT Counter | 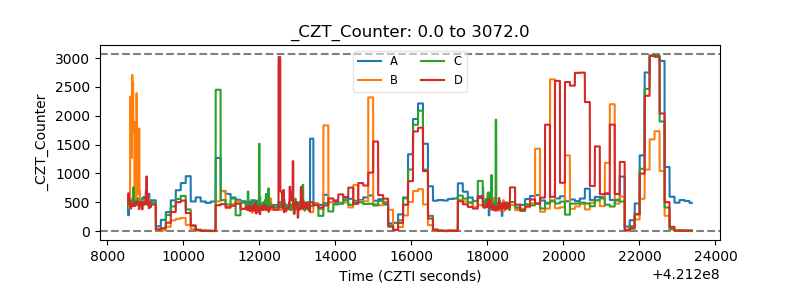 |
| +2.5 Volts monitor | 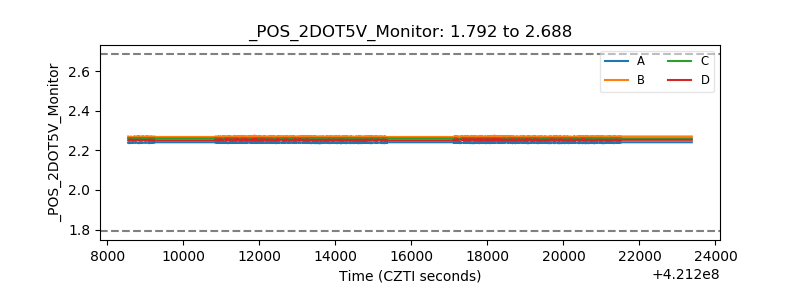 |
| +5 Volts monitor | 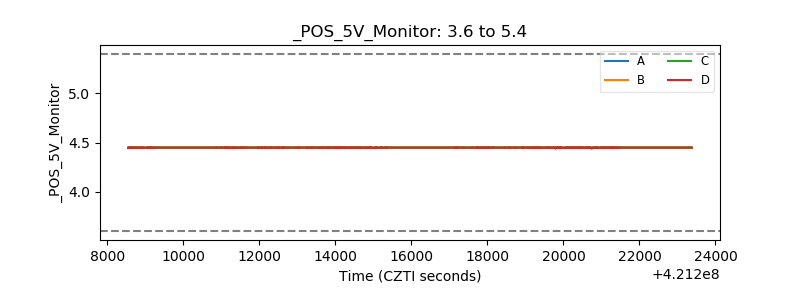 |
| _ROLL_ROT | 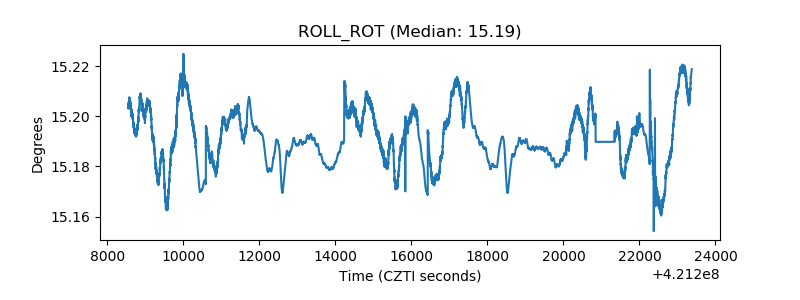 |
| _Roll_DEC | 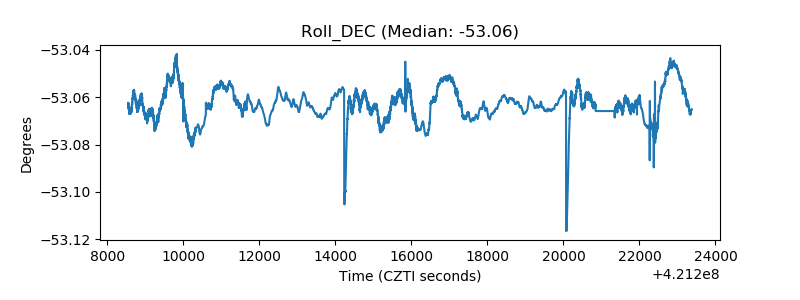 |
| _Roll_RA | 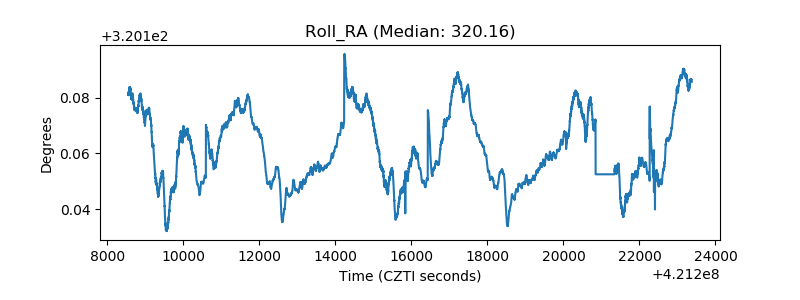 |
| Veto Counter | 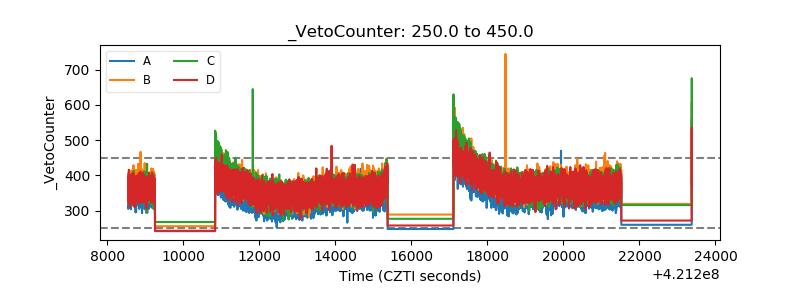 |