| Param | Original file | Final file |
|---|---|---|
| Filename | modeM0/AS1A12_052T04_9000005602_41140cztM0_level2.fits | modeM0/AS1A12_052T04_9000005602_41140cztM0_level2_quad_clean.evt |
| Size (bytes) | 357,888,960 | 97,179,840 |
| Size | 341.3 MB | 92.7 MB |
| Events in quadrant A | 3,148,356 | 666,706 |
| Events in quadrant B | 3,583,351 | 641,929 |
| Events in quadrant C | 2,801,352 | 651,412 |
| Events in quadrant D | 3,291,177 | 601,632 |
| Mode M0 | |||
|---|---|---|---|
| Quadrant | BADHDUFLAG | Total packets | Discarded packets |
| A | 0 | 12506 | 3 |
| B | 0 | 14193 | 2 |
| C | 0 | 11564 | 2 |
| D | 0 | 13362 | 2 |
| Mode M9 | |||
|---|---|---|---|
| Quadrant | BADHDUFLAG | Total packets | Discarded packets |
| A | 0 | 30 | 0 |
| B | 0 | 30 | 0 |
| C | 0 | 30 | 0 |
| D | 0 | 31 | 0 |
| Mode SS | |||
|---|---|---|---|
| Quadrant | BADHDUFLAG | Total packets | Discarded packets |
| A | 0 | 112 | 0 |
| B | 0 | 112 | 0 |
| C | 0 | 112 | 0 |
| D | 0 | 112 | 0 |
| Quadrant | Total seconds | Saturated seconds | Saturation percentage |
|---|---|---|---|
| A | 5442 | 34 | 0.624770% |
| B | 5442 | 369 | 6.780595% |
| C | 5442 | 49 | 0.900404% |
| D | 5442 | 102 | 1.874311% |
Noise dominated data is calculated using 1-second bins in cleaned event files. If a bin has >2000 counts, and if more than 50% of those come from <1% of pixels, then it is considered to be noise-dominated and hence unusable.
| Quadrant | # 1 sec bins | Bins with >0 counts | Bins with >2000 counts | High rate bins dominated by noise | Noise dominated (total time) | Noise dominated (detector-on time) | Marked lightcurve |
|---|---|---|---|---|---|---|---|
| A | 7446 | 5443 | 22 | 22 | 0.30% | 0.40% | 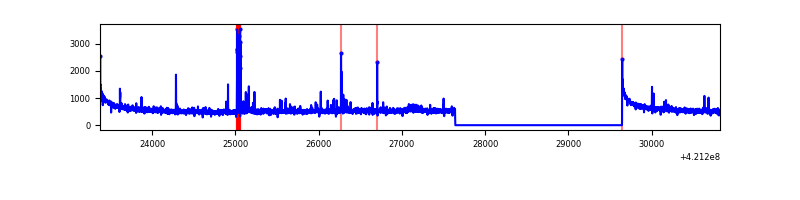 |
| B | 7446 | 5443 | 296 | 296 | 3.98% | 5.44% | 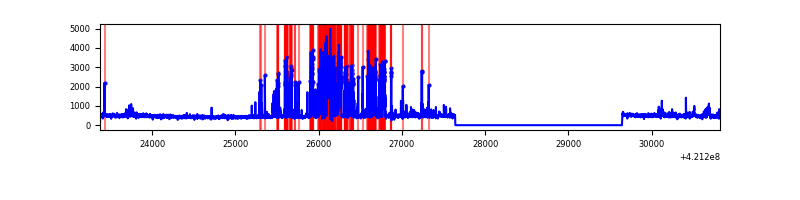 |
| C | 7446 | 5443 | 42 | 42 | 0.56% | 0.77% | 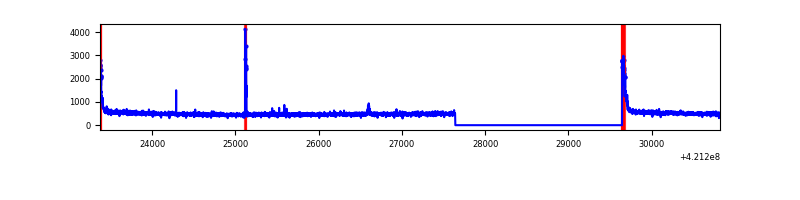 |
| D | 7446 | 5443 | 89 | 89 | 1.20% | 1.64% | 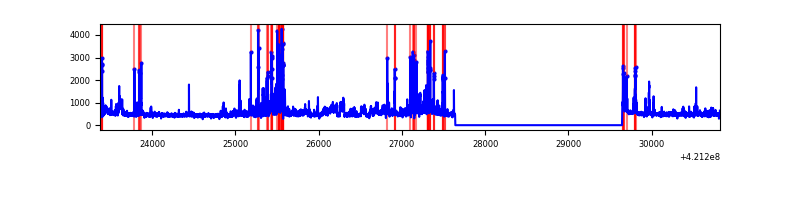 |
Top three noisy pixels from each quadrant. If the there are fewer than three noisy pixels in the level2.evt file, extra rows are filled as -1
| Pixel properties | Quadrant properties | ||||||
|---|---|---|---|---|---|---|---|
| Quadrant | DetID | PixID | Counts | Sigma | Mean | Median | Sigma |
| A | 10 | 83 | 520871 | 4084.99 | 633 | 620 | 127.4 |
| A | 4 | 0 | 66784 | 519.51 | 633 | 620 | 127.4 |
| A | 2 | 79 | 48076 | 372.62 | 633 | 620 | 127.4 |
| B | 0 | 245 | 1157768 | 10067.81 | 603 | 588 | 114.9 |
| B | 0 | 190 | 33930 | 290.09 | 603 | 588 | 114.9 |
| B | 5 | 255 | 18705 | 157.62 | 603 | 588 | 114.9 |
| C | 15 | 214 | 234258 | 1640.27 | 614 | 619 | 142.4 |
| C | 0 | 10 | 135835 | 949.29 | 614 | 619 | 142.4 |
| C | 12 | 249 | 26664 | 182.85 | 614 | 619 | 142.4 |
| D | 2 | 16 | 266714 | 1781.81 | 620 | 603 | 149.3 |
| D | 13 | 249 | 199581 | 1332.31 | 620 | 603 | 149.3 |
| D | 2 | 249 | 199548 | 1332.08 | 620 | 603 | 149.3 |
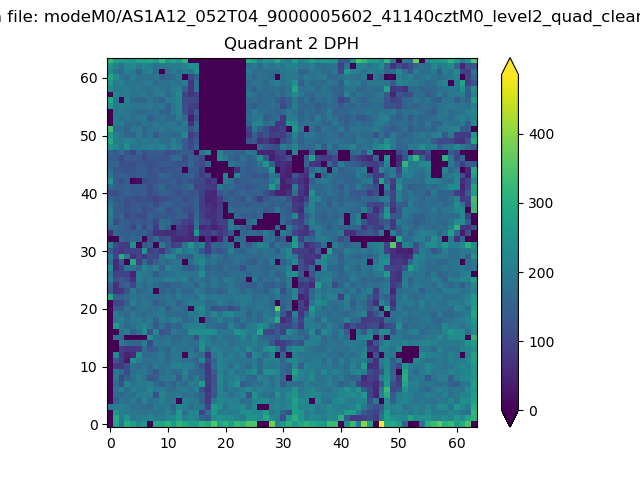
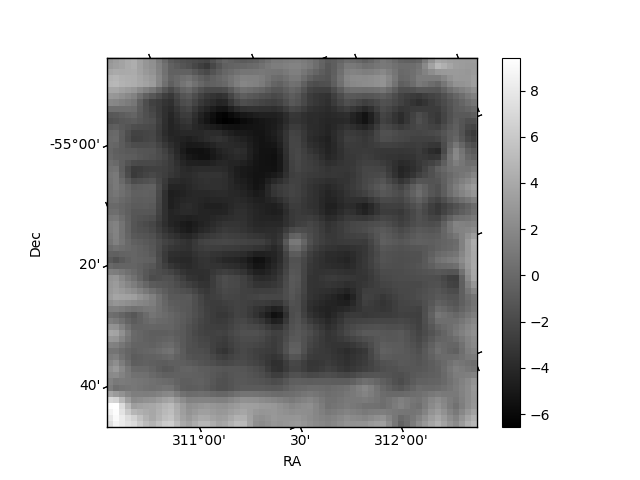
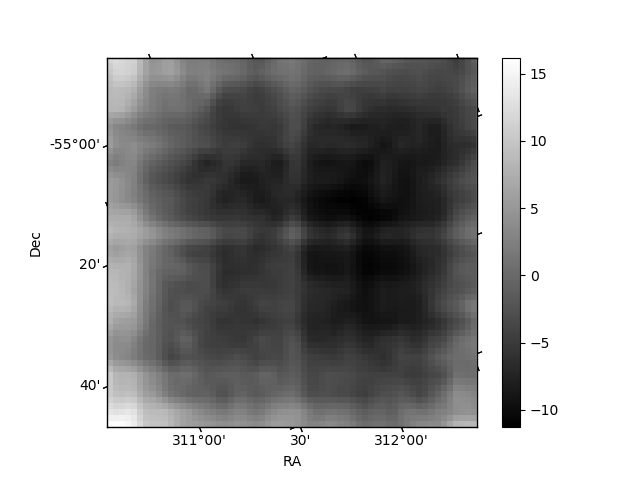
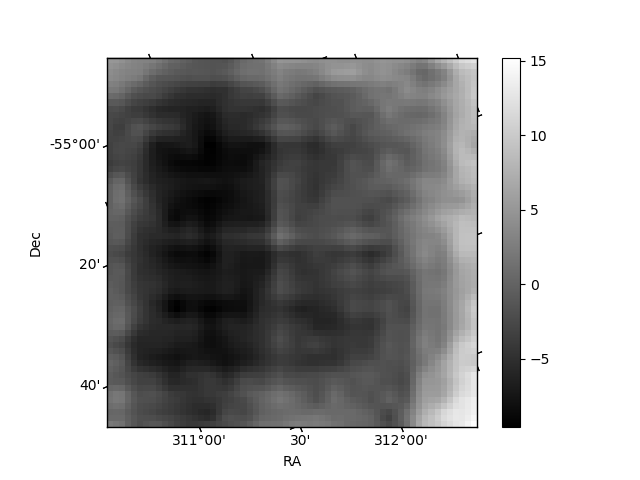
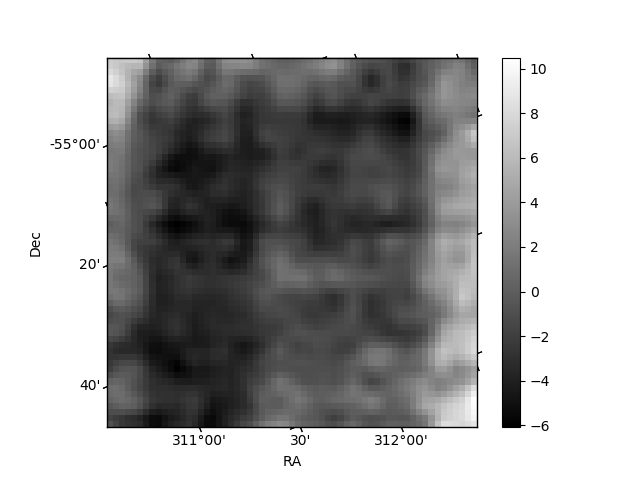
Histogram calculated using DETX and DETY for each event in the final _common_clean file
| Quadrant A | 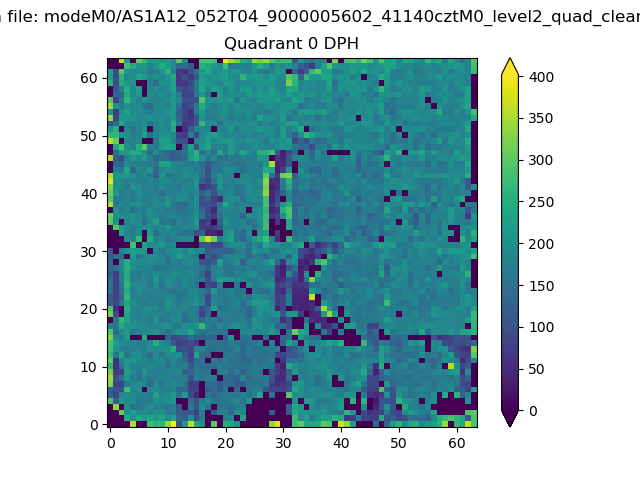 |
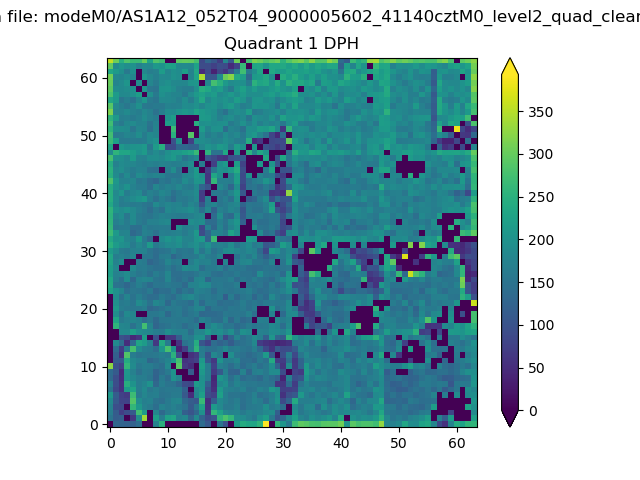 |
Quadrant B |
|---|---|---|---|
| Quadrant D | 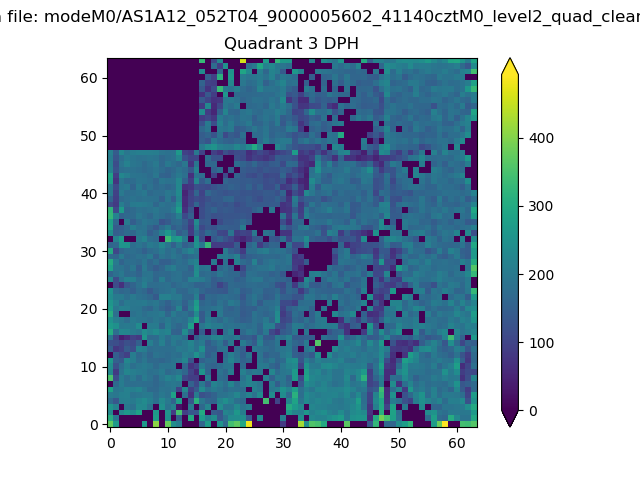 |
 |
Quadrant C |
| Plot type | Count rate plots | Images |
|---|---|---|
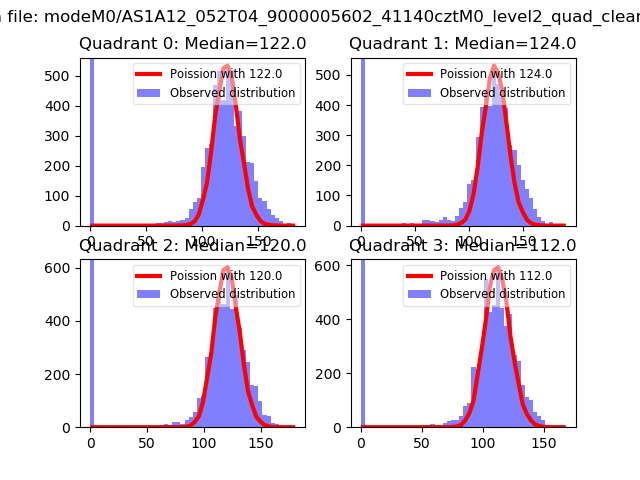
| Comparison with Poisson distribution Blue bars denote a histogram of data divided into 1 sec bins. Red curve is a Poisson curve with rate = median count rate of data. |
 |
 |
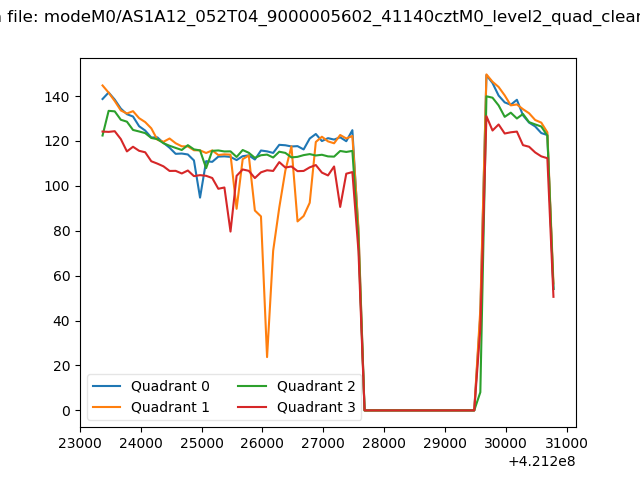
| Quadrant-wise count rates Data is divided into 100 sec bins |
 |
|
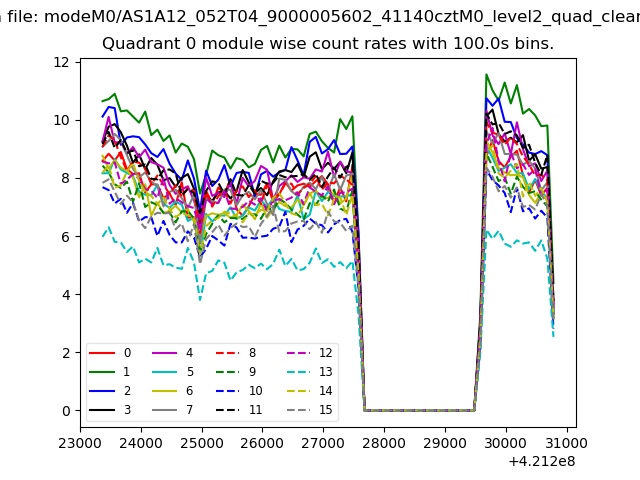
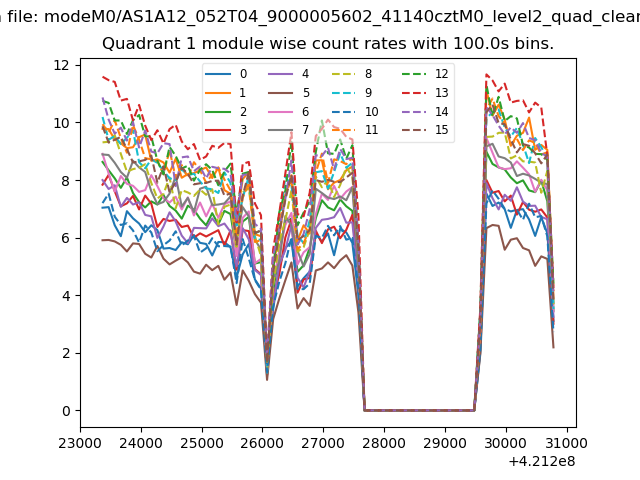
| Module-wise count rates for Quadrant A Data is divided into 100 sec bins |
 |
 |
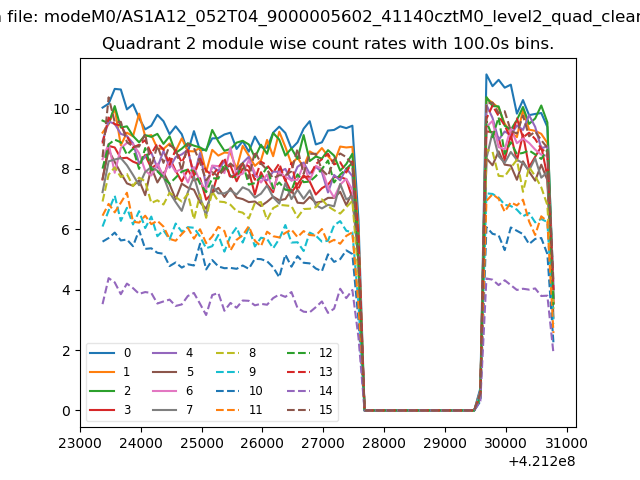
| Module-wise count rates for Quadrant B Data is divided into 100 sec bins |
 |
 |
| Module-wise count rates for Quadrant C Data is divided into 100 sec bins |
 |
 |
| Module-wise count rates for Quadrant D Data is divided into 100 sec bins |
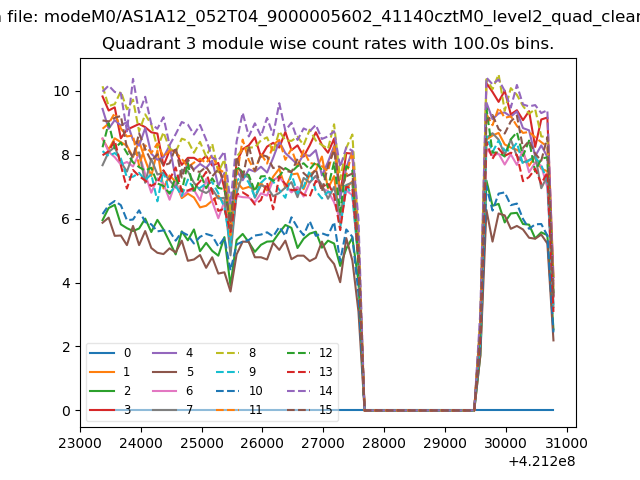 |
 |
| Parameter | Plot |
|---|---|
| CZT HV Monitor | 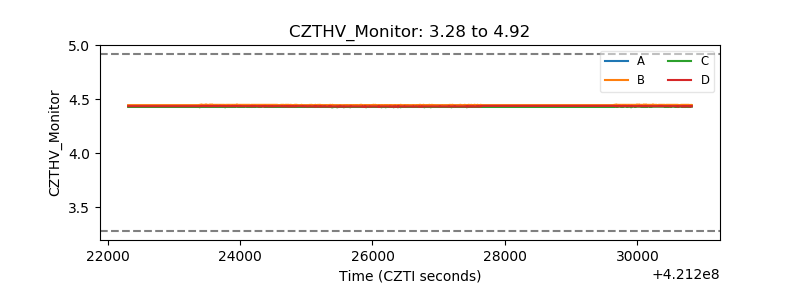 |
| D_VDD | 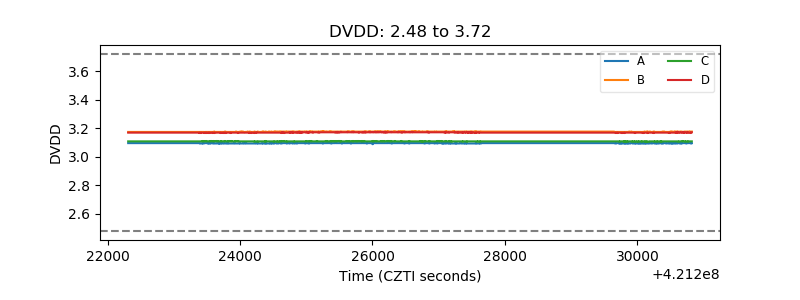 |
| Temperature 1 | 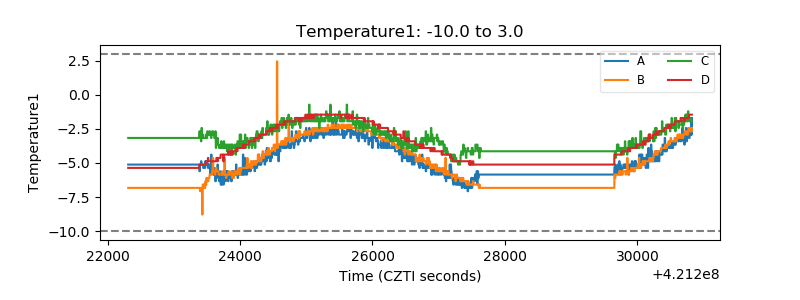 |
| Veto HV Monitor | 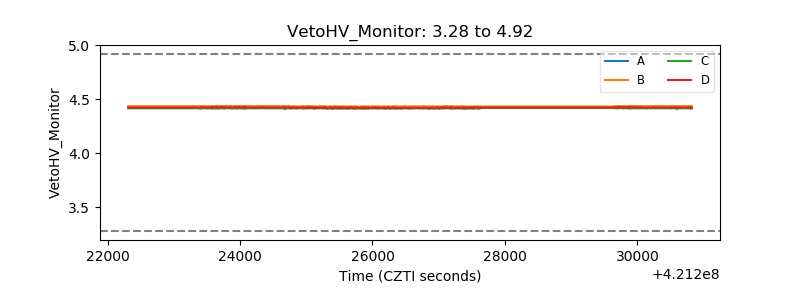 |
| Veto LLD | 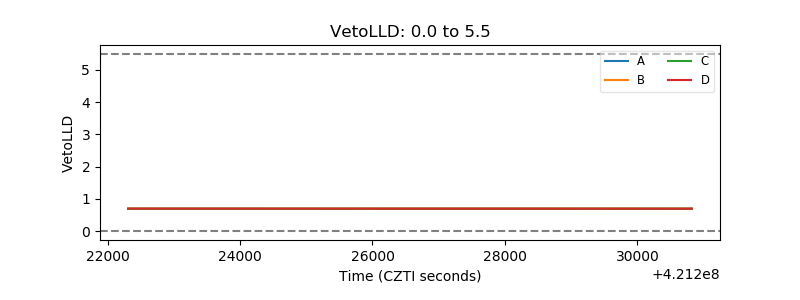 |
| Alpha Counter | 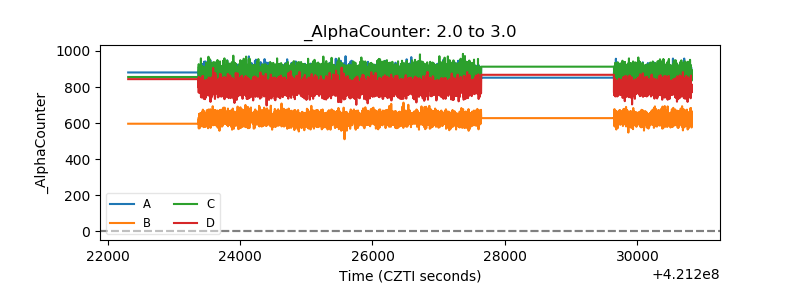 |
| _CPM_Rate | 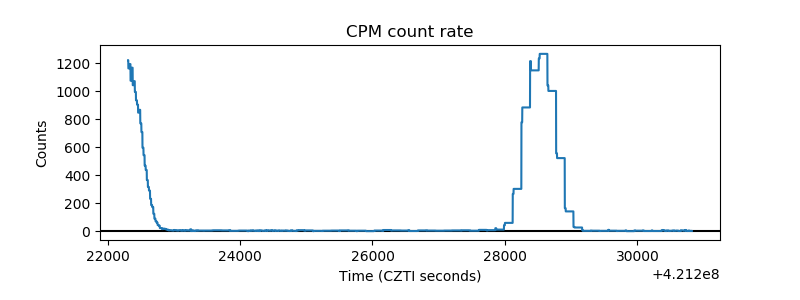 |
| CZT Counter | 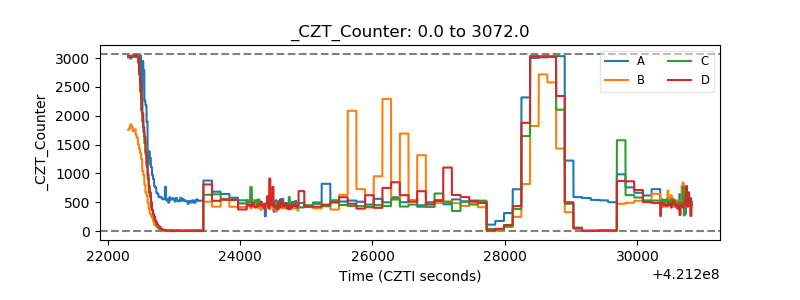 |
| +2.5 Volts monitor | 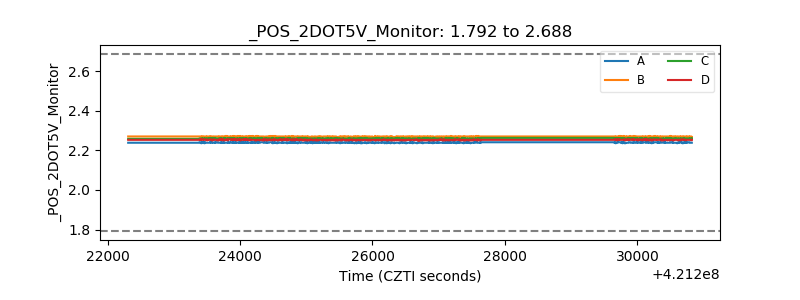 |
| +5 Volts monitor |  |
| _ROLL_ROT | 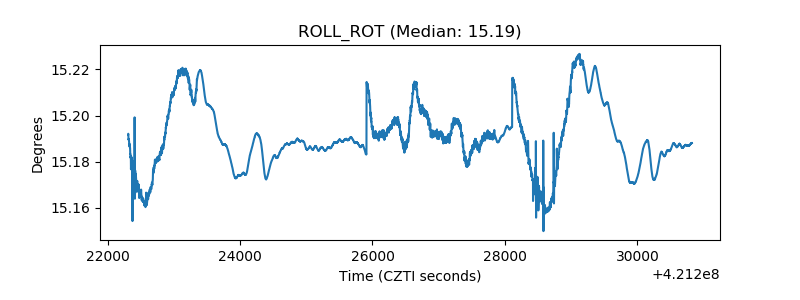 |
| _Roll_DEC | 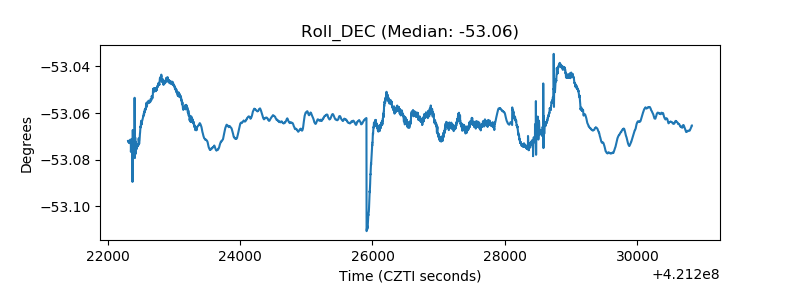 |
| _Roll_RA | 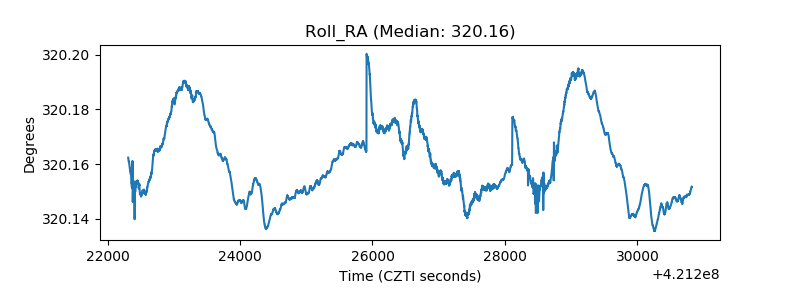 |
| Veto Counter | 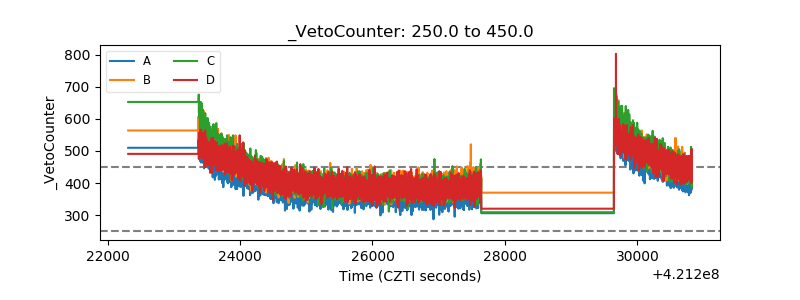 |