| Param | Original file | Final file |
|---|---|---|
| Filename | modeM0/AS1A12_052T04_9000005602_41141cztM0_level2.fits | modeM0/AS1A12_052T04_9000005602_41141cztM0_level2_quad_clean.evt |
| Size (bytes) | 329,587,200 | 94,703,040 |
| Size | 314.3 MB | 90.3 MB |
| Events in quadrant A | 2,875,704 | 652,186 |
| Events in quadrant B | 2,992,631 | 647,109 |
| Events in quadrant C | 2,692,984 | 629,408 |
| Events in quadrant D | 3,237,423 | 577,978 |
| Mode M0 | |||
|---|---|---|---|
| Quadrant | BADHDUFLAG | Total packets | Discarded packets |
| A | 0 | 11477 | 3 |
| B | 0 | 12102 | 2 |
| C | 0 | 10959 | 2 |
| D | 0 | 12942 | 2 |
| Mode M9 | |||
|---|---|---|---|
| Quadrant | BADHDUFLAG | Total packets | Discarded packets |
| A | 0 | 20 | 0 |
| B | 0 | 20 | 0 |
| C | 0 | 20 | 0 |
| D | 0 | 20 | 0 |
| Mode SS | |||
|---|---|---|---|
| Quadrant | BADHDUFLAG | Total packets | Discarded packets |
| A | 0 | 106 | 0 |
| B | 0 | 106 | 0 |
| C | 0 | 106 | 0 |
| D | 0 | 106 | 0 |
| Quadrant | Total seconds | Saturated seconds | Saturation percentage |
|---|---|---|---|
| A | 5157 | 7 | 0.135738% |
| B | 5157 | 122 | 2.365717% |
| C | 5157 | 40 | 0.775645% |
| D | 5157 | 140 | 2.714757% |
Noise dominated data is calculated using 1-second bins in cleaned event files. If a bin has >2000 counts, and if more than 50% of those come from <1% of pixels, then it is considered to be noise-dominated and hence unusable.
| Quadrant | # 1 sec bins | Bins with >0 counts | Bins with >2000 counts | High rate bins dominated by noise | Noise dominated (total time) | Noise dominated (detector-on time) | Marked lightcurve |
|---|---|---|---|---|---|---|---|
| A | 7220 | 5158 | 1 | 1 | 0.01% | 0.02% | 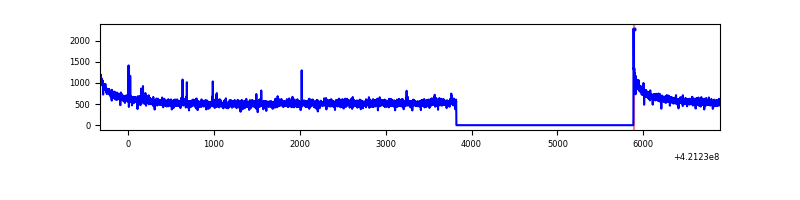 |
| B | 7220 | 5158 | 95 | 95 | 1.32% | 1.84% | 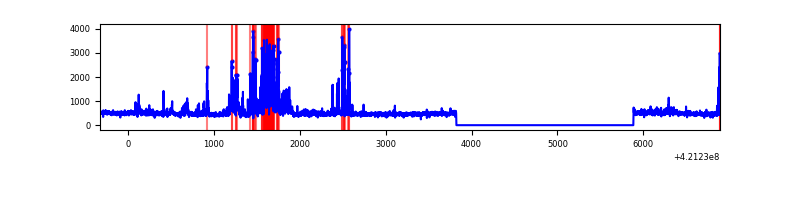 |
| C | 7220 | 5158 | 34 | 34 | 0.47% | 0.66% | 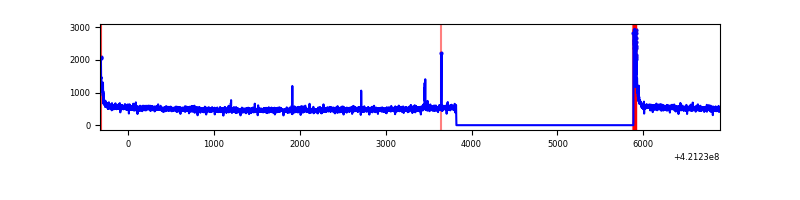 |
| D | 7220 | 5158 | 111 | 111 | 1.54% | 2.15% | 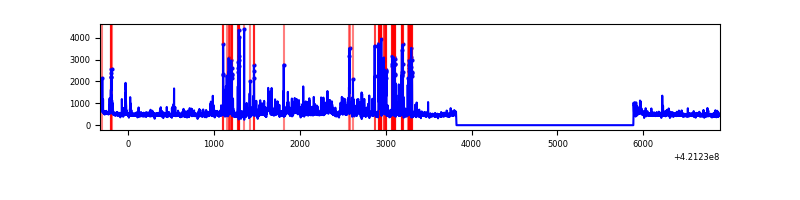 |
Top three noisy pixels from each quadrant. If the there are fewer than three noisy pixels in the level2.evt file, extra rows are filled as -1
| Pixel properties | Quadrant properties | ||||||
|---|---|---|---|---|---|---|---|
| Quadrant | DetID | PixID | Counts | Sigma | Mean | Median | Sigma |
| A | 10 | 83 | 488475 | 3951.79 | 611 | 600 | 123.5 |
| A | 2 | 79 | 17640 | 138.02 | 611 | 600 | 123.5 |
| A | 13 | 254 | 8176 | 61.37 | 611 | 600 | 123.5 |
| B | 0 | 245 | 279929 | 2498.74 | 592 | 577 | 111.8 |
| B | 0 | 186 | 277922 | 2480.79 | 592 | 577 | 111.8 |
| B | 5 | 255 | 76232 | 676.72 | 592 | 577 | 111.8 |
| C | 15 | 214 | 221591 | 1640.35 | 589 | 593 | 134.7 |
| C | 0 | 10 | 133215 | 984.38 | 589 | 593 | 134.7 |
| C | 9 | 54 | 18919 | 136.02 | 589 | 593 | 134.7 |
| D | 13 | 249 | 438514 | 3072.54 | 593 | 579 | 142.5 |
| D | 2 | 16 | 310655 | 2175.49 | 593 | 579 | 142.5 |
| D | 2 | 153 | 54304 | 376.93 | 593 | 579 | 142.5 |
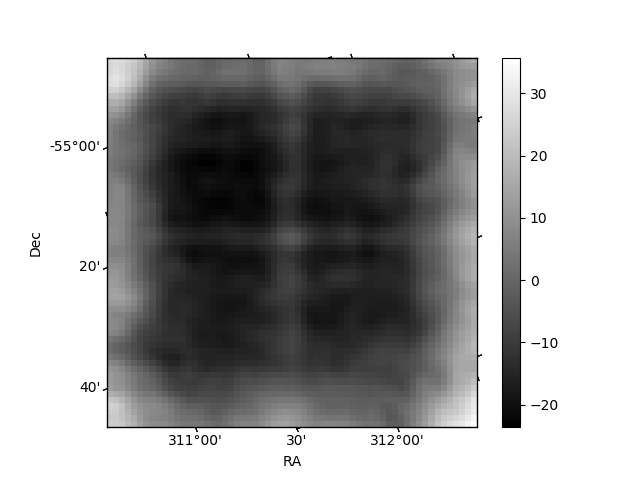
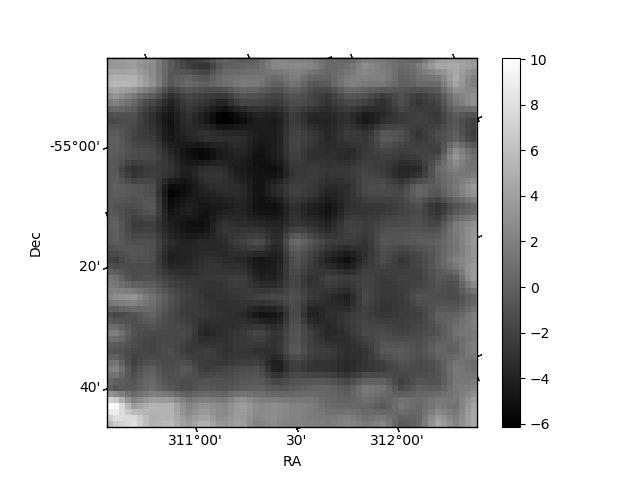
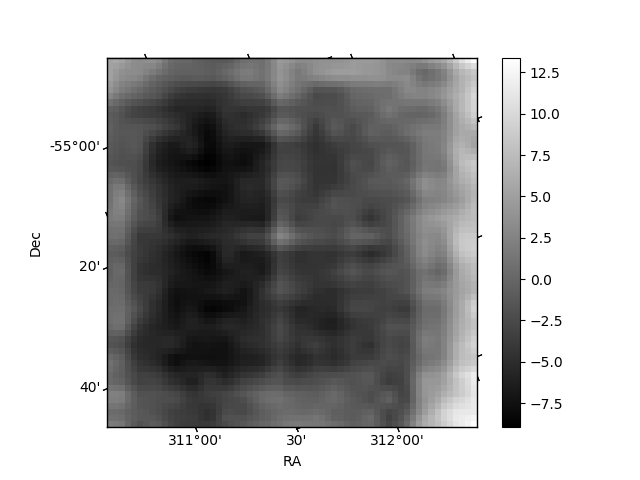
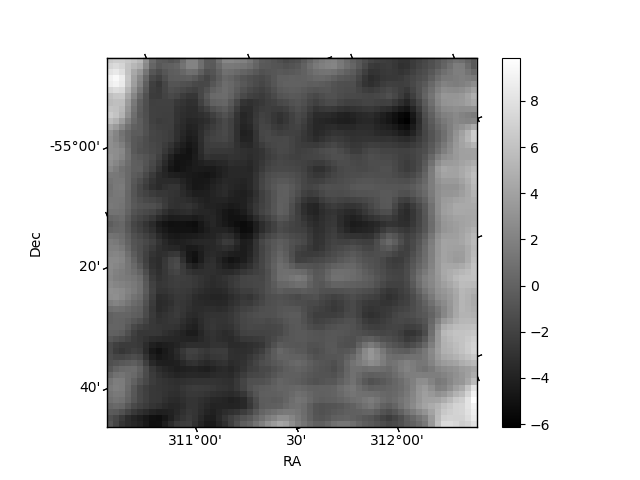
Histogram calculated using DETX and DETY for each event in the final _common_clean file
| Quadrant A | 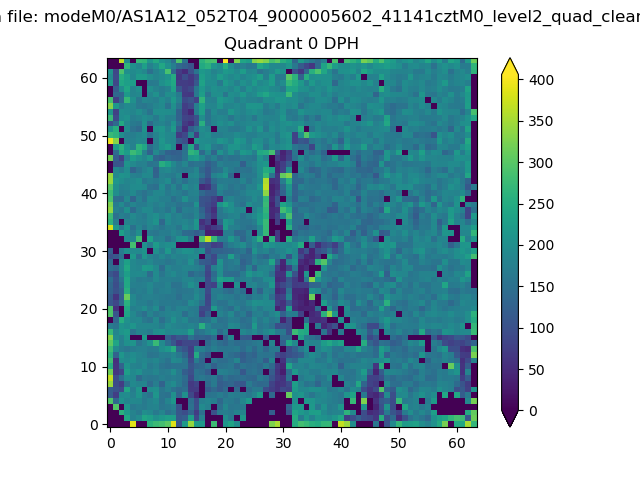 |
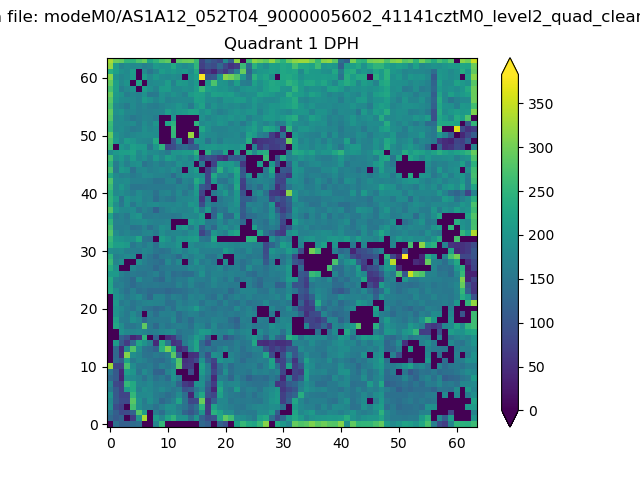 |
Quadrant B |
|---|---|---|---|
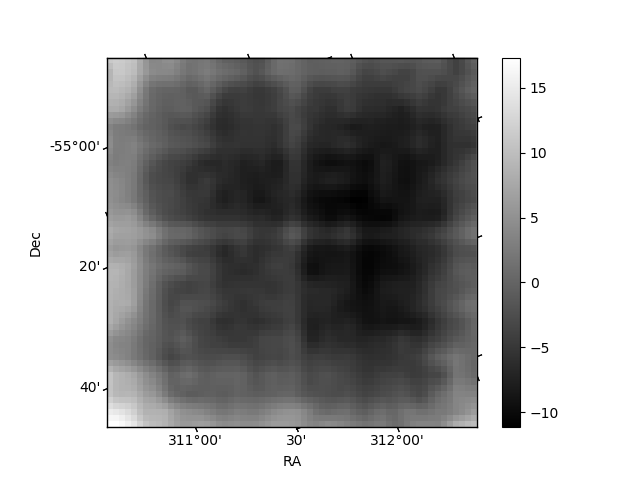
| Quadrant D | 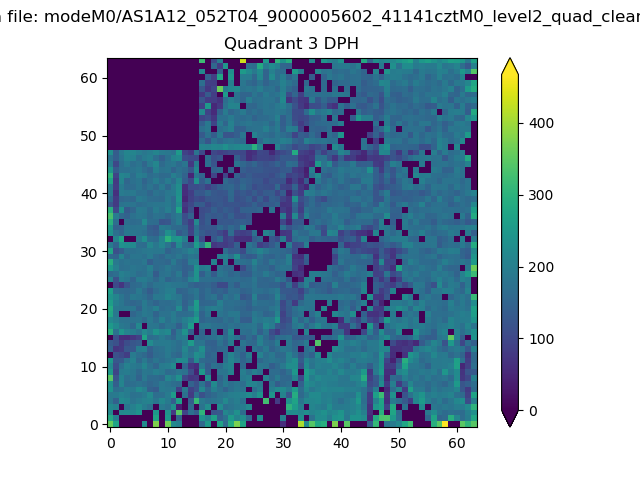 |
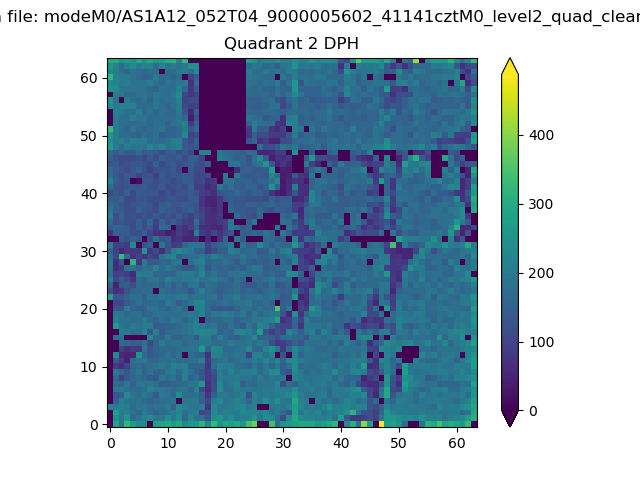 |
Quadrant C |
| Plot type | Count rate plots | Images |
|---|---|---|
| Comparison with Poisson distribution Blue bars denote a histogram of data divided into 1 sec bins. Red curve is a Poisson curve with rate = median count rate of data. |
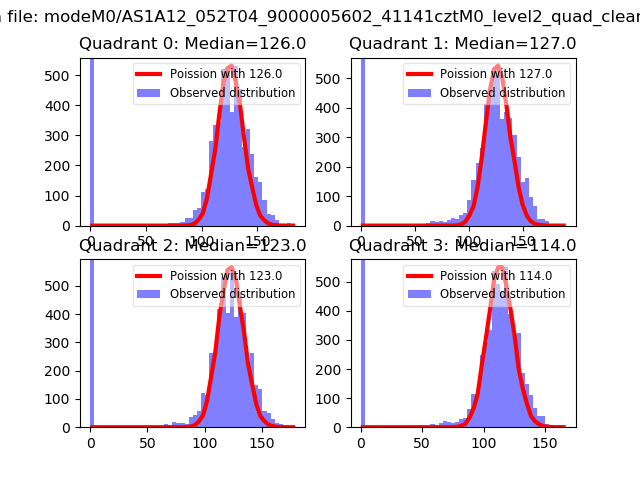 |
 |
| Quadrant-wise count rates Data is divided into 100 sec bins |
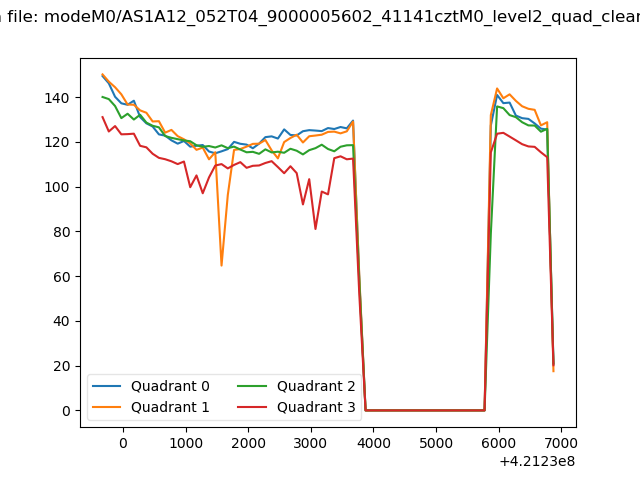 |
|
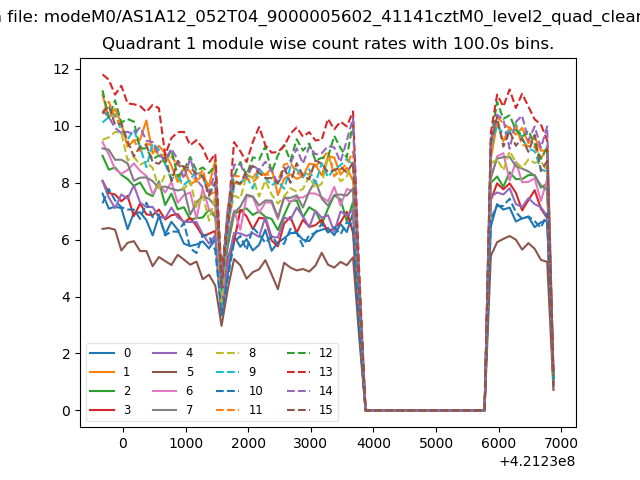
| Module-wise count rates for Quadrant A Data is divided into 100 sec bins |
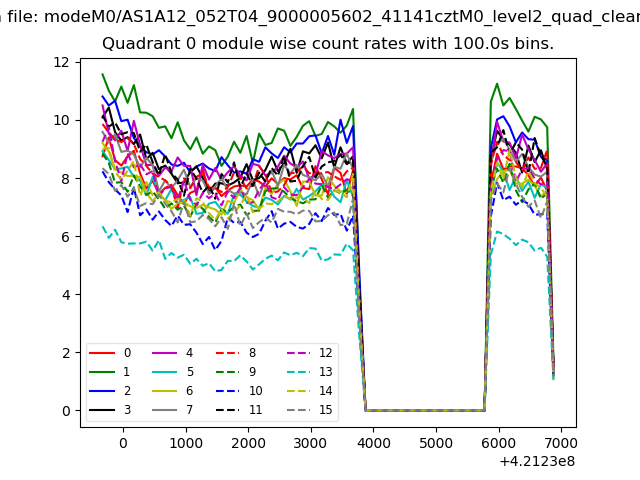 |
 |
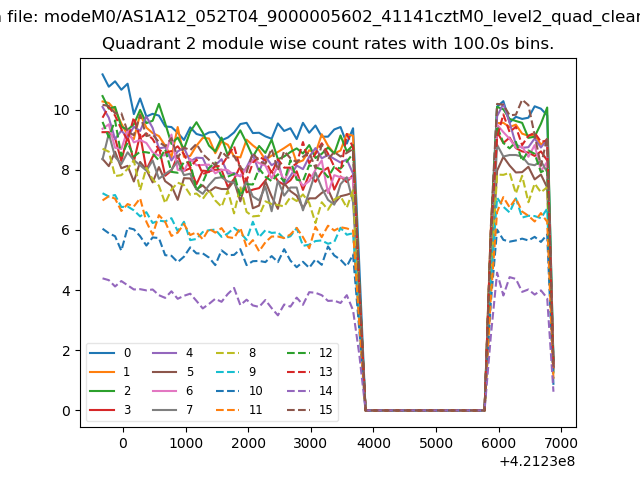
| Module-wise count rates for Quadrant B Data is divided into 100 sec bins |
 |
 |
| Module-wise count rates for Quadrant C Data is divided into 100 sec bins |
 |
 |
| Module-wise count rates for Quadrant D Data is divided into 100 sec bins |
 |
 |
| Parameter | Plot |
|---|---|
| CZT HV Monitor | 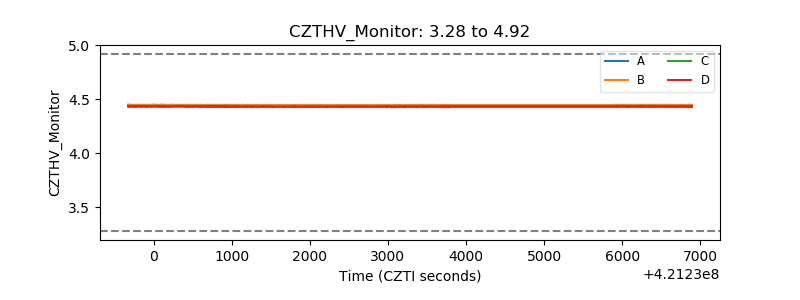 |
| D_VDD | 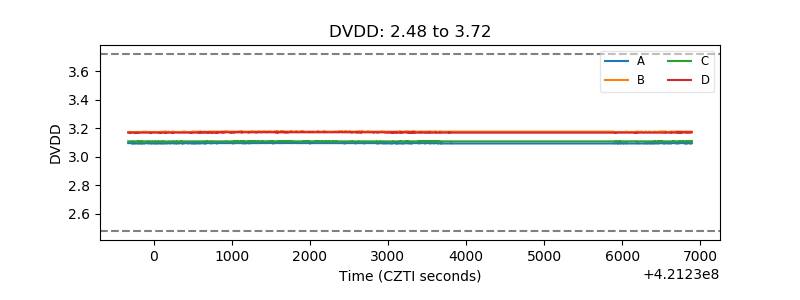 |
| Temperature 1 | 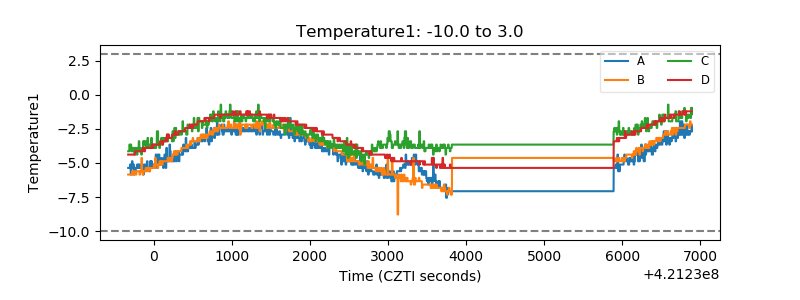 |
| Veto HV Monitor | 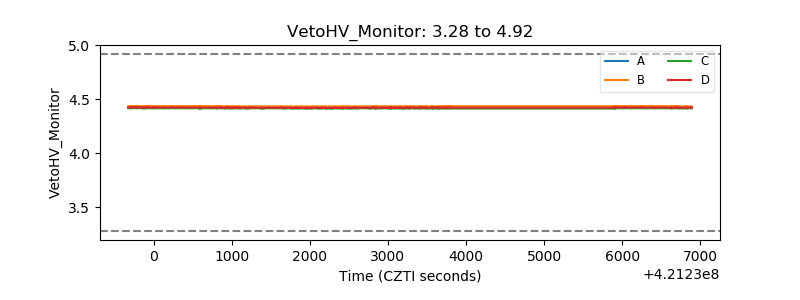 |
| Veto LLD | 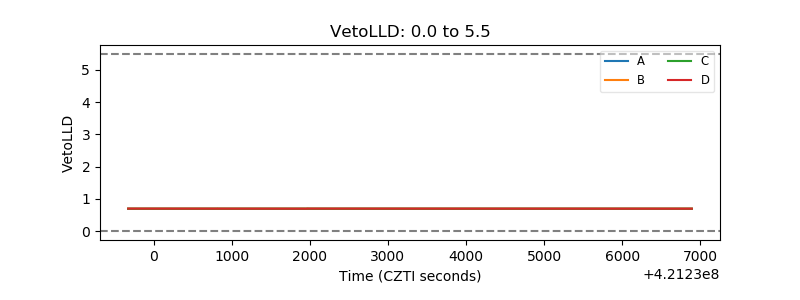 |
| Alpha Counter | 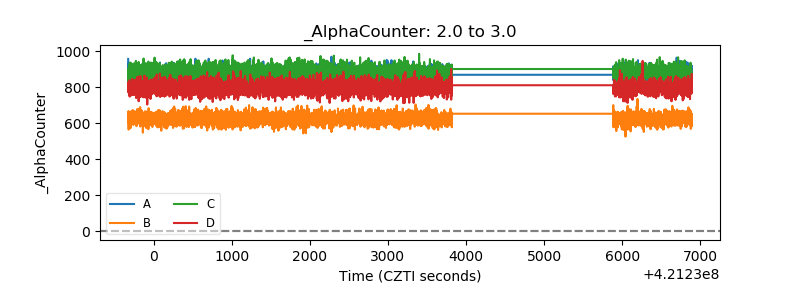 |
| _CPM_Rate | 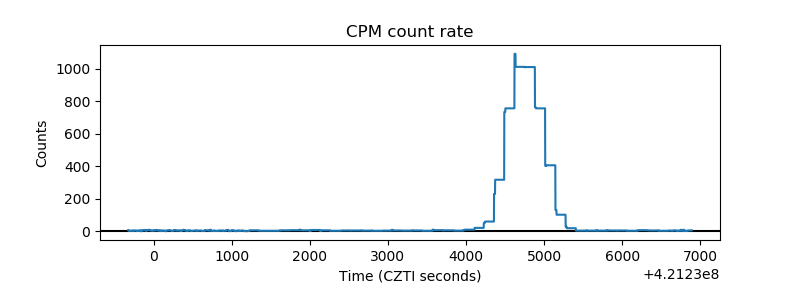 |
| CZT Counter | 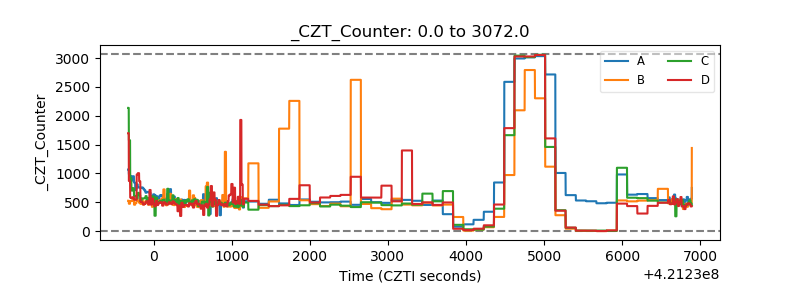 |
| +2.5 Volts monitor | 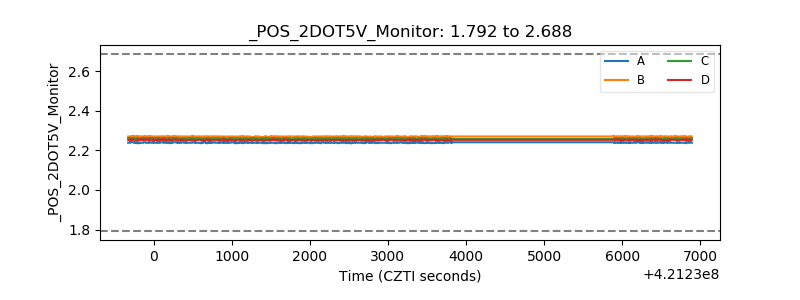 |
| +5 Volts monitor | 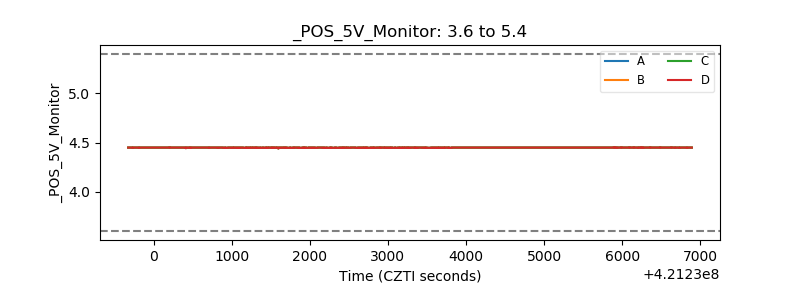 |
| _ROLL_ROT | 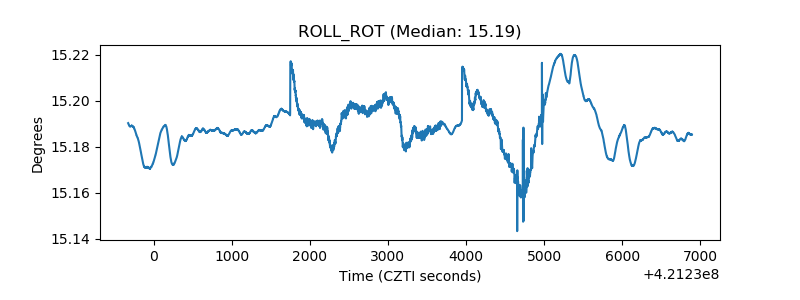 |
| _Roll_DEC | 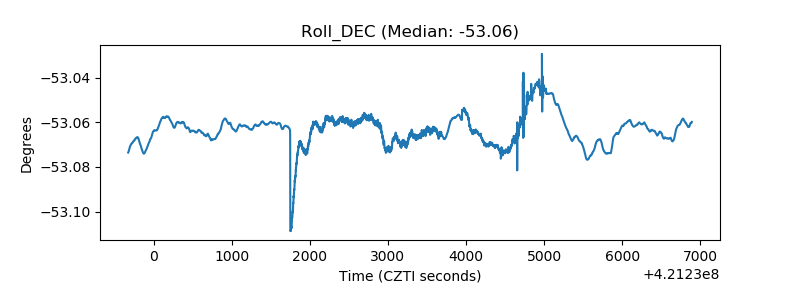 |
| _Roll_RA | 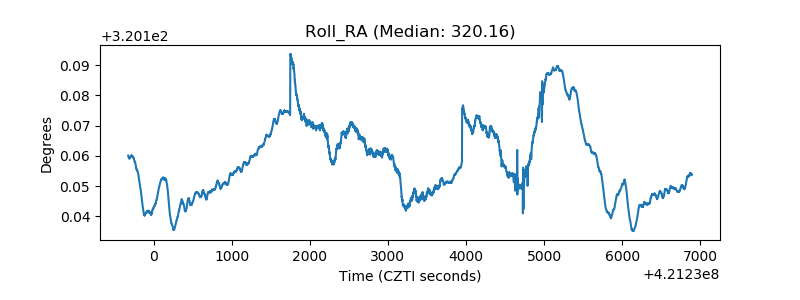 |
| Veto Counter | 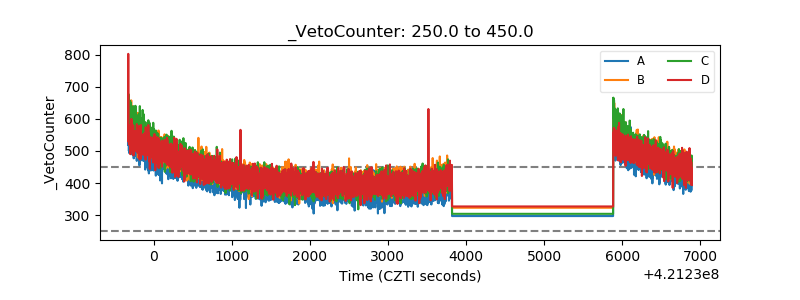 |