| Param | Original file | Final file |
|---|---|---|
| Filename | modeM0/AS1A12_052T04_9000005602_41142cztM0_level2.fits | modeM0/AS1A12_052T04_9000005602_41142cztM0_level2_quad_clean.evt |
| Size (bytes) | 364,464,000 | 92,505,600 |
| Size | 347.6 MB | 88.2 MB |
| Events in quadrant A | 2,892,476 | 646,851 |
| Events in quadrant B | 4,634,560 | 589,530 |
| Events in quadrant C | 2,749,461 | 618,206 |
| Events in quadrant D | 2,809,140 | 581,484 |
| Mode M0 | |||
|---|---|---|---|
| Quadrant | BADHDUFLAG | Total packets | Discarded packets |
| A | 0 | 11565 | 3 |
| B | 0 | 17117 | 2 |
| C | 0 | 11236 | 2 |
| D | 0 | 11742 | 2 |
| Mode M9 | |||
|---|---|---|---|
| Quadrant | BADHDUFLAG | Total packets | Discarded packets |
| A | 0 | 26 | 0 |
| B | 0 | 26 | 0 |
| C | 0 | 26 | 0 |
| D | 0 | 27 | 0 |
| Mode SS | |||
|---|---|---|---|
| Quadrant | BADHDUFLAG | Total packets | Discarded packets |
| A | 0 | 108 | 0 |
| B | 0 | 108 | 0 |
| C | 0 | 108 | 0 |
| D | 0 | 108 | 0 |
| Quadrant | Total seconds | Saturated seconds | Saturation percentage |
|---|---|---|---|
| A | 5209 | 14 | 0.268766% |
| B | 5209 | 700 | 13.438280% |
| C | 5209 | 73 | 1.401421% |
| D | 5209 | 52 | 0.998272% |
Noise dominated data is calculated using 1-second bins in cleaned event files. If a bin has >2000 counts, and if more than 50% of those come from <1% of pixels, then it is considered to be noise-dominated and hence unusable.
| Quadrant | # 1 sec bins | Bins with >0 counts | Bins with >2000 counts | High rate bins dominated by noise | Noise dominated (total time) | Noise dominated (detector-on time) | Marked lightcurve |
|---|---|---|---|---|---|---|---|
| A | 7331 | 5210 | 2 | 2 | 0.03% | 0.04% | 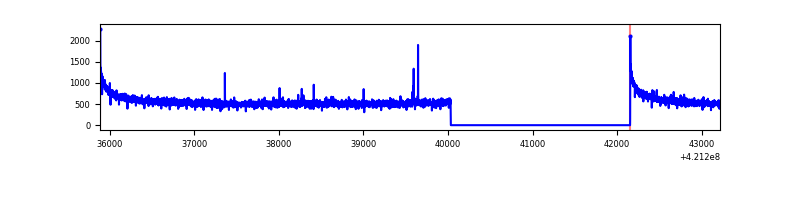 |
| B | 7331 | 5210 | 534 | 534 | 7.28% | 10.25% | 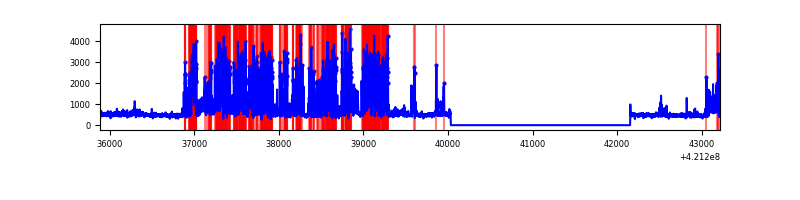 |
| C | 7331 | 5210 | 67 | 67 | 0.91% | 1.29% | 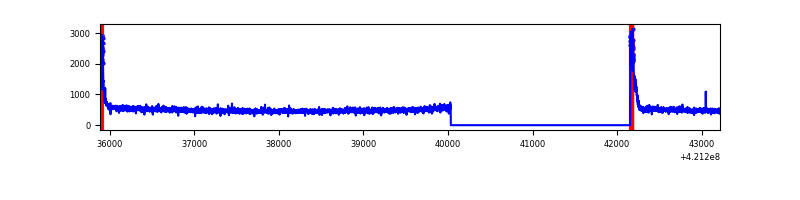 |
| D | 7331 | 5210 | 42 | 42 | 0.57% | 0.81% | 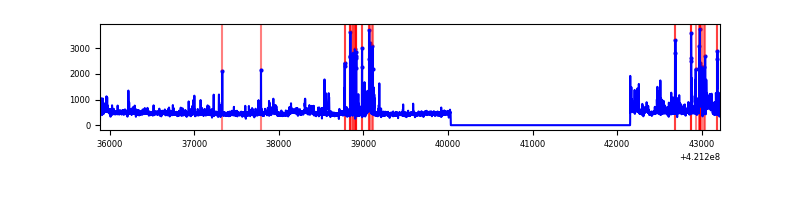 |
Top three noisy pixels from each quadrant. If the there are fewer than three noisy pixels in the level2.evt file, extra rows are filled as -1
| Pixel properties | Quadrant properties | ||||||
|---|---|---|---|---|---|---|---|
| Quadrant | DetID | PixID | Counts | Sigma | Mean | Median | Sigma |
| A | 10 | 83 | 506030 | 4110.19 | 611 | 598 | 123.0 |
| A | 2 | 79 | 12431 | 96.22 | 611 | 598 | 123.0 |
| A | 13 | 254 | 8657 | 65.53 | 611 | 598 | 123.0 |
| B | 0 | 245 | 2110298 | 19368.06 | 573 | 558 | 108.9 |
| B | 0 | 186 | 207401 | 1898.88 | 573 | 558 | 108.9 |
| B | 0 | 190 | 59159 | 537.98 | 573 | 558 | 108.9 |
| C | 15 | 214 | 222562 | 1652.11 | 584 | 588 | 134.4 |
| C | 0 | 10 | 218962 | 1625.31 | 584 | 588 | 134.4 |
| C | 9 | 54 | 22027 | 159.57 | 584 | 588 | 134.4 |
| D | 13 | 249 | 246525 | 1720.18 | 593 | 577 | 143.0 |
| D | 2 | 16 | 123613 | 860.52 | 593 | 577 | 143.0 |
| D | 2 | 249 | 63841 | 442.47 | 593 | 577 | 143.0 |
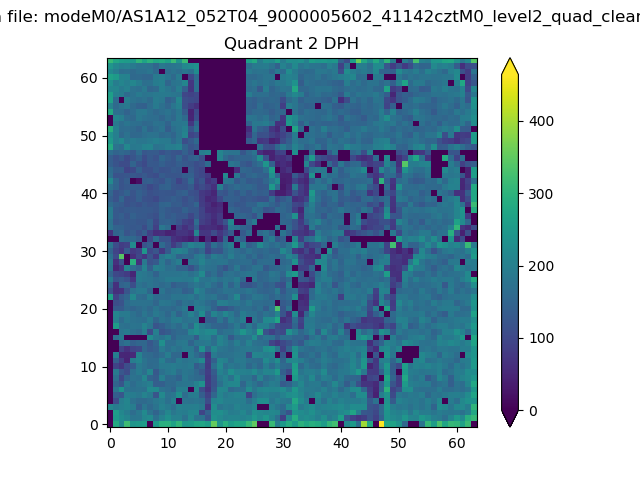
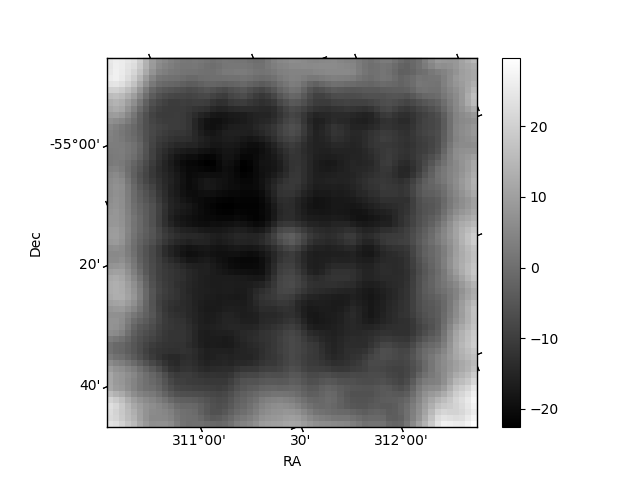
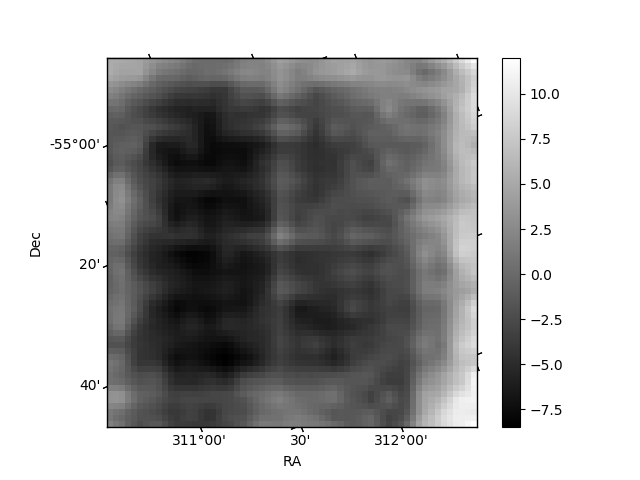
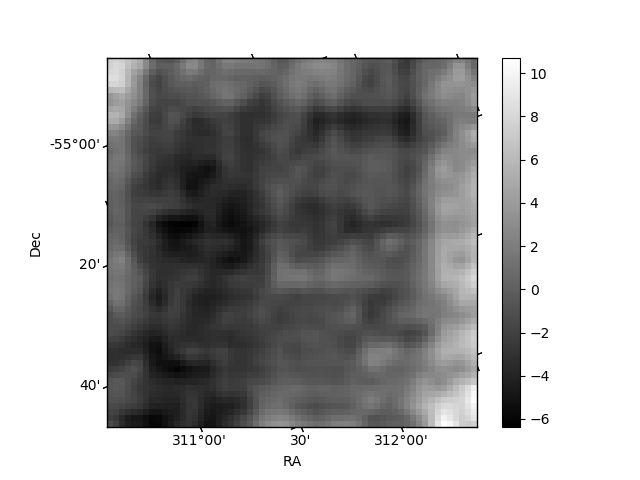
Histogram calculated using DETX and DETY for each event in the final _common_clean file
| Quadrant A | 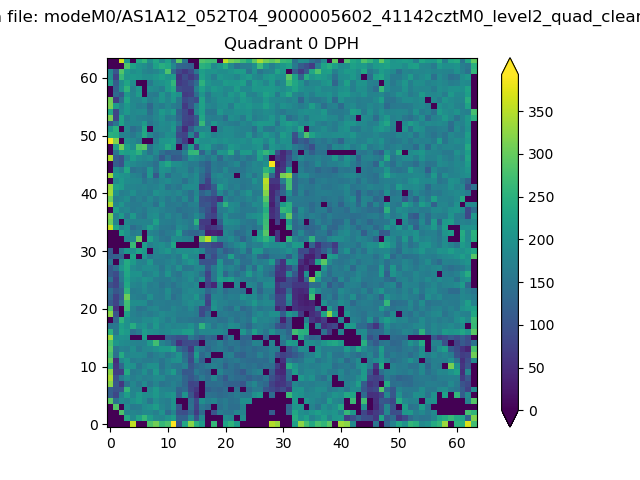 |
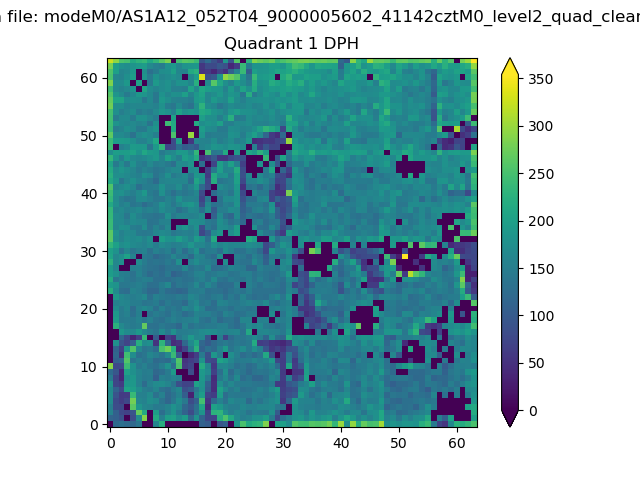 |
Quadrant B |
|---|---|---|---|
| Quadrant D | 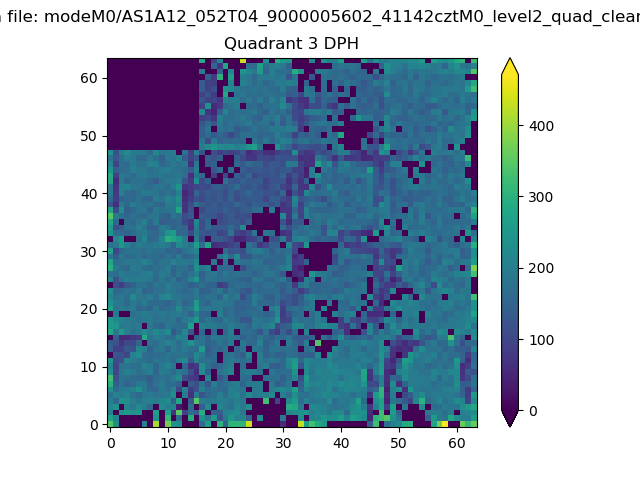 |
 |
Quadrant C |
| Plot type | Count rate plots | Images |
|---|---|---|
| Comparison with Poisson distribution Blue bars denote a histogram of data divided into 1 sec bins. Red curve is a Poisson curve with rate = median count rate of data. |
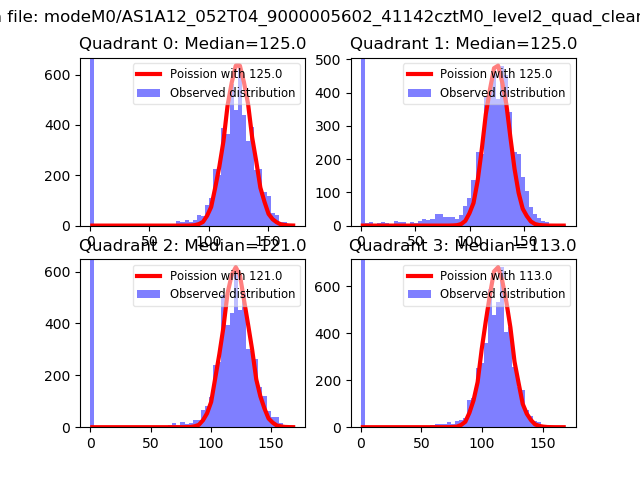 |
 |
| Quadrant-wise count rates Data is divided into 100 sec bins |
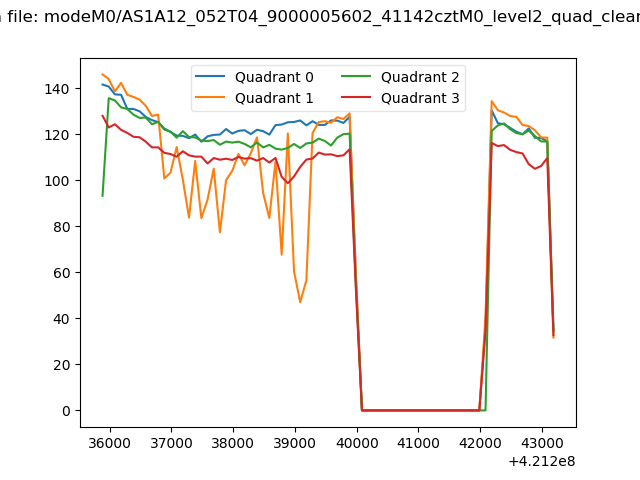 |
|
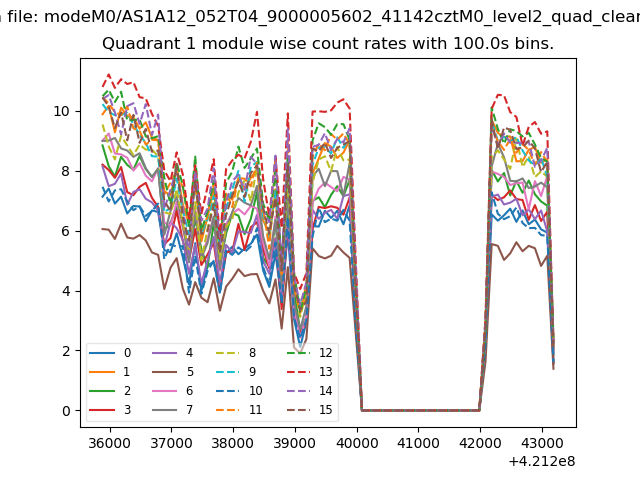
| Module-wise count rates for Quadrant A Data is divided into 100 sec bins |
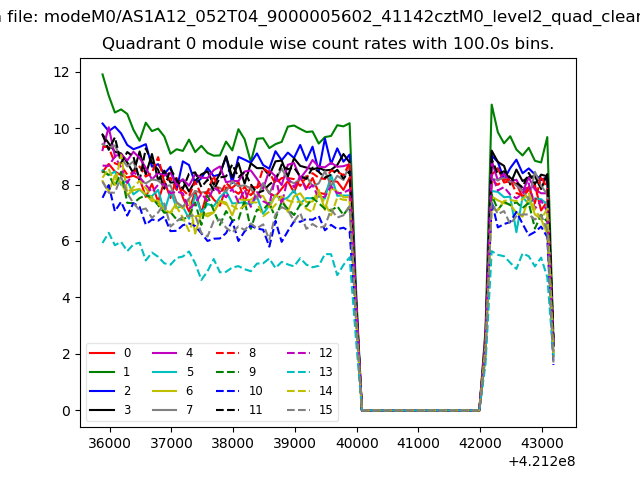 |
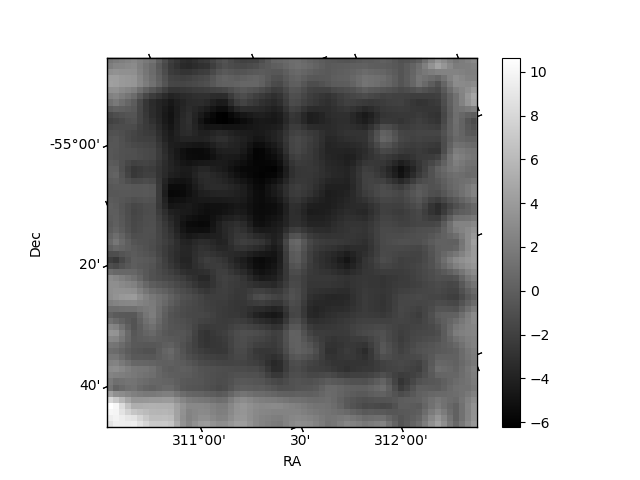 |
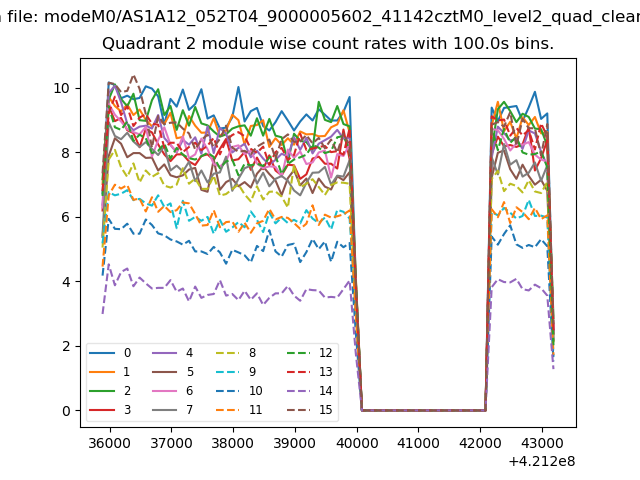
| Module-wise count rates for Quadrant B Data is divided into 100 sec bins |
 |
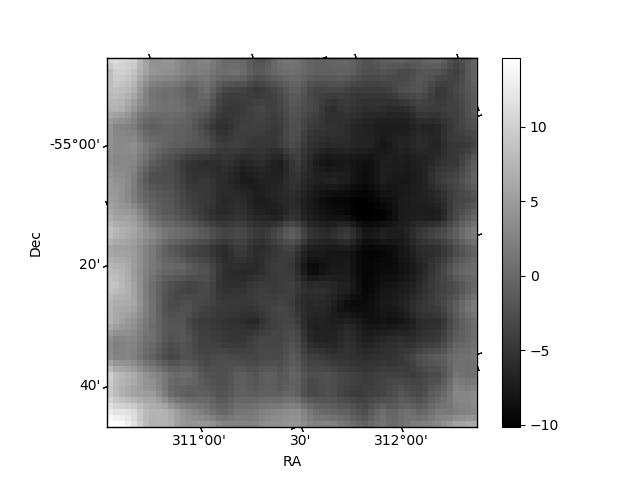 |
| Module-wise count rates for Quadrant C Data is divided into 100 sec bins |
 |
 |
| Module-wise count rates for Quadrant D Data is divided into 100 sec bins |
 |
 |
| Parameter | Plot |
|---|---|
| CZT HV Monitor | 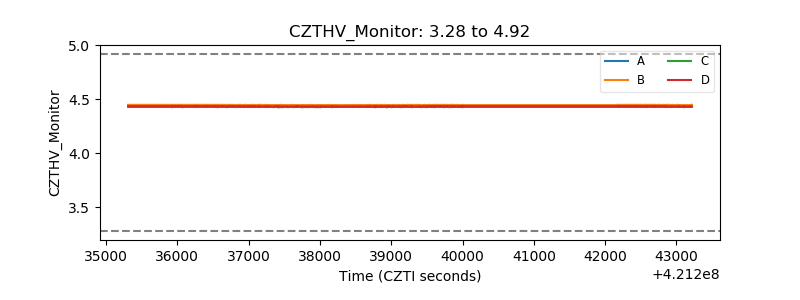 |
| D_VDD | 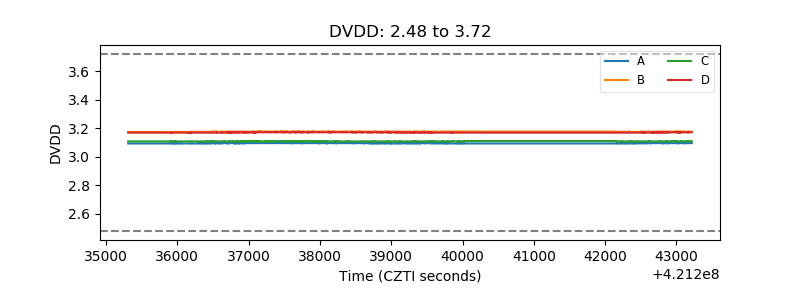 |
| Temperature 1 | 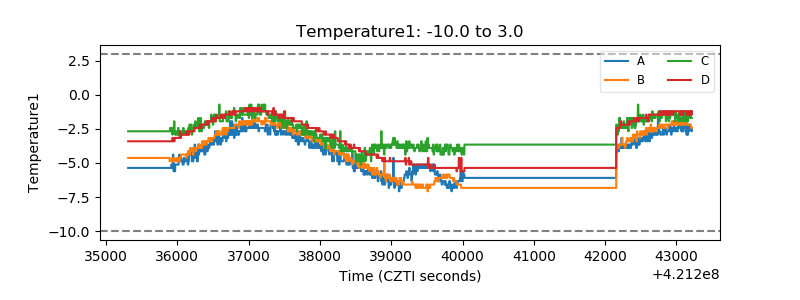 |
| Veto HV Monitor | 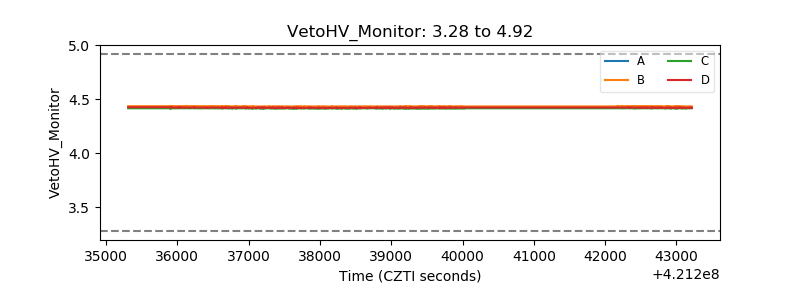 |
| Veto LLD | 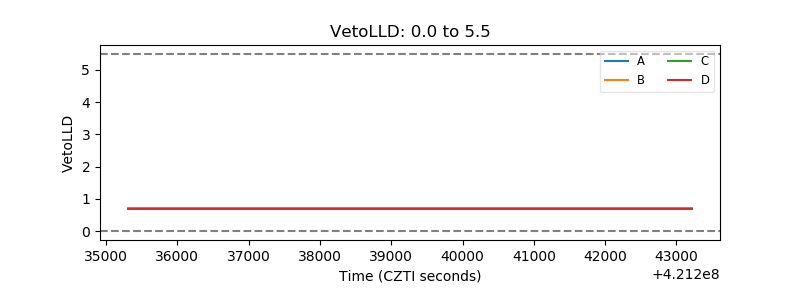 |
| Alpha Counter | 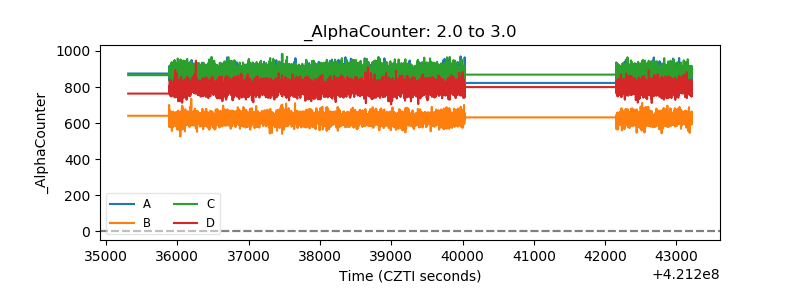 |
| _CPM_Rate | 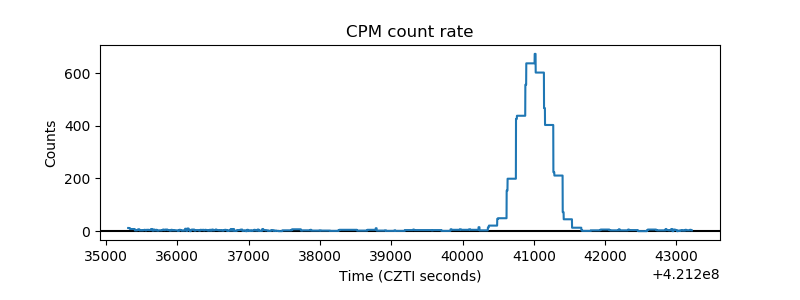 |
| CZT Counter | 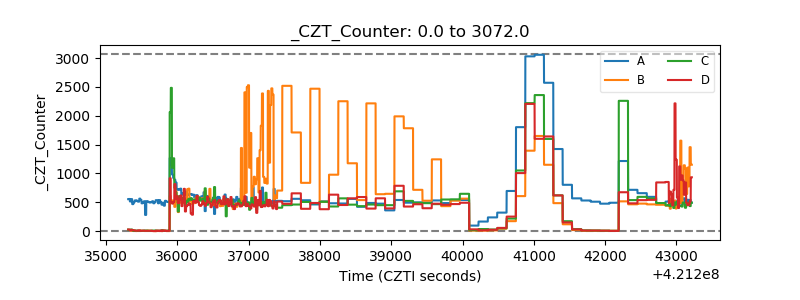 |
| +2.5 Volts monitor | 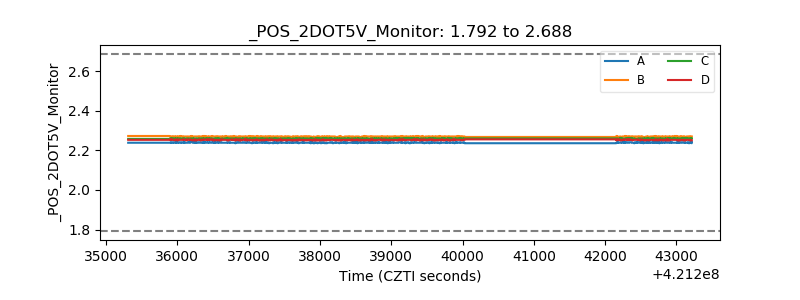 |
| +5 Volts monitor | 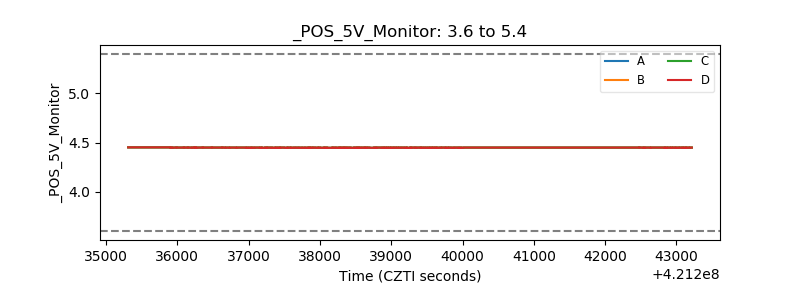 |
| _ROLL_ROT |  |
| _Roll_DEC | 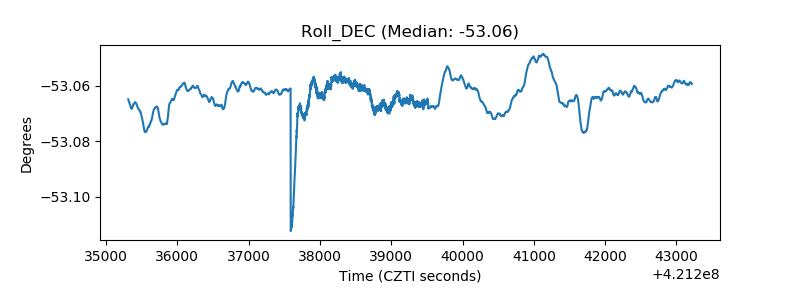 |
| _Roll_RA | 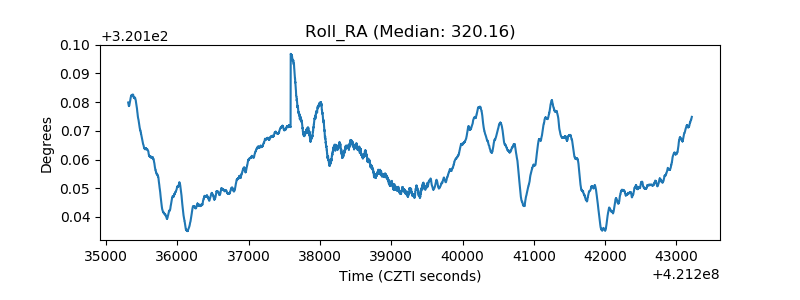 |
| Veto Counter | 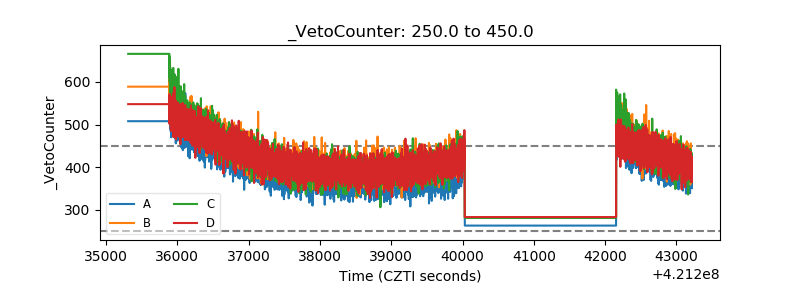 |