| Param | Original file | Final file |
|---|---|---|
| Filename | modeM0/AS1A12_052T04_9000005602_41144cztM0_level2.fits | modeM0/AS1A12_052T04_9000005602_41144cztM0_level2_quad_clean.evt |
| Size (bytes) | 386,867,520 | 86,319,360 |
| Size | 368.9 MB | 82.3 MB |
| Events in quadrant A | 2,788,521 | 604,049 |
| Events in quadrant B | 4,844,509 | 522,794 |
| Events in quadrant C | 2,668,595 | 577,303 |
| Events in quadrant D | 3,604,728 | 537,422 |
| Mode M0 | |||
|---|---|---|---|
| Quadrant | BADHDUFLAG | Total packets | Discarded packets |
| A | 0 | 11470 | 3 |
| B | 0 | 18039 | 2 |
| C | 0 | 11404 | 2 |
| D | 0 | 14475 | 2 |
| Mode M9 | |||
|---|---|---|---|
| Quadrant | BADHDUFLAG | Total packets | Discarded packets |
| A | 0 | 19 | 0 |
| B | 0 | 19 | 0 |
| C | 0 | 19 | 0 |
| D | 0 | 20 | 0 |
| Mode SS | |||
|---|---|---|---|
| Quadrant | BADHDUFLAG | Total packets | Discarded packets |
| A | 0 | 108 | 0 |
| B | 0 | 108 | 0 |
| C | 0 | 108 | 0 |
| D | 0 | 108 | 0 |
| Quadrant | Total seconds | Saturated seconds | Saturation percentage |
|---|---|---|---|
| A | 5317 | 11 | 0.206884% |
| B | 5317 | 896 | 16.851608% |
| C | 5317 | 72 | 1.354147% |
| D | 5317 | 134 | 2.520218% |
Noise dominated data is calculated using 1-second bins in cleaned event files. If a bin has >2000 counts, and if more than 50% of those come from <1% of pixels, then it is considered to be noise-dominated and hence unusable.
| Quadrant | # 1 sec bins | Bins with >0 counts | Bins with >2000 counts | High rate bins dominated by noise | Noise dominated (total time) | Noise dominated (detector-on time) | Marked lightcurve |
|---|---|---|---|---|---|---|---|
| A | 7259 | 5318 | 2 | 2 | 0.03% | 0.04% | 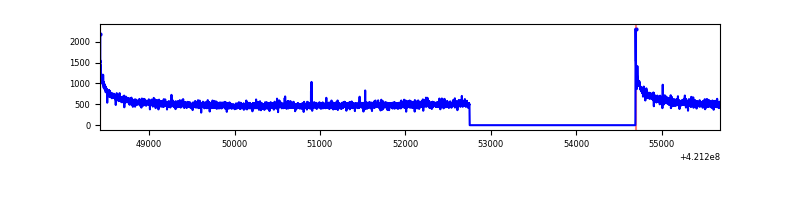 |
| B | 7259 | 5318 | 729 | 729 | 10.04% | 13.71% | 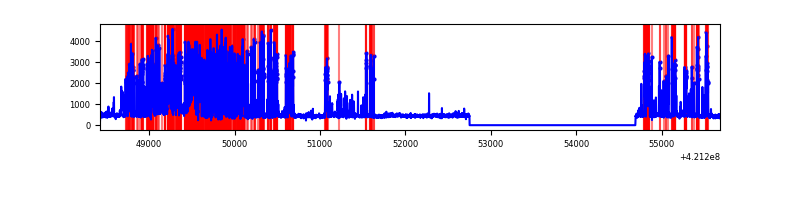 |
| C | 7259 | 5318 | 65 | 65 | 0.90% | 1.22% | 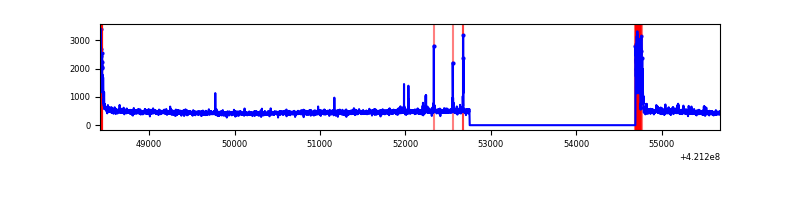 |
| D | 7259 | 5318 | 124 | 124 | 1.71% | 2.33% | 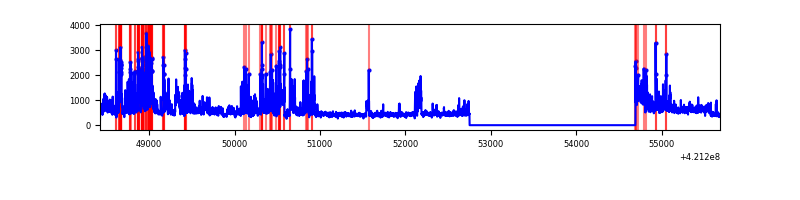 |
Top three noisy pixels from each quadrant. If the there are fewer than three noisy pixels in the level2.evt file, extra rows are filled as -1
| Pixel properties | Quadrant properties | ||||||
|---|---|---|---|---|---|---|---|
| Quadrant | DetID | PixID | Counts | Sigma | Mean | Median | Sigma |
| A | 10 | 83 | 526913 | 4402.18 | 583 | 571 | 119.6 |
| A | 13 | 254 | 8647 | 67.55 | 583 | 571 | 119.6 |
| A | 2 | 79 | 8361 | 65.15 | 583 | 571 | 119.6 |
| B | 0 | 245 | 2464402 | 23797.68 | 535 | 522 | 103.5 |
| B | 0 | 186 | 141343 | 1360.14 | 535 | 522 | 103.5 |
| B | 5 | 255 | 117249 | 1127.42 | 535 | 522 | 103.5 |
| C | 15 | 214 | 227088 | 1737.08 | 560 | 562 | 130.4 |
| C | 0 | 10 | 138482 | 1057.62 | 560 | 562 | 130.4 |
| C | 9 | 54 | 90216 | 687.5 | 560 | 562 | 130.4 |
| D | 2 | 16 | 509464 | 3710.73 | 562 | 546 | 137.1 |
| D | 13 | 249 | 502742 | 3661.72 | 562 | 546 | 137.1 |
| D | 6 | 239 | 209926 | 1526.68 | 562 | 546 | 137.1 |
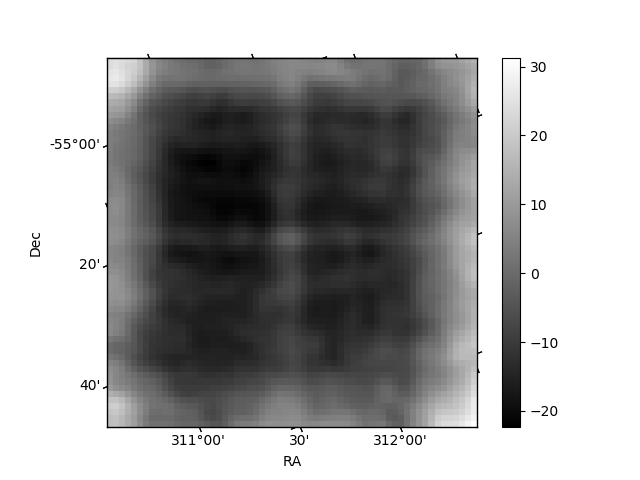
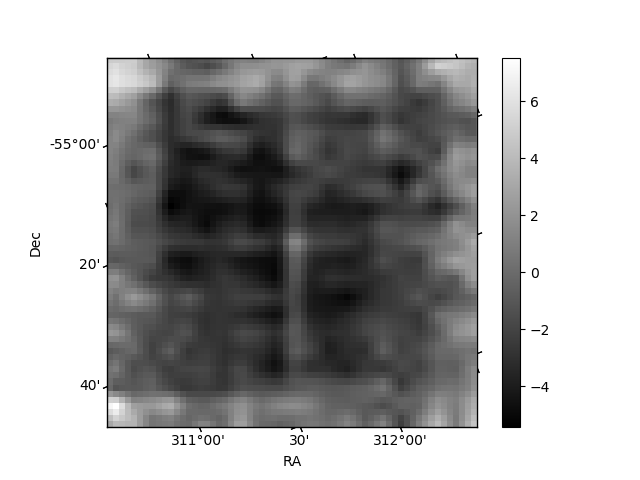
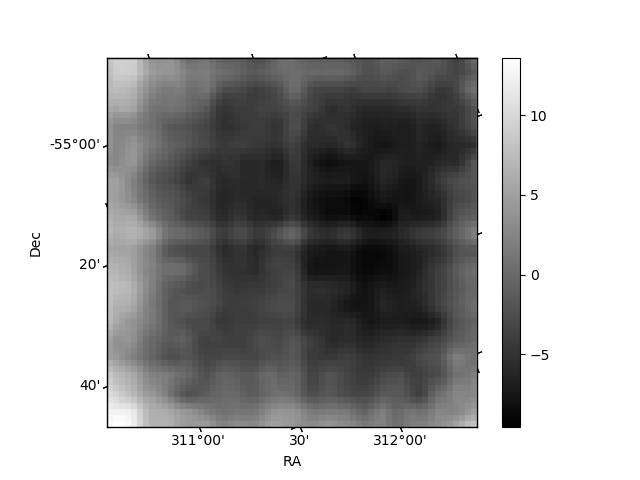
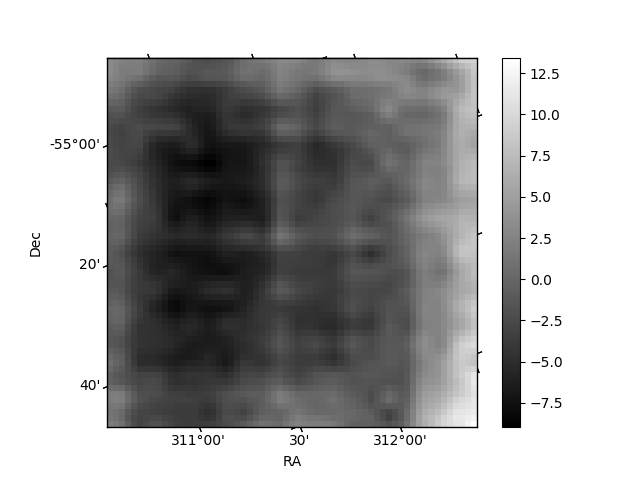
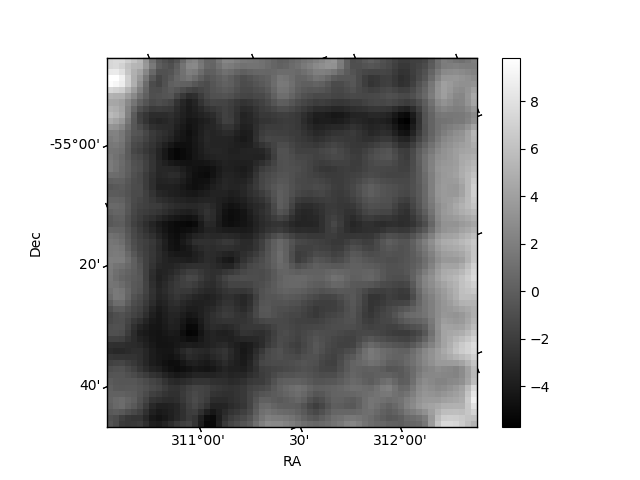
Histogram calculated using DETX and DETY for each event in the final _common_clean file
| Quadrant A | 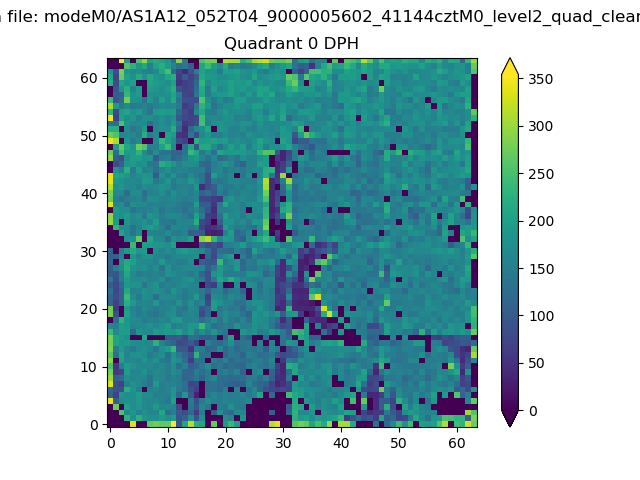 |
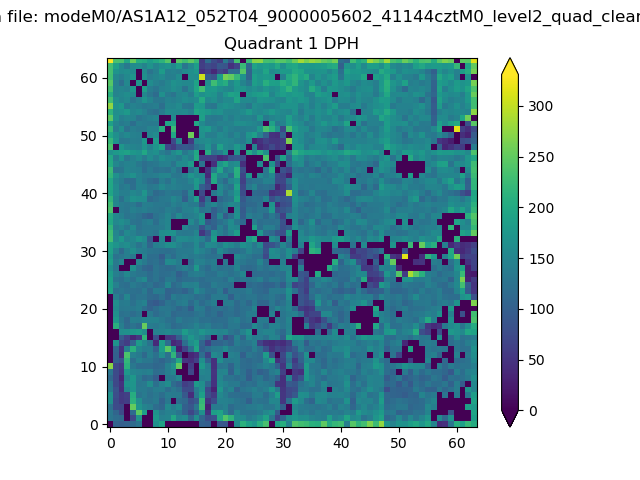 |
Quadrant B |
|---|---|---|---|
| Quadrant D | 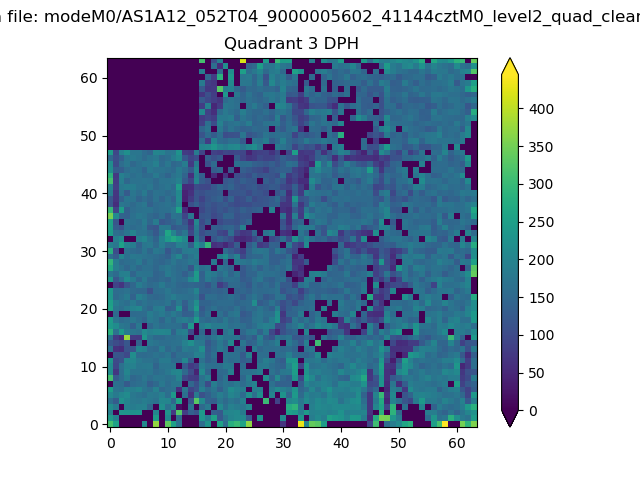 |
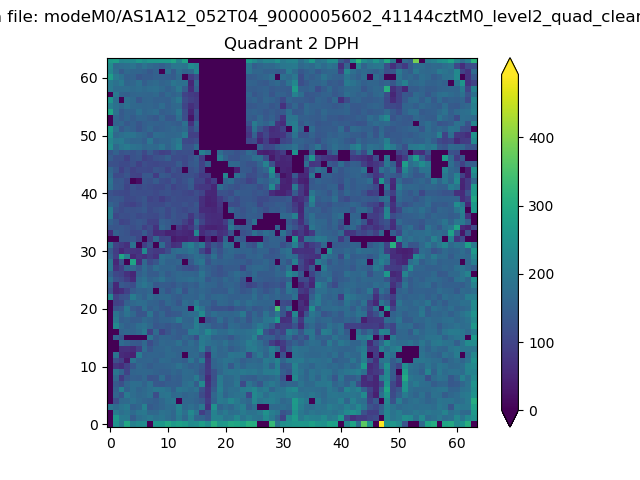 |
Quadrant C |
| Plot type | Count rate plots | Images |
|---|---|---|
| Comparison with Poisson distribution Blue bars denote a histogram of data divided into 1 sec bins. Red curve is a Poisson curve with rate = median count rate of data. |
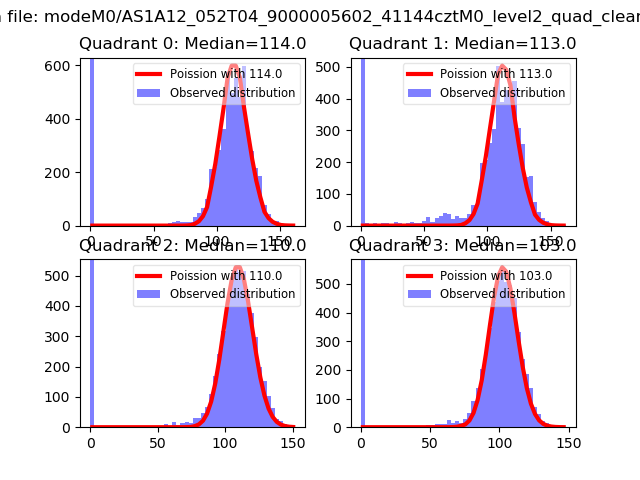 |
 |
| Quadrant-wise count rates Data is divided into 100 sec bins |
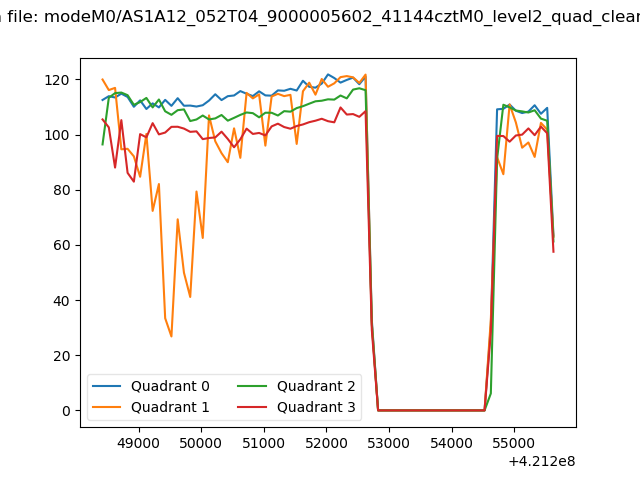 |
|
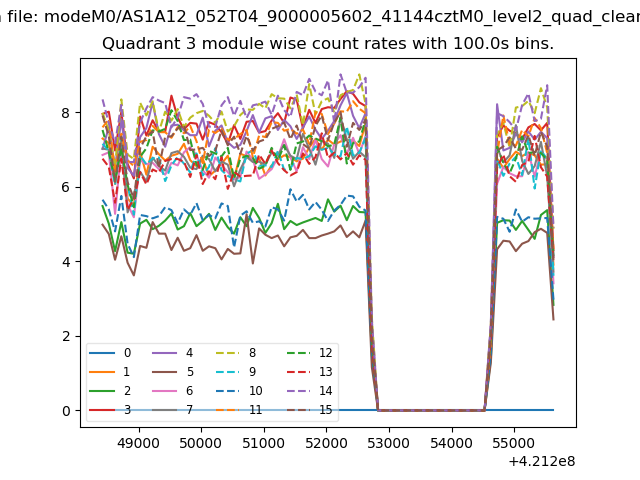
| Module-wise count rates for Quadrant A Data is divided into 100 sec bins |
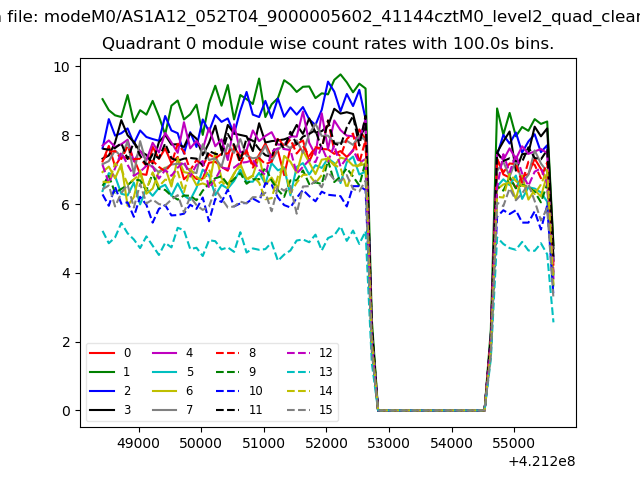 |
 |
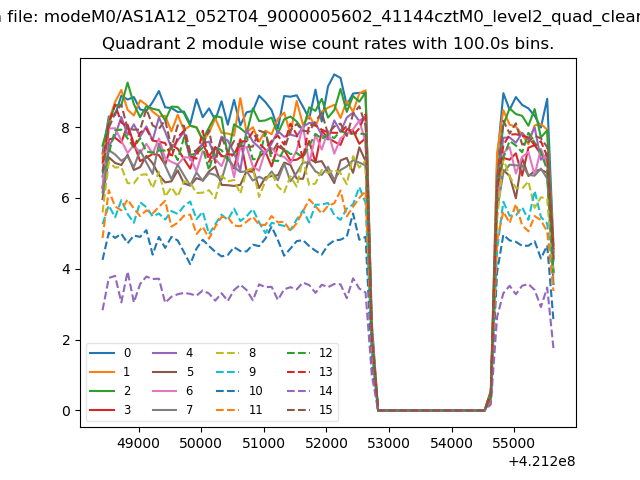
| Module-wise count rates for Quadrant B Data is divided into 100 sec bins |
 |
 |
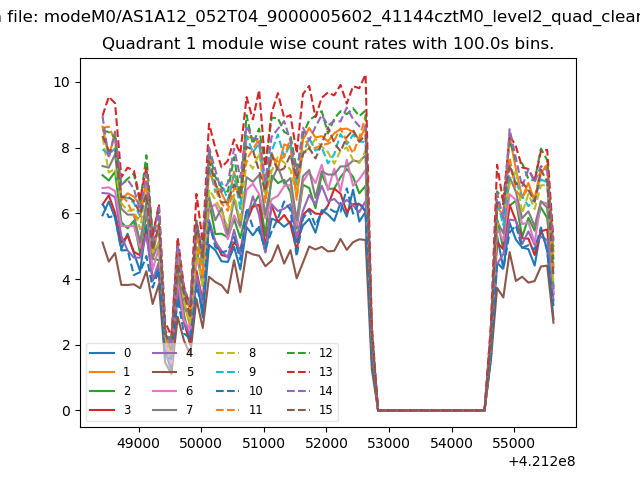
| Module-wise count rates for Quadrant C Data is divided into 100 sec bins |
 |
 |
| Module-wise count rates for Quadrant D Data is divided into 100 sec bins |
 |
 |
| Parameter | Plot |
|---|---|
| CZT HV Monitor | 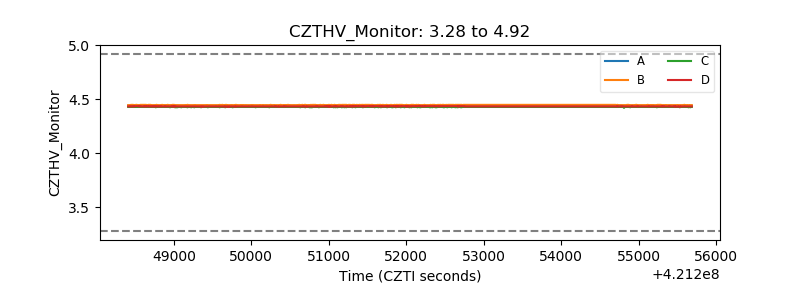 |
| D_VDD | 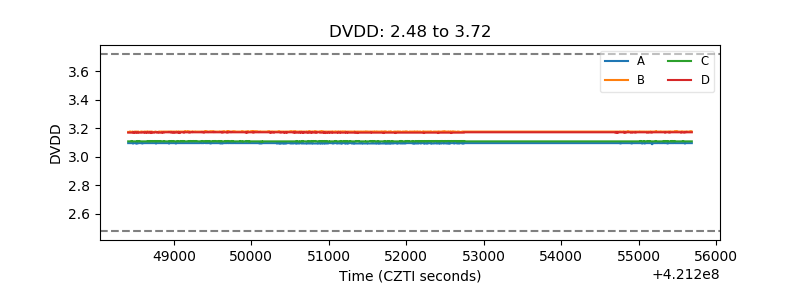 |
| Temperature 1 | 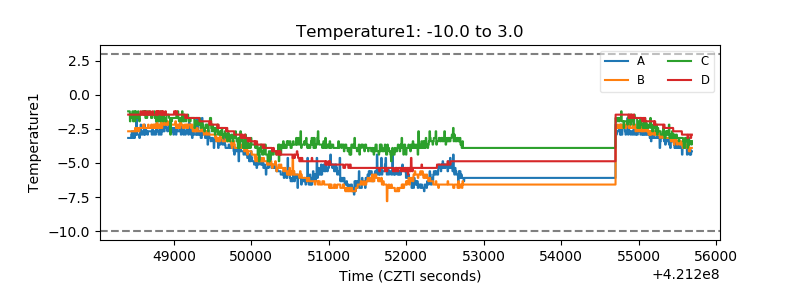 |
| Veto HV Monitor | 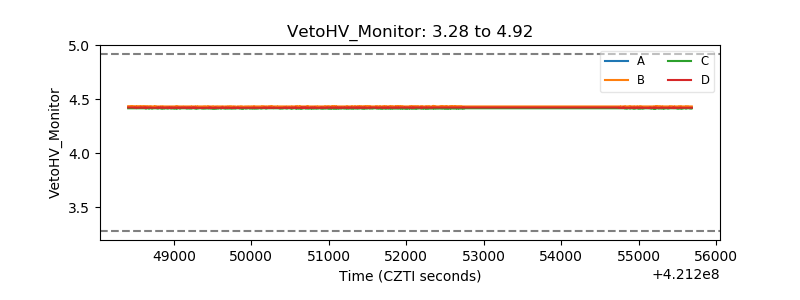 |
| Veto LLD | 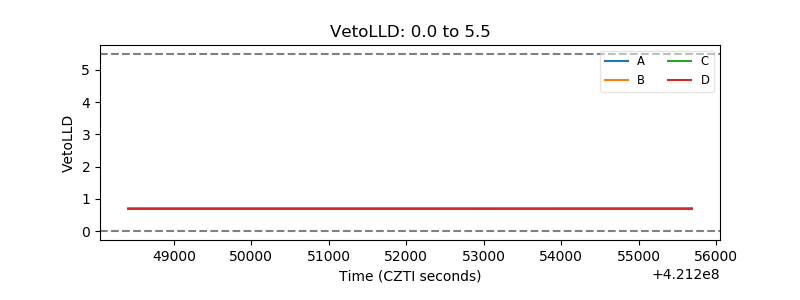 |
| Alpha Counter | 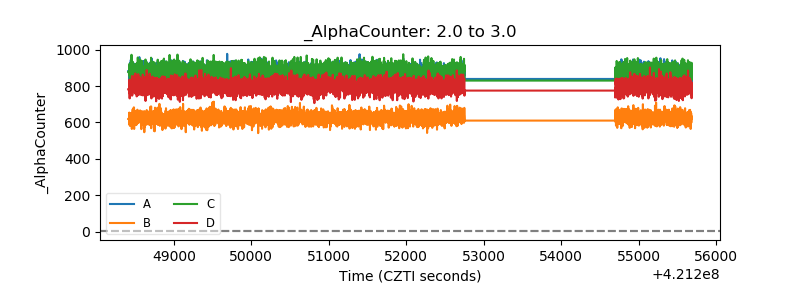 |
| _CPM_Rate | 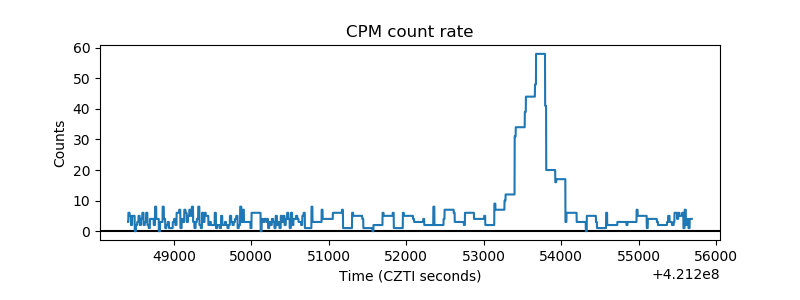 |
| CZT Counter | 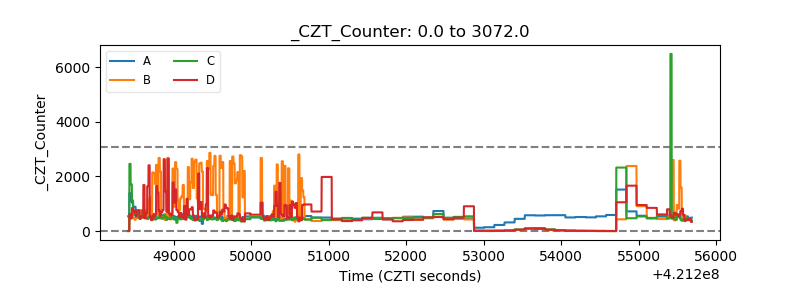 |
| +2.5 Volts monitor |  |
| +5 Volts monitor | 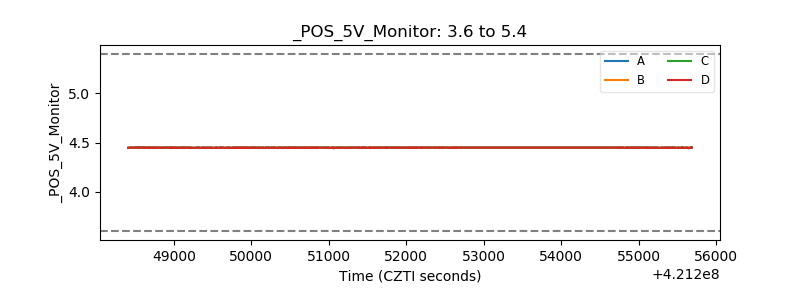 |
| _ROLL_ROT | 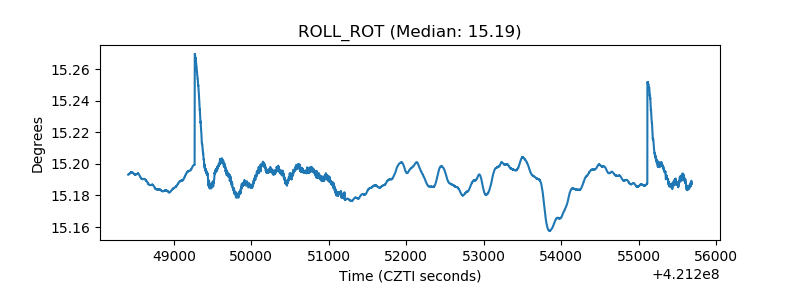 |
| _Roll_DEC | 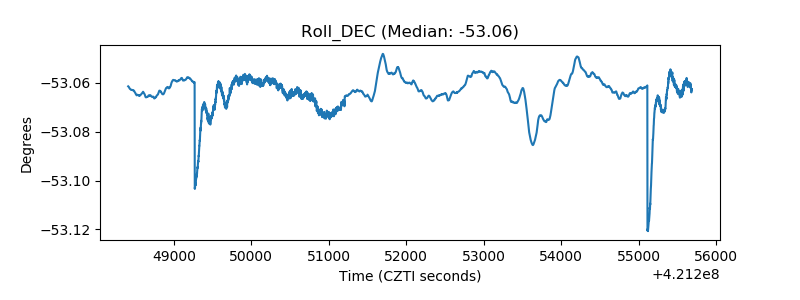 |
| _Roll_RA | 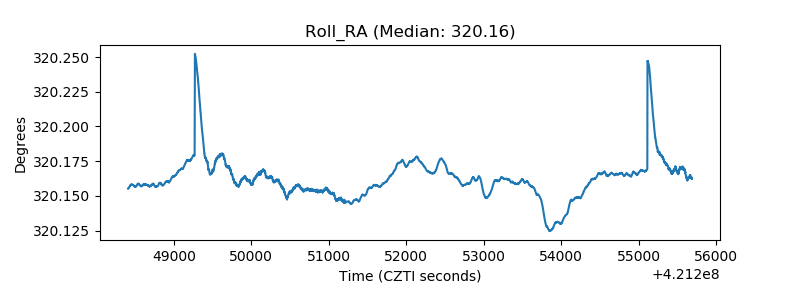 |
| Veto Counter | 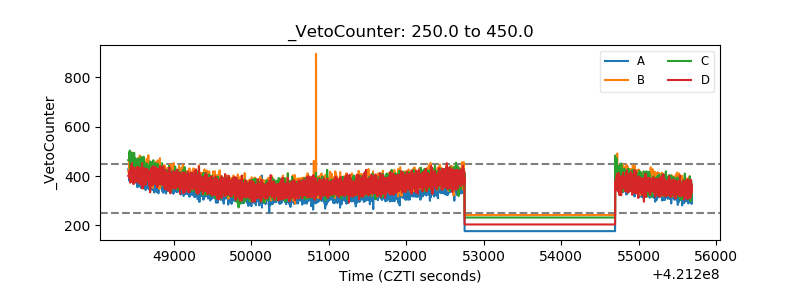 |