| Param | Original file | Final file |
|---|---|---|
| Filename | modeM0/AS1A12_052T04_9000005602_41145cztM0_level2.fits | modeM0/AS1A12_052T04_9000005602_41145cztM0_level2_quad_clean.evt |
| Size (bytes) | 360,982,080 | 89,337,600 |
| Size | 344.3 MB | 85.2 MB |
| Events in quadrant A | 2,946,879 | 610,885 |
| Events in quadrant B | 3,592,286 | 588,543 |
| Events in quadrant C | 2,863,043 | 579,648 |
| Events in quadrant D | 3,535,554 | 543,905 |
| Mode M0 | |||
|---|---|---|---|
| Quadrant | BADHDUFLAG | Total packets | Discarded packets |
| A | 0 | 12015 | 3 |
| B | 0 | 14446 | 2 |
| C | 0 | 12018 | 2 |
| D | 0 | 14485 | 5 |
| Mode M9 | |||
|---|---|---|---|
| Quadrant | BADHDUFLAG | Total packets | Discarded packets |
| A | 0 | 25 | 0 |
| B | 0 | 25 | 0 |
| C | 0 | 25 | 0 |
| D | 0 | 26 | 0 |
| Mode SS | |||
|---|---|---|---|
| Quadrant | BADHDUFLAG | Total packets | Discarded packets |
| A | 0 | 112 | 0 |
| B | 0 | 112 | 0 |
| C | 0 | 112 | 0 |
| D | 0 | 112 | 0 |
| Quadrant | Total seconds | Saturated seconds | Saturation percentage |
|---|---|---|---|
| A | 5458 | 21 | 0.384756% |
| B | 5458 | 276 | 5.056797% |
| C | 5458 | 82 | 1.502382% |
| D | 5457 | 112 | 2.052410% |
Noise dominated data is calculated using 1-second bins in cleaned event files. If a bin has >2000 counts, and if more than 50% of those come from <1% of pixels, then it is considered to be noise-dominated and hence unusable.
| Quadrant | # 1 sec bins | Bins with >0 counts | Bins with >2000 counts | High rate bins dominated by noise | Noise dominated (total time) | Noise dominated (detector-on time) | Marked lightcurve |
|---|---|---|---|---|---|---|---|
| A | 7070 | 5459 | 8 | 8 | 0.11% | 0.15% | 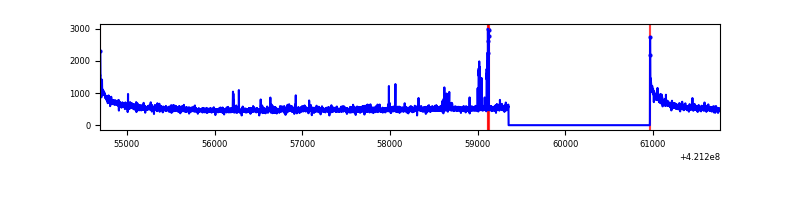 |
| B | 7070 | 5459 | 222 | 222 | 3.14% | 4.07% | 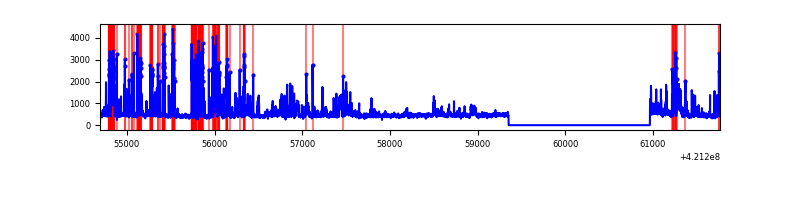 |
| C | 7070 | 5459 | 72 | 72 | 1.02% | 1.32% | 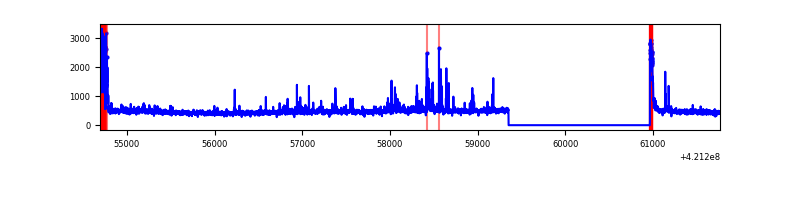 |
| D | 7070 | 5459 | 108 | 108 | 1.53% | 1.98% | 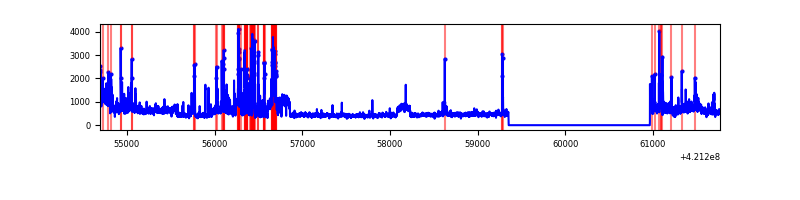 |
Top three noisy pixels from each quadrant. If the there are fewer than three noisy pixels in the level2.evt file, extra rows are filled as -1
| Pixel properties | Quadrant properties | ||||||
|---|---|---|---|---|---|---|---|
| Quadrant | DetID | PixID | Counts | Sigma | Mean | Median | Sigma |
| A | 10 | 83 | 530332 | 4362.72 | 593 | 580 | 121.4 |
| A | 2 | 79 | 61609 | 502.6 | 593 | 580 | 121.4 |
| A | 9 | 191 | 59670 | 486.63 | 593 | 580 | 121.4 |
| B | 0 | 245 | 1216626 | 11100.23 | 572 | 556 | 109.6 |
| B | 0 | 186 | 68914 | 623.97 | 572 | 556 | 109.6 |
| B | 5 | 255 | 46341 | 417.92 | 572 | 556 | 109.6 |
| C | 15 | 214 | 232155 | 1742.75 | 570 | 573 | 132.9 |
| C | 9 | 54 | 220941 | 1658.36 | 570 | 573 | 132.9 |
| C | 0 | 10 | 147625 | 1106.63 | 570 | 573 | 132.9 |
| D | 2 | 16 | 661891 | 4735.3 | 571 | 555 | 139.7 |
| D | 13 | 249 | 456238 | 3262.78 | 571 | 555 | 139.7 |
| D | 9 | 19 | 83369 | 592.96 | 571 | 555 | 139.7 |
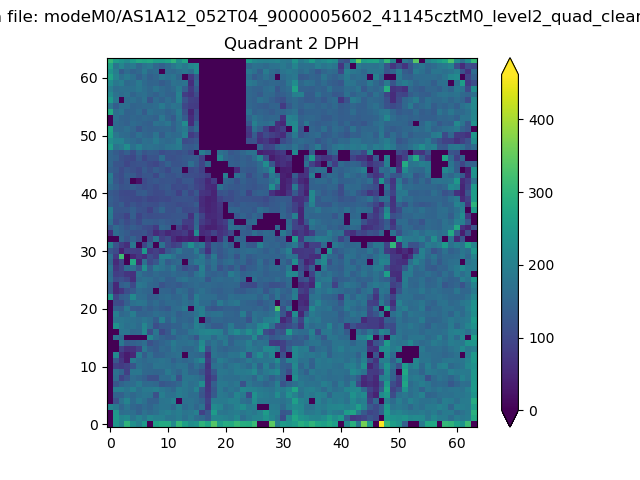
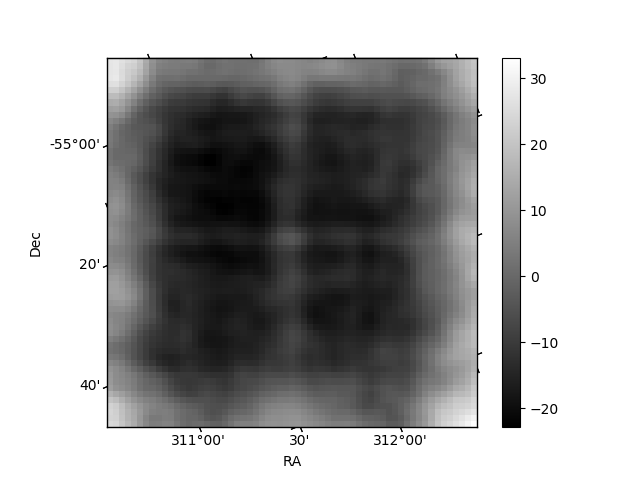
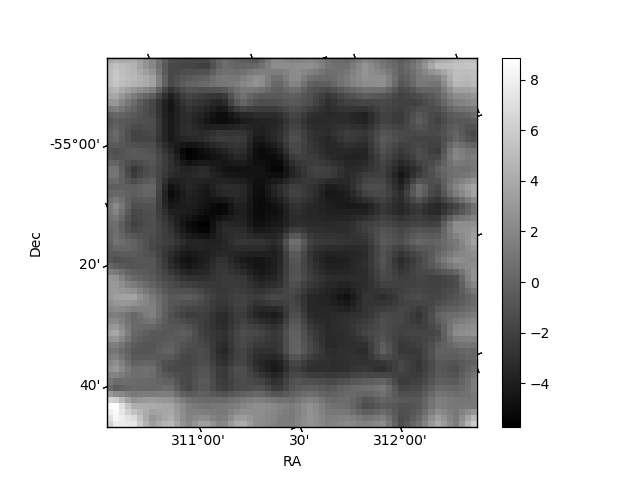
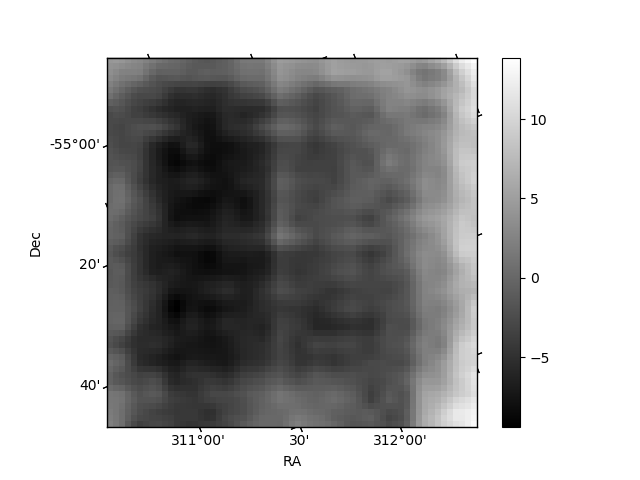
Histogram calculated using DETX and DETY for each event in the final _common_clean file
| Quadrant A | 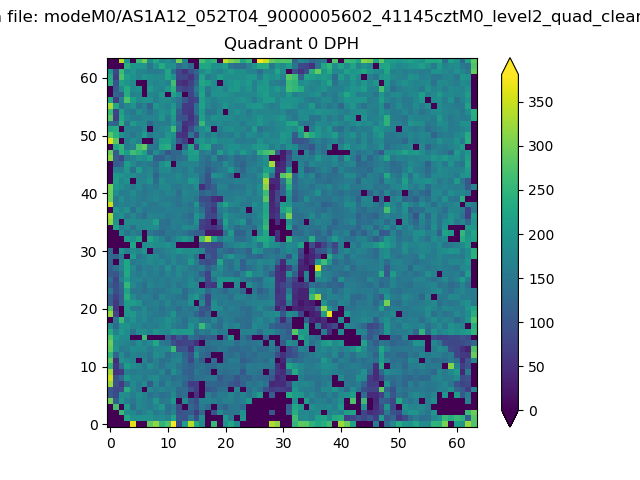 |
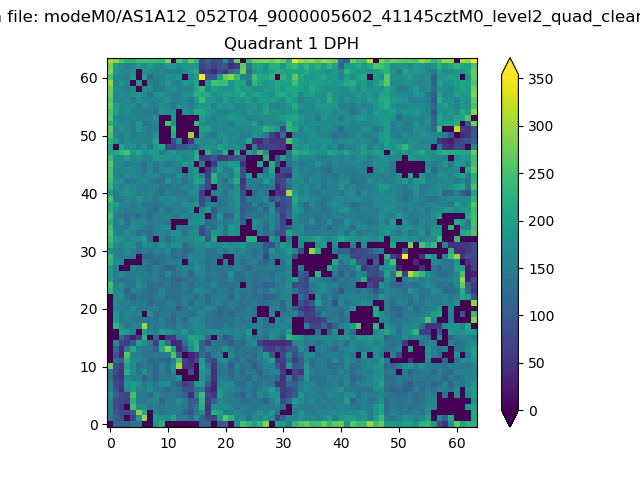 |
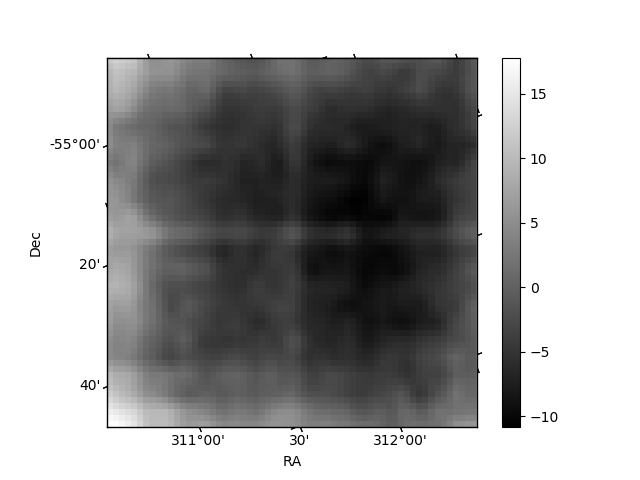
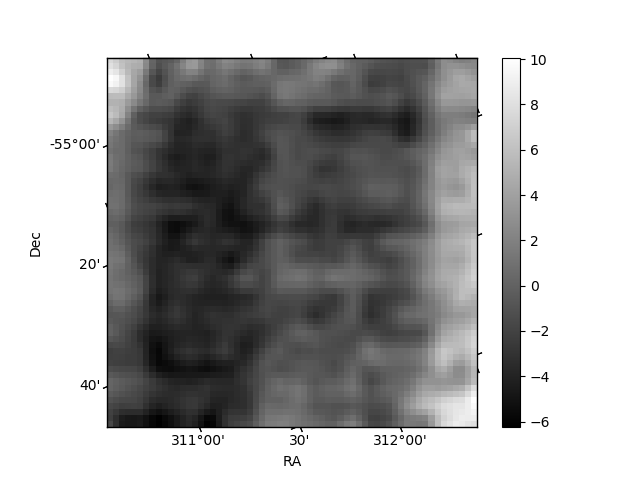
Quadrant B |
|---|---|---|---|
| Quadrant D | 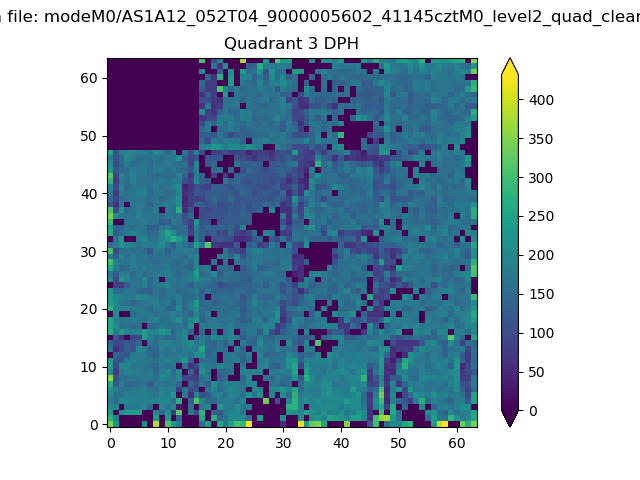 |
 |
Quadrant C |
| Plot type | Count rate plots | Images |
|---|---|---|
| Comparison with Poisson distribution Blue bars denote a histogram of data divided into 1 sec bins. Red curve is a Poisson curve with rate = median count rate of data. |
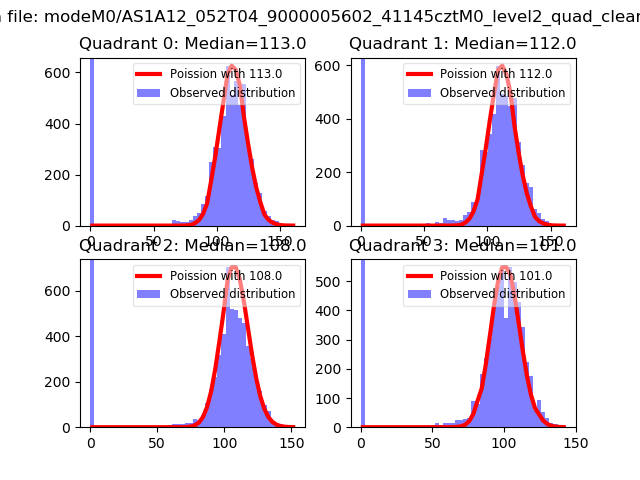 |
 |
| Quadrant-wise count rates Data is divided into 100 sec bins |
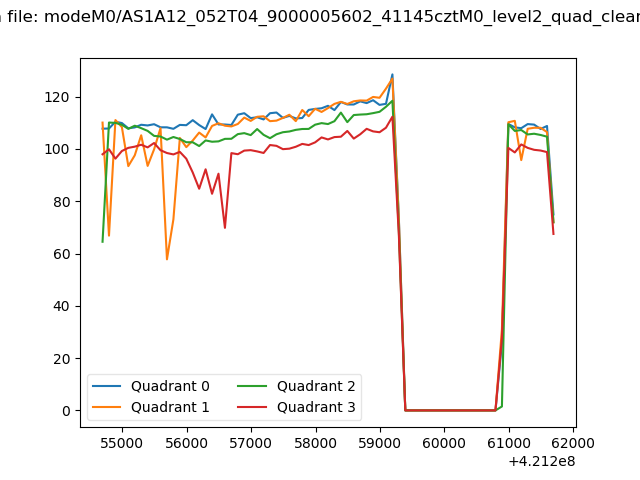 |
|
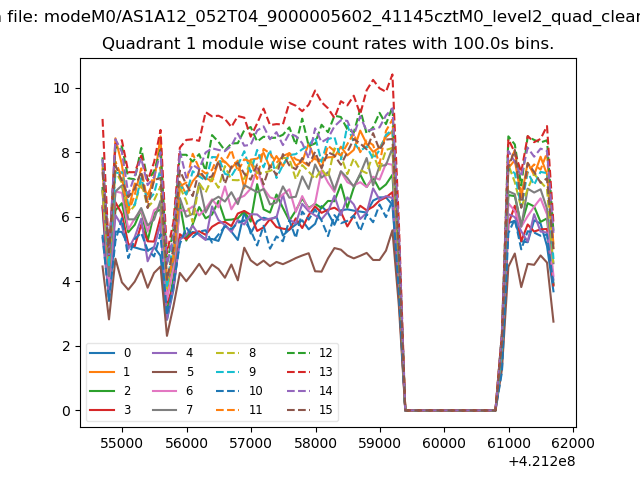
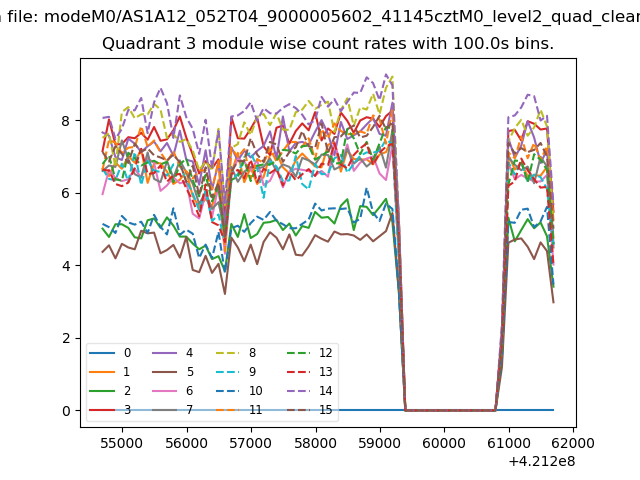
| Module-wise count rates for Quadrant A Data is divided into 100 sec bins |
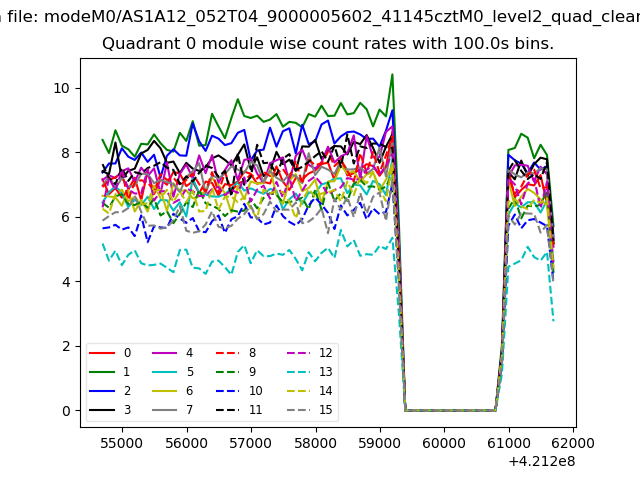 |
 |
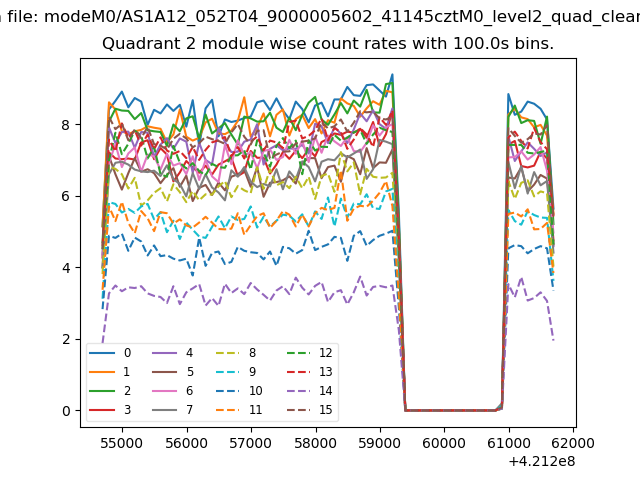
| Module-wise count rates for Quadrant B Data is divided into 100 sec bins |
 |
 |
| Module-wise count rates for Quadrant C Data is divided into 100 sec bins |
 |
 |
| Module-wise count rates for Quadrant D Data is divided into 100 sec bins |
 |
 |
| Parameter | Plot |
|---|---|
| CZT HV Monitor | 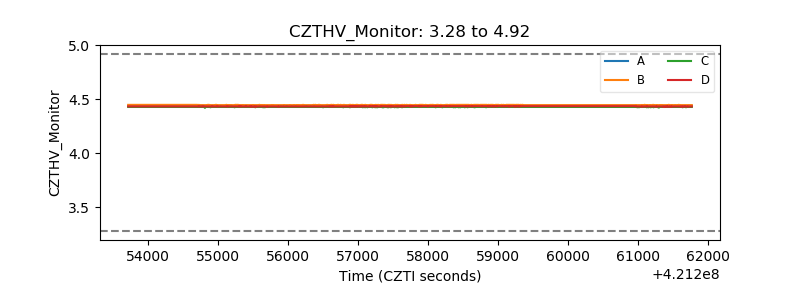 |
| D_VDD | 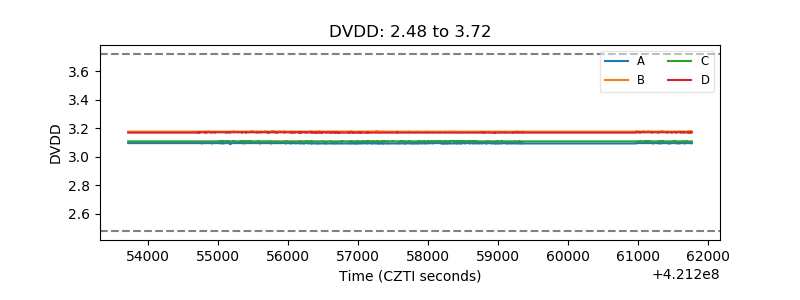 |
| Temperature 1 | 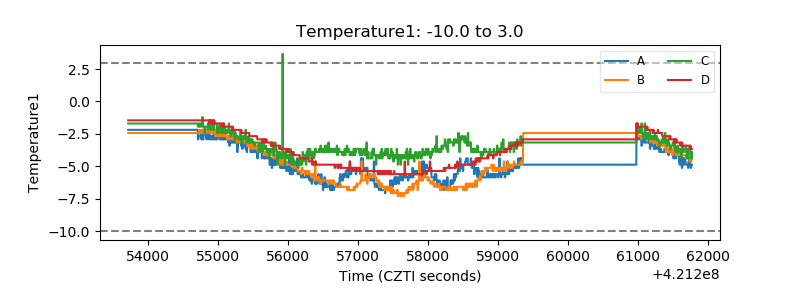 |
| Veto HV Monitor | 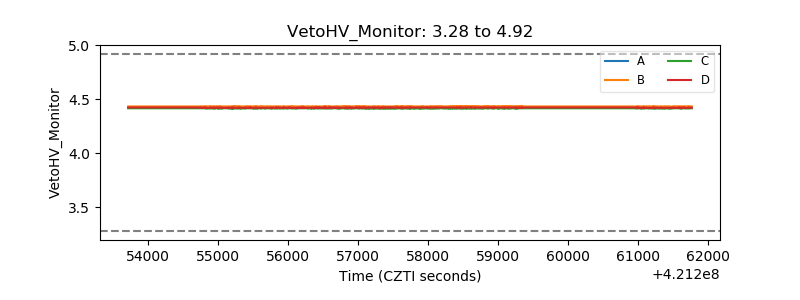 |
| Veto LLD | 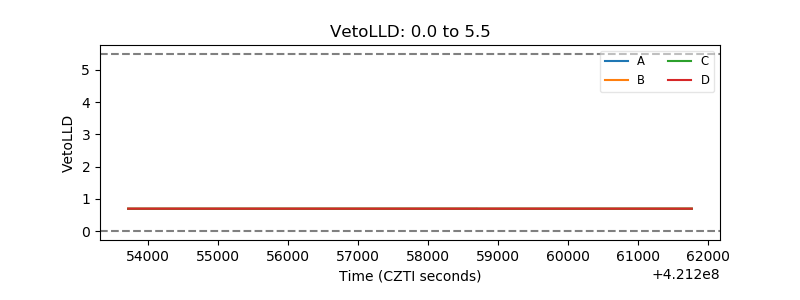 |
| Alpha Counter | 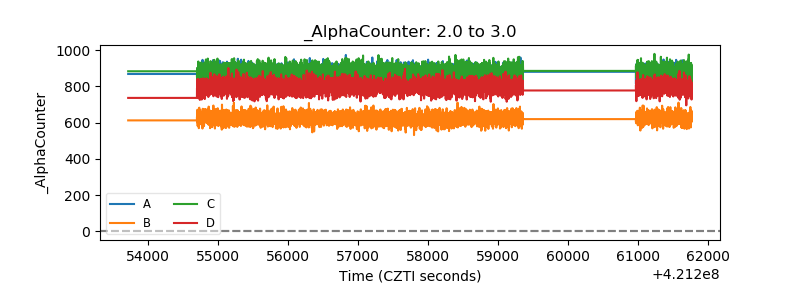 |
| _CPM_Rate | 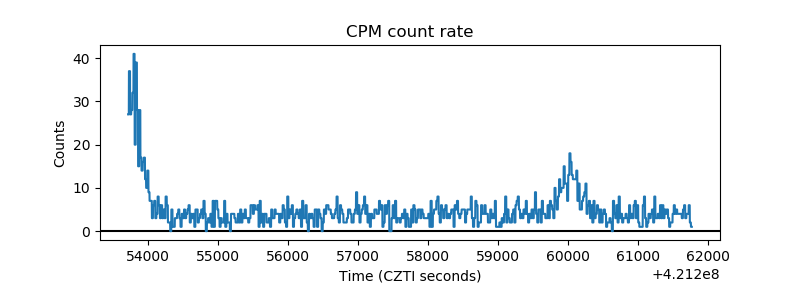 |
| CZT Counter | 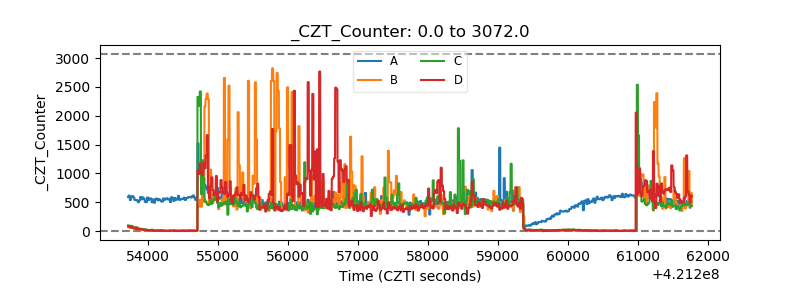 |
| +2.5 Volts monitor | 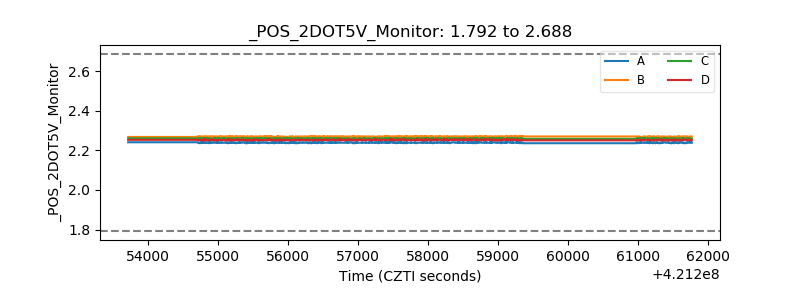 |
| +5 Volts monitor |  |
| _ROLL_ROT | 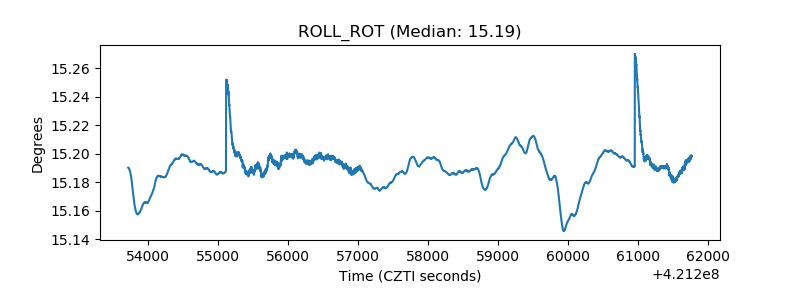 |
| _Roll_DEC | 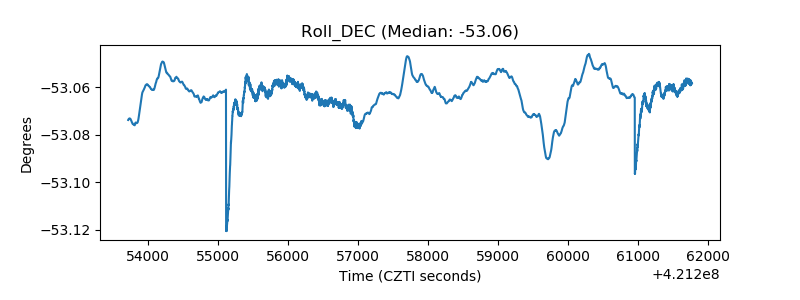 |
| _Roll_RA | 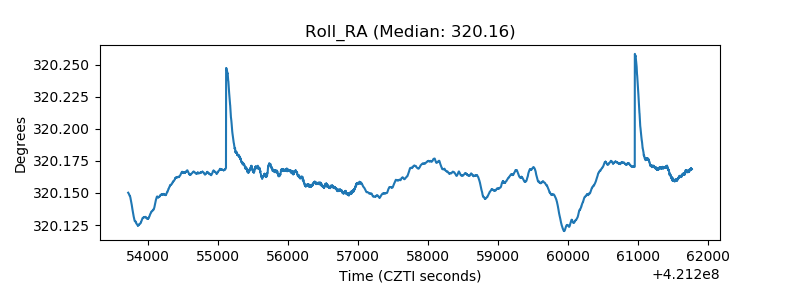 |
| Veto Counter | 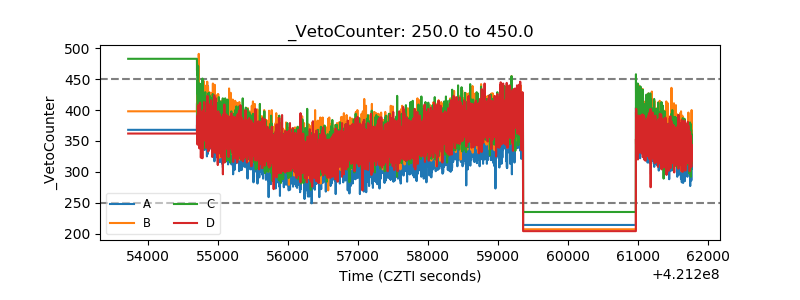 |