| Param | Original file | Final file |
|---|---|---|
| Filename | modeM0/AS1A12_052T04_9000005602_41146cztM0_level2.fits | modeM0/AS1A12_052T04_9000005602_41146cztM0_level2_quad_clean.evt |
| Size (bytes) | 390,268,800 | 93,003,840 |
| Size | 372.2 MB | 88.7 MB |
| Events in quadrant A | 2,970,765 | 636,476 |
| Events in quadrant B | 4,236,813 | 613,679 |
| Events in quadrant C | 3,345,883 | 604,074 |
| Events in quadrant D | 3,446,976 | 560,775 |
| Mode M0 | |||
|---|---|---|---|
| Quadrant | BADHDUFLAG | Total packets | Discarded packets |
| A | 0 | 12343 | 3 |
| B | 0 | 16628 | 2 |
| C | 0 | 13698 | 2 |
| D | 0 | 14473 | 2 |
| Mode M9 | |||
|---|---|---|---|
| Quadrant | BADHDUFLAG | Total packets | Discarded packets |
| A | 0 | 21 | 0 |
| B | 0 | 21 | 0 |
| C | 0 | 21 | 0 |
| D | 0 | 22 | 0 |
| Mode SS | |||
|---|---|---|---|
| Quadrant | BADHDUFLAG | Total packets | Discarded packets |
| A | 0 | 118 | 0 |
| B | 0 | 118 | 0 |
| C | 0 | 118 | 0 |
| D | 0 | 118 | 0 |
| Quadrant | Total seconds | Saturated seconds | Saturation percentage |
|---|---|---|---|
| A | 5734 | 12 | 0.209278% |
| B | 5734 | 347 | 6.051622% |
| C | 5734 | 74 | 1.290548% |
| D | 5734 | 138 | 2.406697% |
Noise dominated data is calculated using 1-second bins in cleaned event files. If a bin has >2000 counts, and if more than 50% of those come from <1% of pixels, then it is considered to be noise-dominated and hence unusable.
| Quadrant | # 1 sec bins | Bins with >0 counts | Bins with >2000 counts | High rate bins dominated by noise | Noise dominated (total time) | Noise dominated (detector-on time) | Marked lightcurve |
|---|---|---|---|---|---|---|---|
| A | 7077 | 5735 | 4 | 4 | 0.06% | 0.07% | 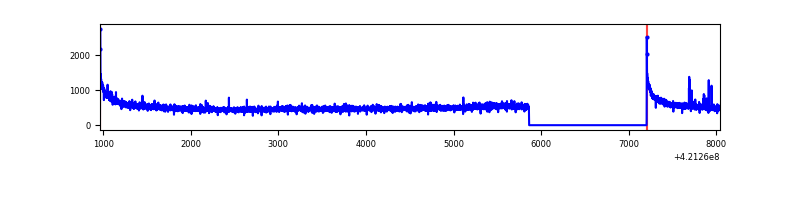 |
| B | 7077 | 5735 | 257 | 257 | 3.63% | 4.48% | 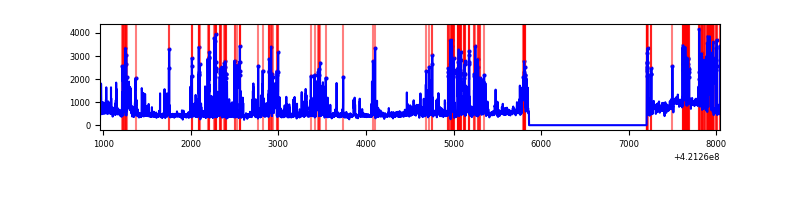 |
| C | 7077 | 5735 | 67 | 67 | 0.95% | 1.17% | 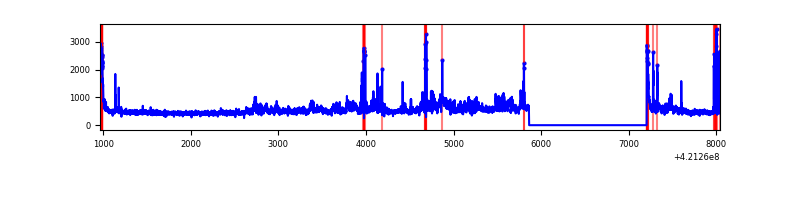 |
| D | 7077 | 5735 | 125 | 125 | 1.77% | 2.18% | 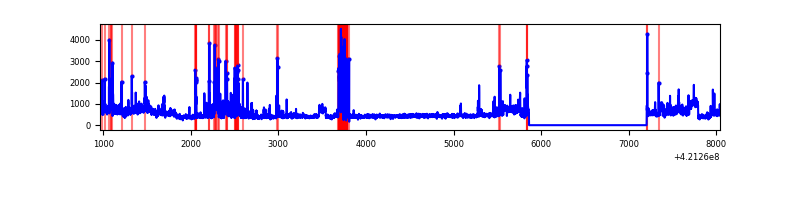 |
Top three noisy pixels from each quadrant. If the there are fewer than three noisy pixels in the level2.evt file, extra rows are filled as -1
| Pixel properties | Quadrant properties | ||||||
|---|---|---|---|---|---|---|---|
| Quadrant | DetID | PixID | Counts | Sigma | Mean | Median | Sigma |
| A | 10 | 83 | 543587 | 4237.09 | 620 | 606 | 128.1 |
| A | 13 | 248 | 13629 | 101.62 | 620 | 606 | 128.1 |
| A | 9 | 191 | 12938 | 96.23 | 620 | 606 | 128.1 |
| B | 0 | 245 | 1331744 | 11425.65 | 601 | 584 | 116.5 |
| B | 7 | 202 | 315053 | 2699.16 | 601 | 584 | 116.5 |
| B | 5 | 255 | 123613 | 1055.99 | 601 | 584 | 116.5 |
| C | 9 | 54 | 479720 | 3420.92 | 599 | 601 | 140.1 |
| C | 15 | 214 | 244921 | 1744.45 | 599 | 601 | 140.1 |
| C | 14 | 254 | 150961 | 1073.57 | 599 | 601 | 140.1 |
| D | 13 | 249 | 460489 | 3141.04 | 596 | 579 | 146.4 |
| D | 2 | 16 | 444804 | 3033.92 | 596 | 579 | 146.4 |
| D | 2 | 249 | 146030 | 993.39 | 596 | 579 | 146.4 |
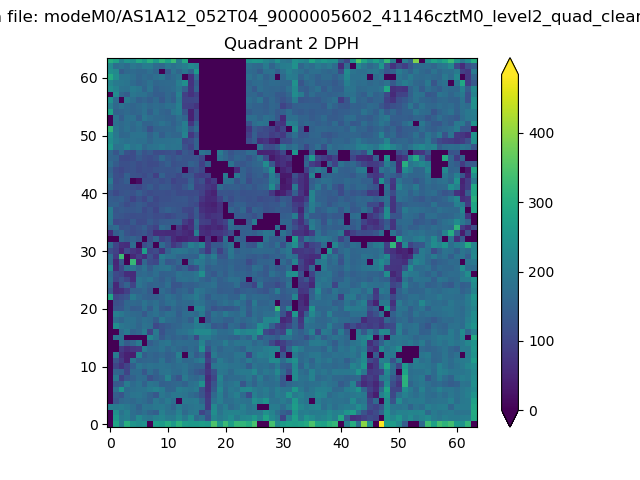
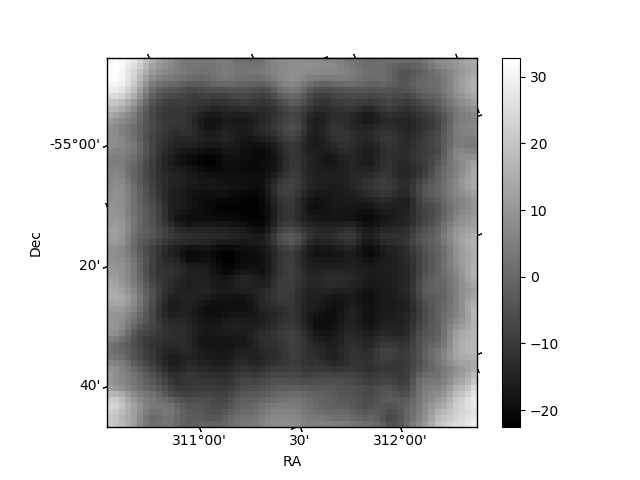
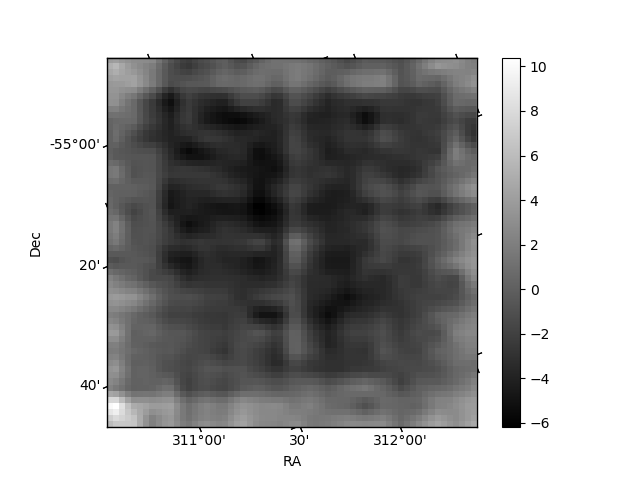
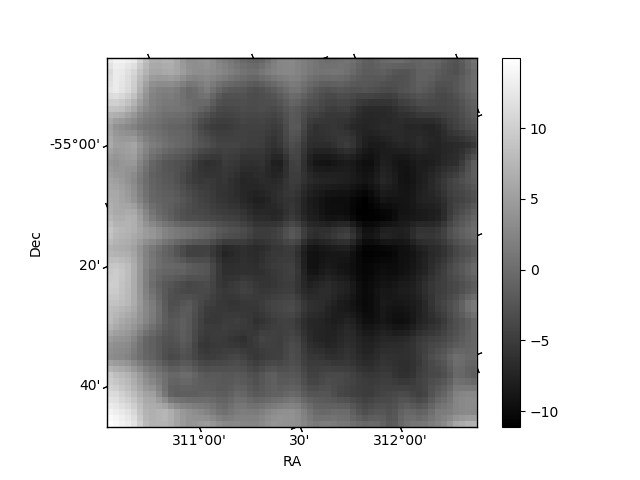
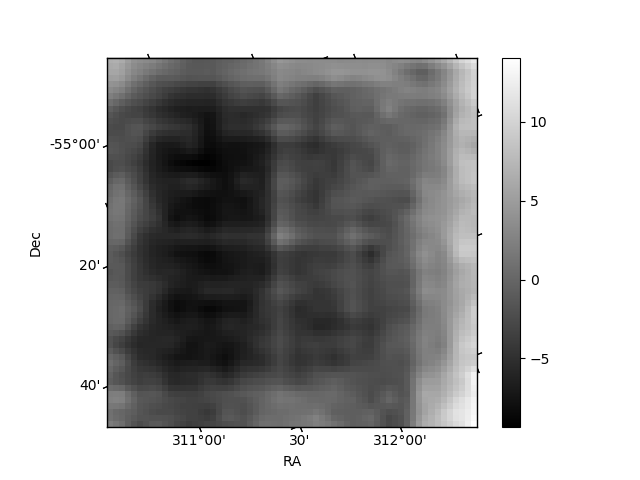
Histogram calculated using DETX and DETY for each event in the final _common_clean file
| Quadrant A | 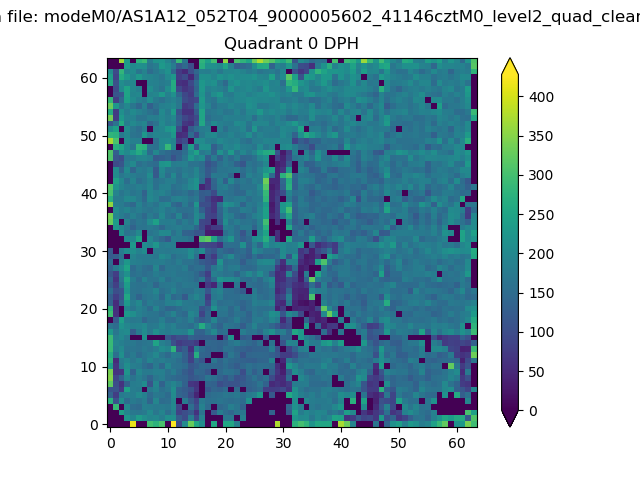 |
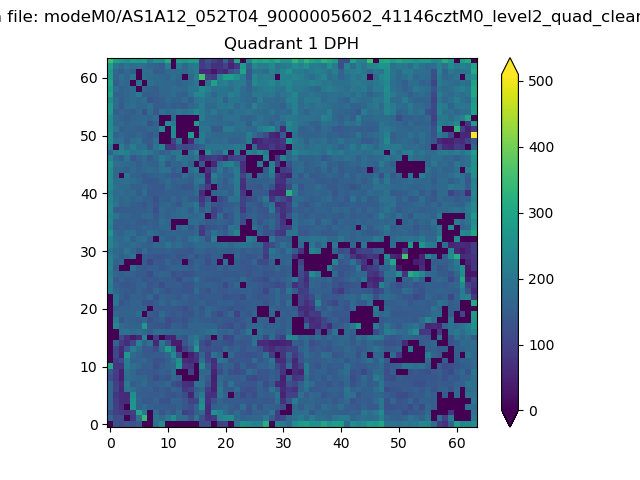 |
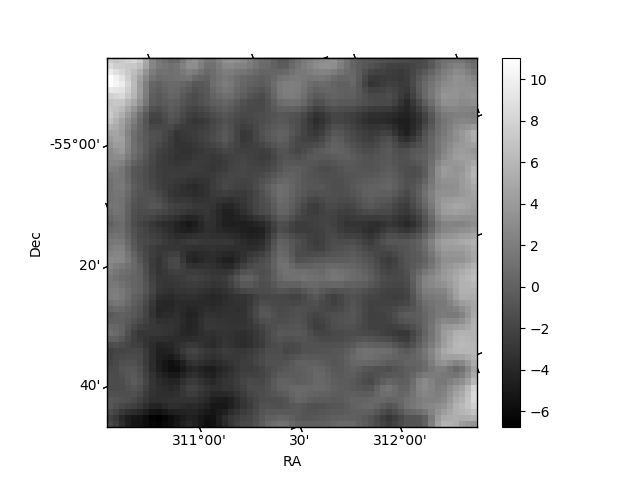
Quadrant B |
|---|---|---|---|
| Quadrant D | 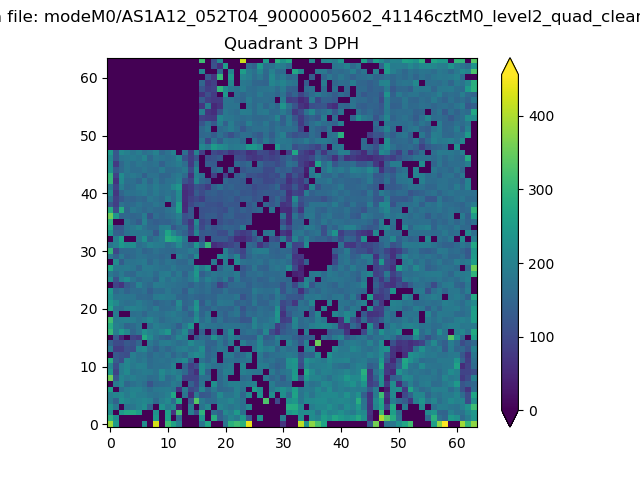 |
 |
Quadrant C |
| Plot type | Count rate plots | Images |
|---|---|---|
| Comparison with Poisson distribution Blue bars denote a histogram of data divided into 1 sec bins. Red curve is a Poisson curve with rate = median count rate of data. |
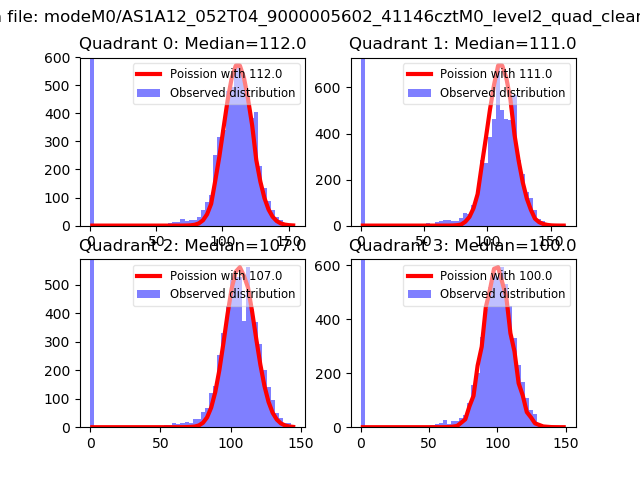 |
 |
| Quadrant-wise count rates Data is divided into 100 sec bins |
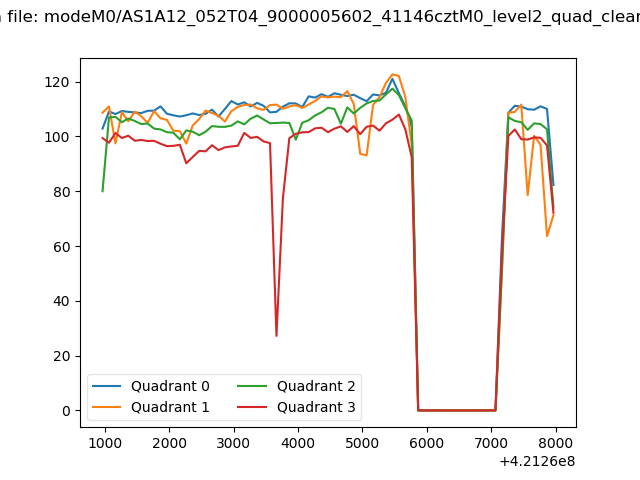 |
|
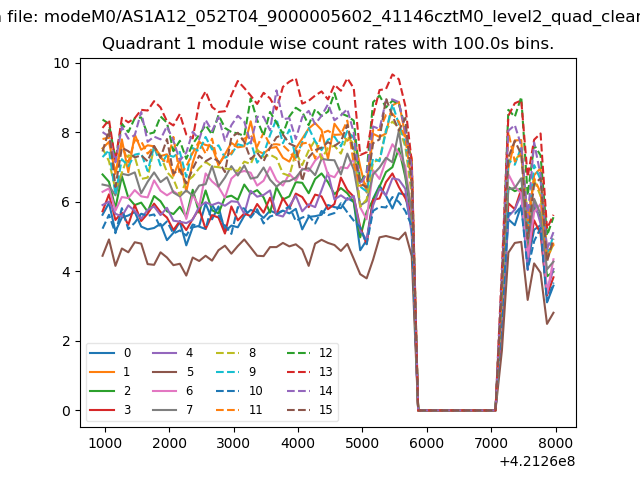
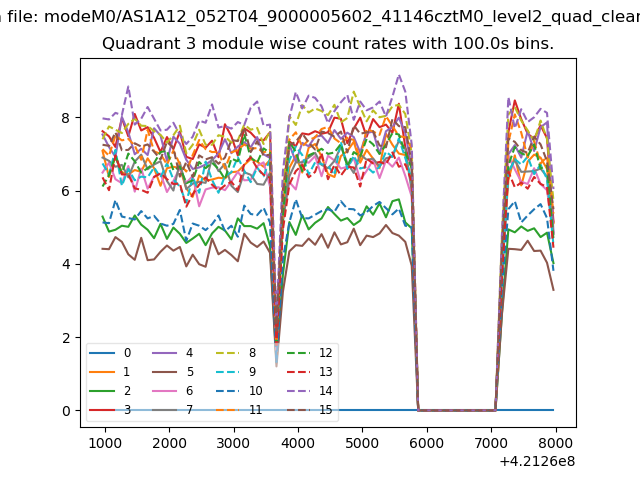
| Module-wise count rates for Quadrant A Data is divided into 100 sec bins |
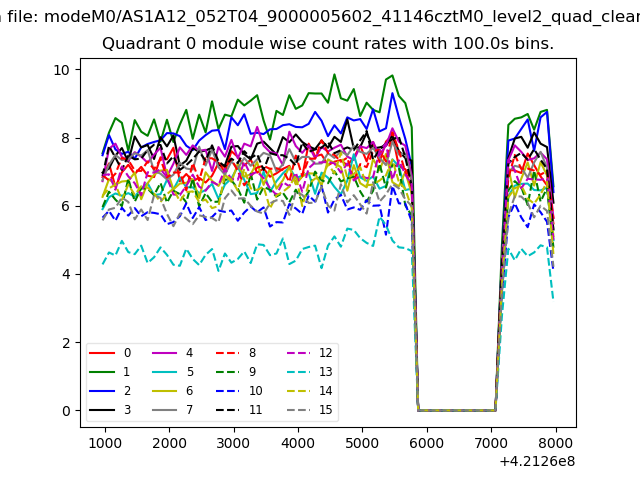 |
 |
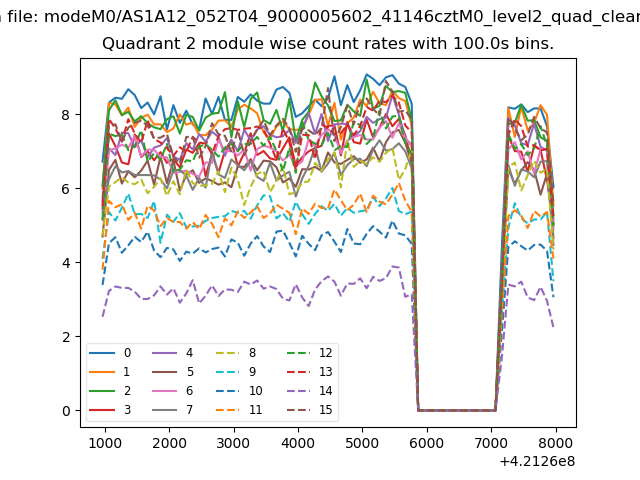
| Module-wise count rates for Quadrant B Data is divided into 100 sec bins |
 |
 |
| Module-wise count rates for Quadrant C Data is divided into 100 sec bins |
 |
 |
| Module-wise count rates for Quadrant D Data is divided into 100 sec bins |
 |
 |
| Parameter | Plot |
|---|---|
| CZT HV Monitor | 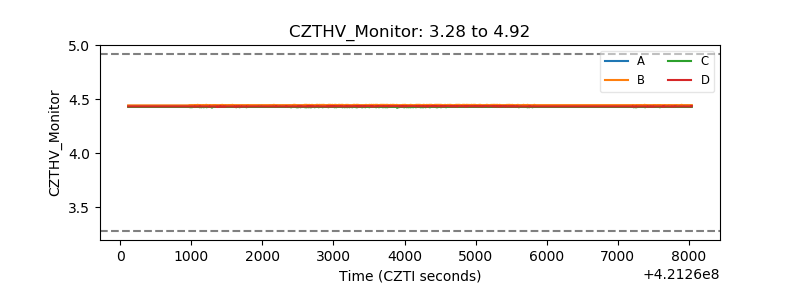 |
| D_VDD | 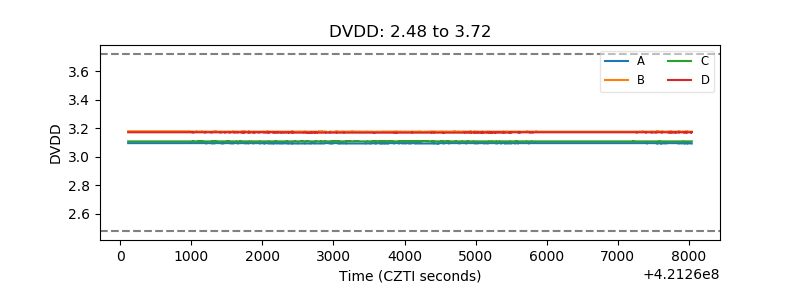 |
| Temperature 1 | 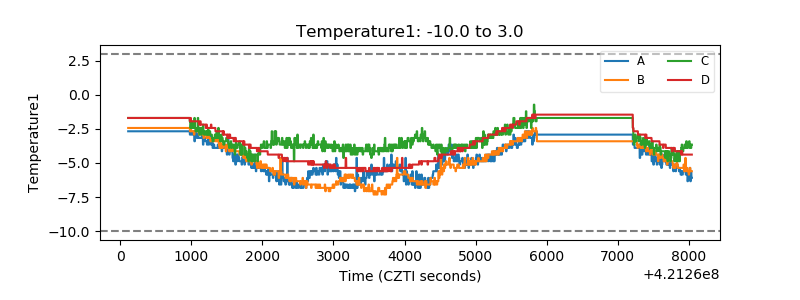 |
| Veto HV Monitor |  |
| Veto LLD | 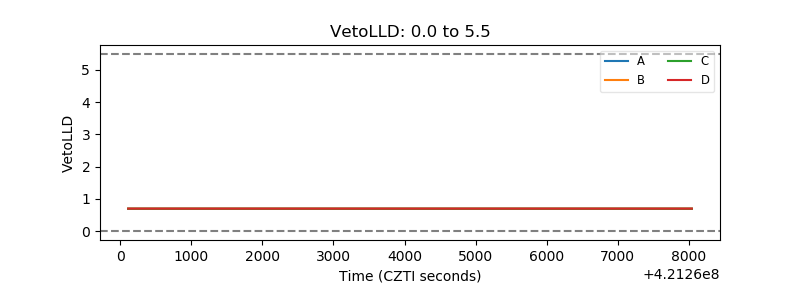 |
| Alpha Counter | 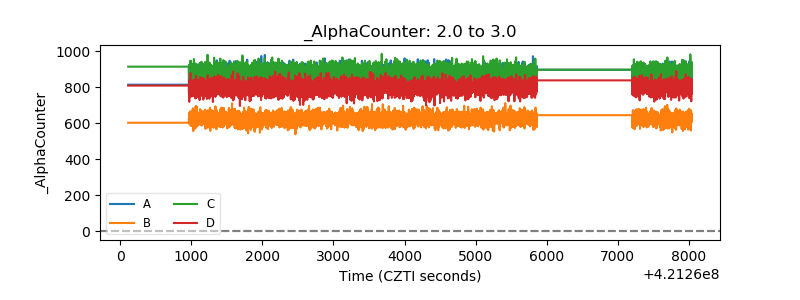 |
| _CPM_Rate | 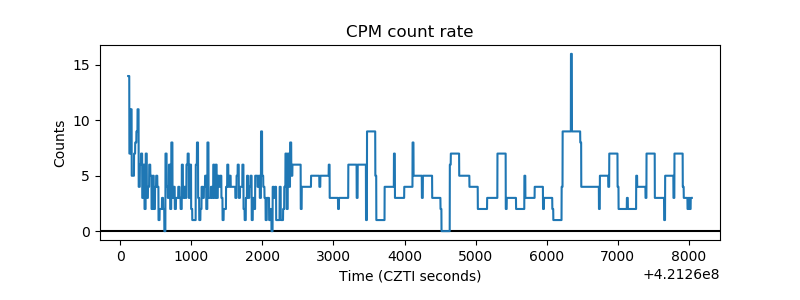 |
| CZT Counter | 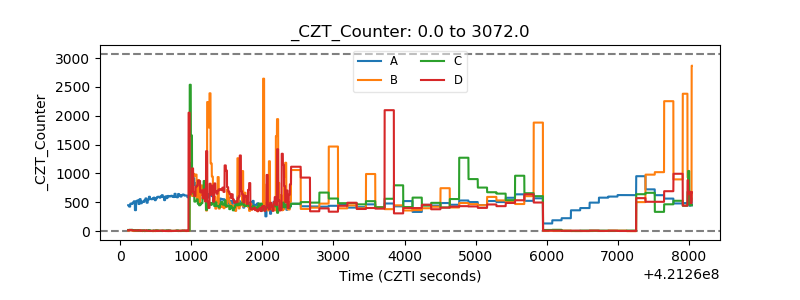 |
| +2.5 Volts monitor | 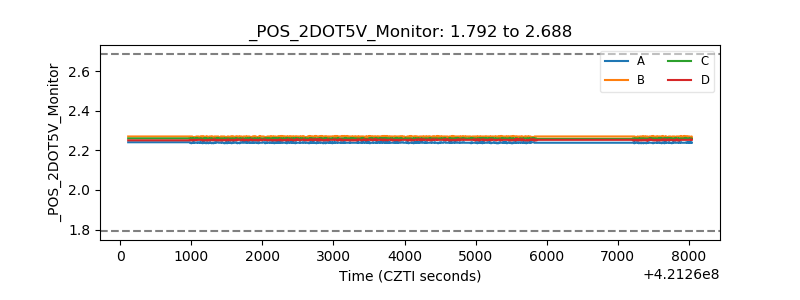 |
| +5 Volts monitor |  |
| _ROLL_ROT | 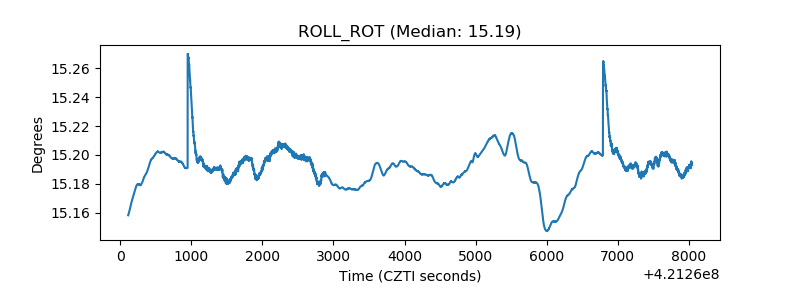 |
| _Roll_DEC | 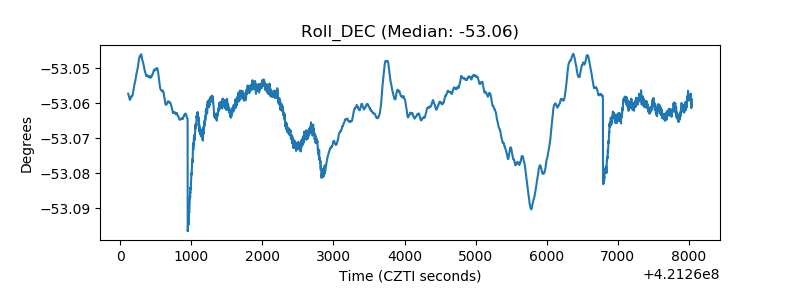 |
| _Roll_RA | 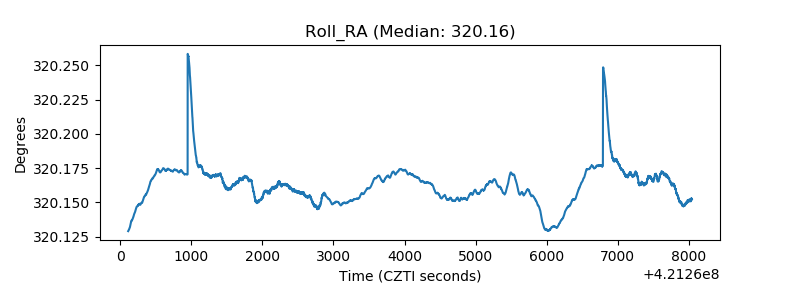 |
| Veto Counter | 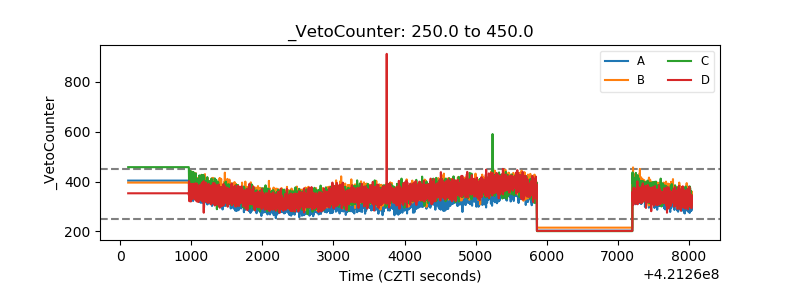 |