| Param | Original file | Final file |
|---|---|---|
| Filename | modeM0/AS1A12_052T04_9000005602_41147cztM0_level2.fits | modeM0/AS1A12_052T04_9000005602_41147cztM0_level2_quad_clean.evt |
| Size (bytes) | 450,282,240 | 102,090,240 |
| Size | 429.4 MB | 97.4 MB |
| Events in quadrant A | 3,262,567 | 696,875 |
| Events in quadrant B | 5,269,762 | 668,069 |
| Events in quadrant C | 3,854,900 | 661,455 |
| Events in quadrant D | 3,788,319 | 621,911 |
| Mode M0 | |||
|---|---|---|---|
| Quadrant | BADHDUFLAG | Total packets | Discarded packets |
| A | 0 | 13532 | 3 |
| B | 0 | 20092 | 2 |
| C | 0 | 15504 | 2 |
| D | 0 | 15877 | 2 |
| Mode M9 | |||
|---|---|---|---|
| Quadrant | BADHDUFLAG | Total packets | Discarded packets |
| A | 0 | 26 | 0 |
| B | 0 | 26 | 0 |
| C | 0 | 26 | 0 |
| D | 0 | 26 | 0 |
| Mode SS | |||
|---|---|---|---|
| Quadrant | BADHDUFLAG | Total packets | Discarded packets |
| A | 0 | 132 | 0 |
| B | 0 | 132 | 0 |
| C | 0 | 132 | 0 |
| D | 0 | 132 | 0 |
| Quadrant | Total seconds | Saturated seconds | Saturation percentage |
|---|---|---|---|
| A | 6339 | 9 | 0.141978% |
| B | 6339 | 506 | 7.982332% |
| C | 6339 | 96 | 1.514434% |
| D | 6339 | 100 | 1.577536% |
Noise dominated data is calculated using 1-second bins in cleaned event files. If a bin has >2000 counts, and if more than 50% of those come from <1% of pixels, then it is considered to be noise-dominated and hence unusable.
| Quadrant | # 1 sec bins | Bins with >0 counts | Bins with >2000 counts | High rate bins dominated by noise | Noise dominated (total time) | Noise dominated (detector-on time) | Marked lightcurve |
|---|---|---|---|---|---|---|---|
| A | 8964 | 6341 | 3 | 3 | 0.03% | 0.05% | 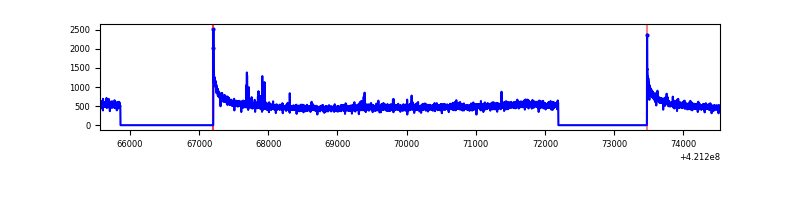 |
| B | 8964 | 6341 | 405 | 405 | 4.52% | 6.39% | 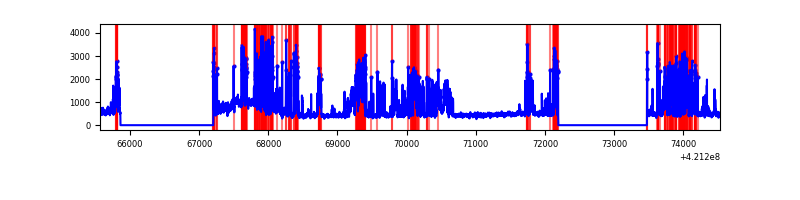 |
| C | 8964 | 6341 | 91 | 91 | 1.02% | 1.44% | 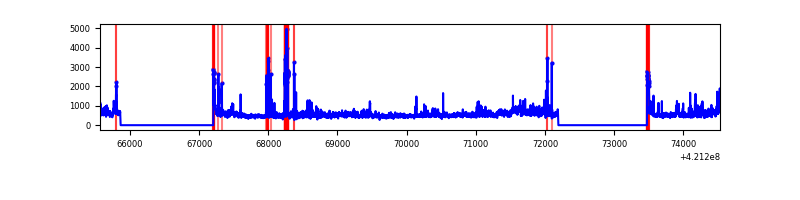 |
| D | 8964 | 6341 | 90 | 90 | 1.00% | 1.42% | 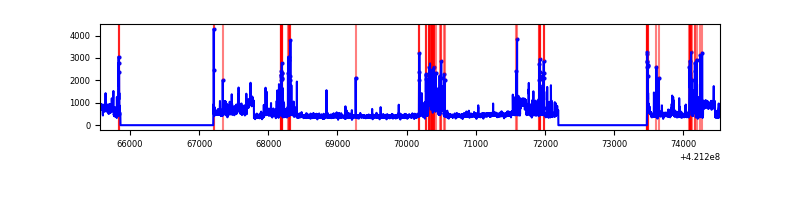 |
Top three noisy pixels from each quadrant. If the there are fewer than three noisy pixels in the level2.evt file, extra rows are filled as -1
| Pixel properties | Quadrant properties | ||||||
|---|---|---|---|---|---|---|---|
| Quadrant | DetID | PixID | Counts | Sigma | Mean | Median | Sigma |
| A | 10 | 83 | 564602 | 3992.33 | 688 | 674 | 141.3 |
| A | 13 | 248 | 13953 | 94.01 | 688 | 674 | 141.3 |
| A | 9 | 191 | 10261 | 67.87 | 688 | 674 | 141.3 |
| B | 0 | 245 | 2236367 | 17281.94 | 665 | 647 | 129.4 |
| B | 7 | 202 | 392735 | 3030.81 | 665 | 647 | 129.4 |
| B | 5 | 255 | 19359 | 144.64 | 665 | 647 | 129.4 |
| C | 9 | 54 | 596491 | 3835.68 | 665 | 668 | 155.3 |
| C | 15 | 214 | 269570 | 1731.09 | 665 | 668 | 155.3 |
| C | 14 | 254 | 250847 | 1610.56 | 665 | 668 | 155.3 |
| D | 13 | 249 | 564560 | 3461.53 | 668 | 650 | 162.9 |
| D | 2 | 16 | 443444 | 2718.07 | 668 | 650 | 162.9 |
| D | 2 | 249 | 117305 | 716.08 | 668 | 650 | 162.9 |
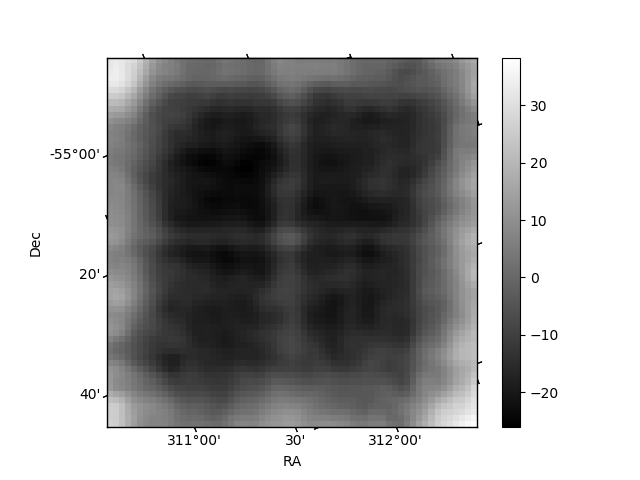
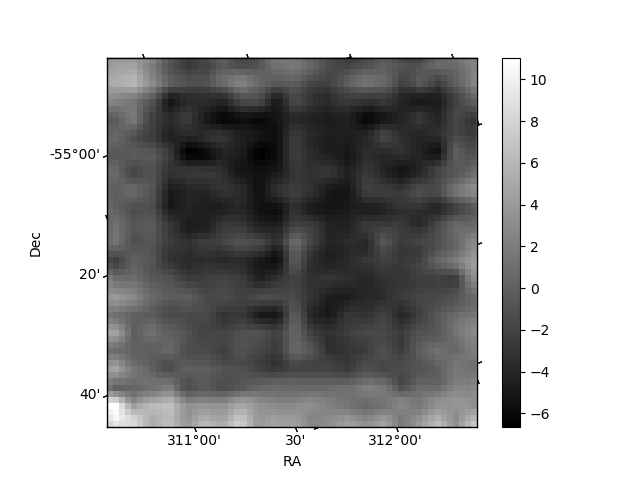
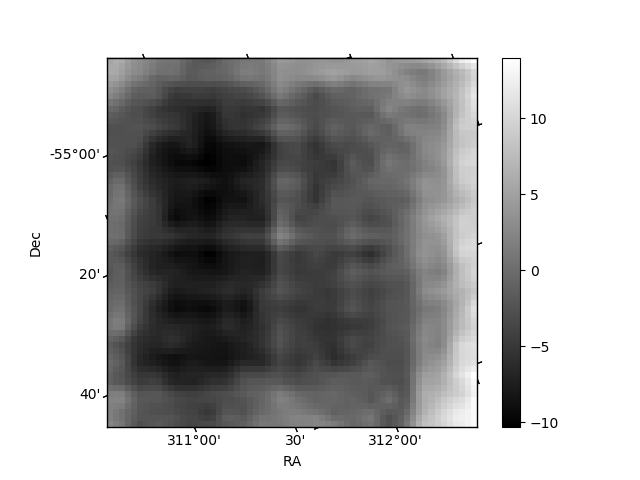
Histogram calculated using DETX and DETY for each event in the final _common_clean file
| Quadrant A | 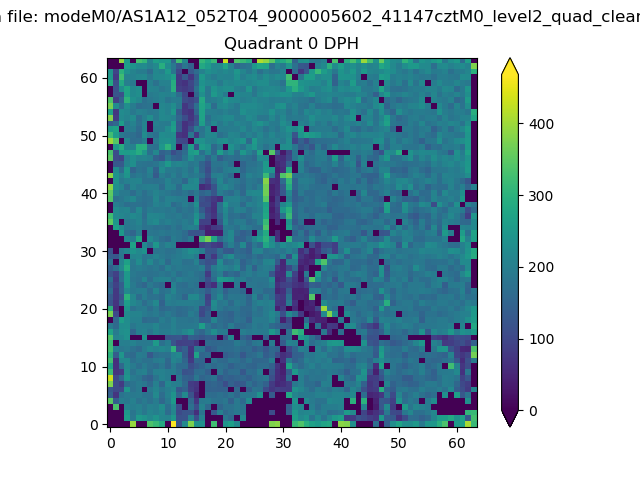 |
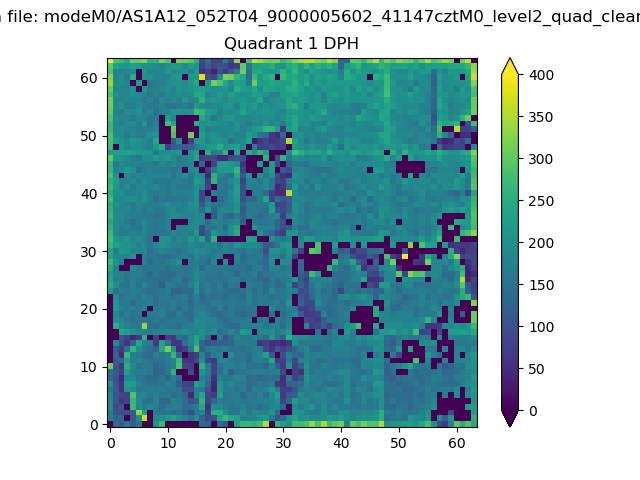 |
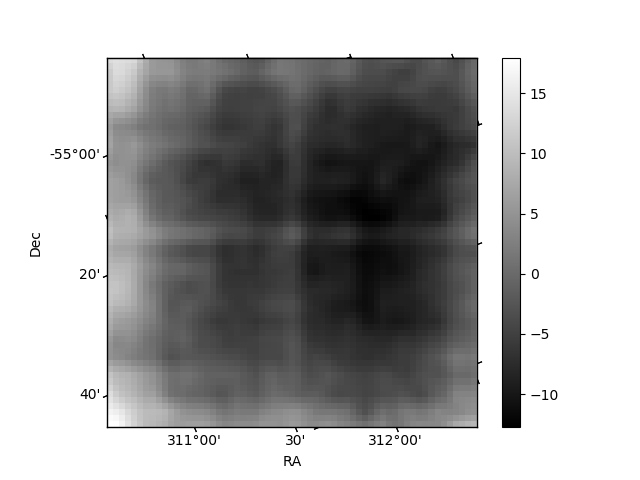
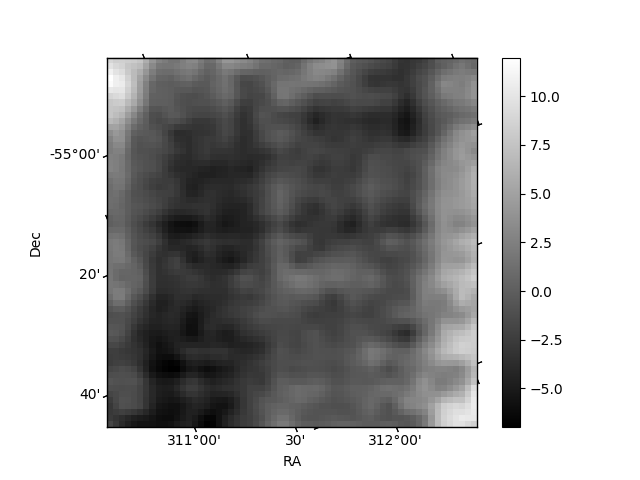
Quadrant B |
|---|---|---|---|
| Quadrant D | 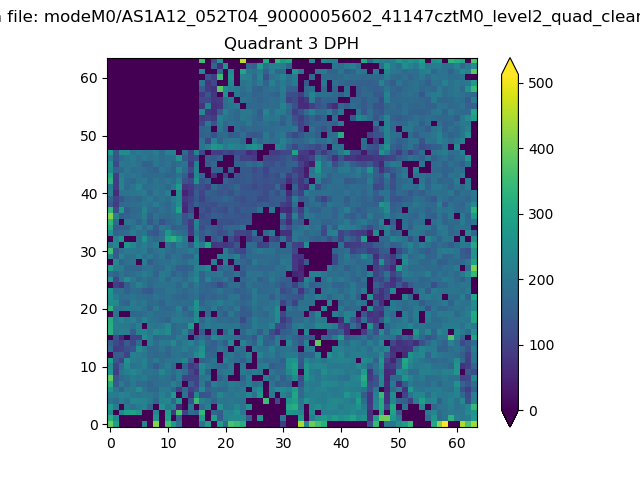 |
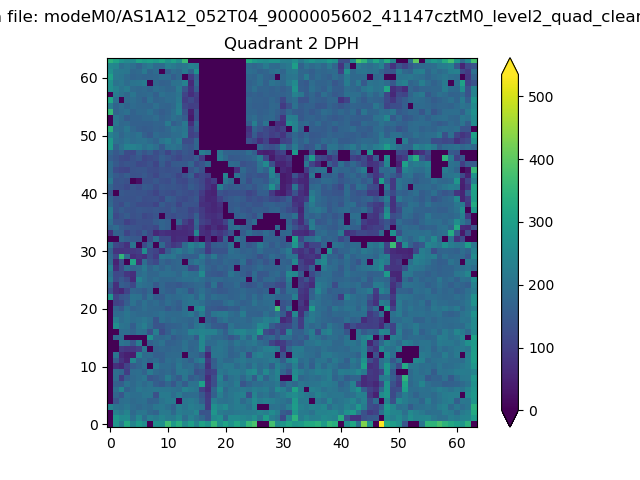 |
Quadrant C |
| Plot type | Count rate plots | Images |
|---|---|---|
| Comparison with Poisson distribution Blue bars denote a histogram of data divided into 1 sec bins. Red curve is a Poisson curve with rate = median count rate of data. |
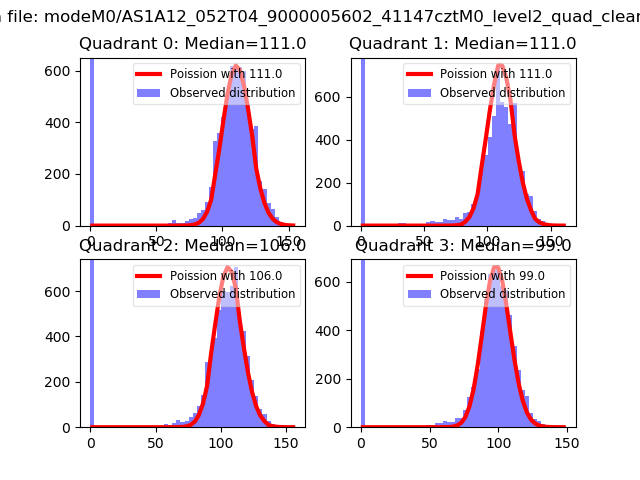 |
 |
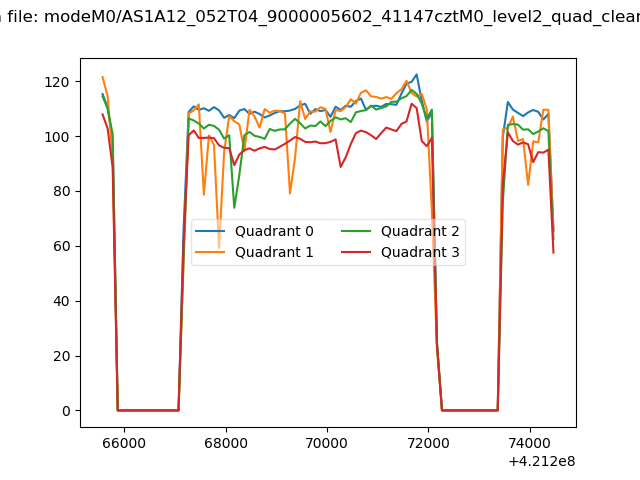
| Quadrant-wise count rates Data is divided into 100 sec bins |
 |
|
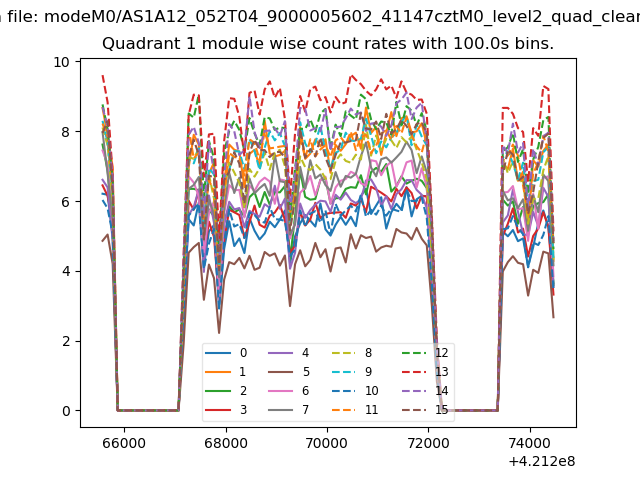
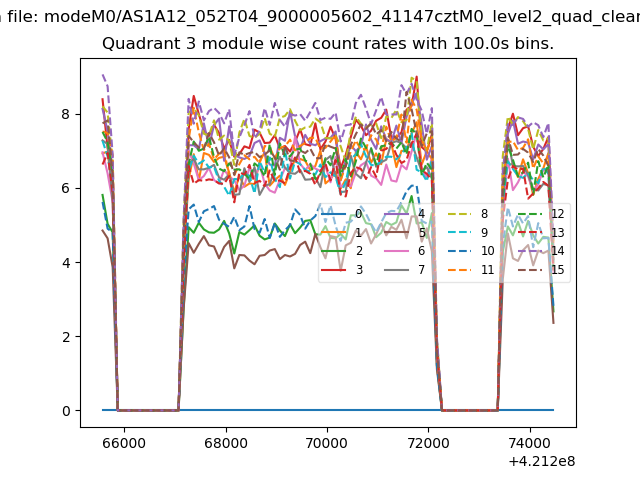
| Module-wise count rates for Quadrant A Data is divided into 100 sec bins |
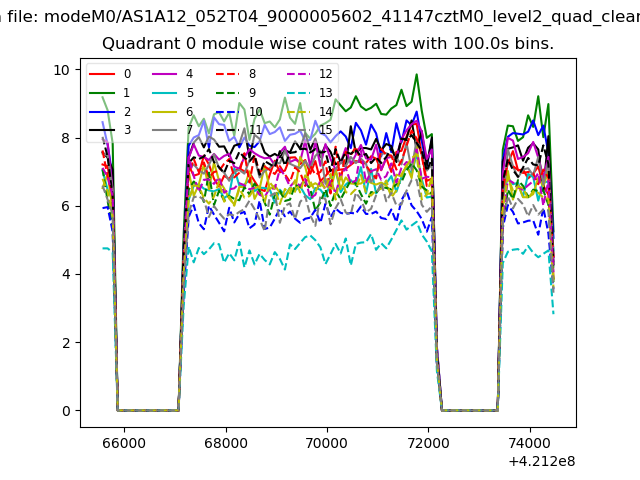 |
 |
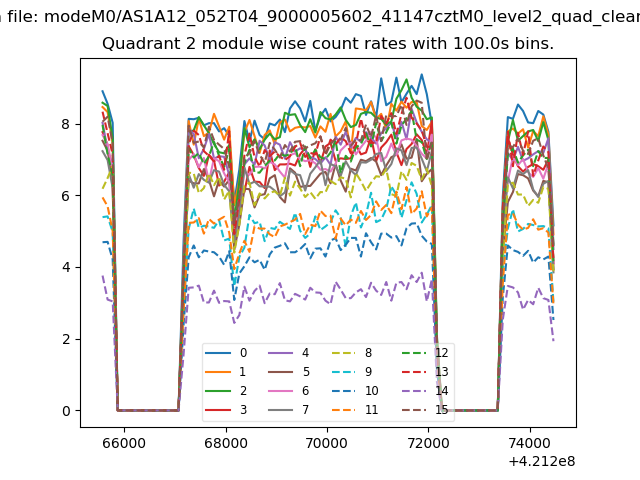
| Module-wise count rates for Quadrant B Data is divided into 100 sec bins |
 |
 |
| Module-wise count rates for Quadrant C Data is divided into 100 sec bins |
 |
 |
| Module-wise count rates for Quadrant D Data is divided into 100 sec bins |
 |
 |
| Parameter | Plot |
|---|---|
| CZT HV Monitor | 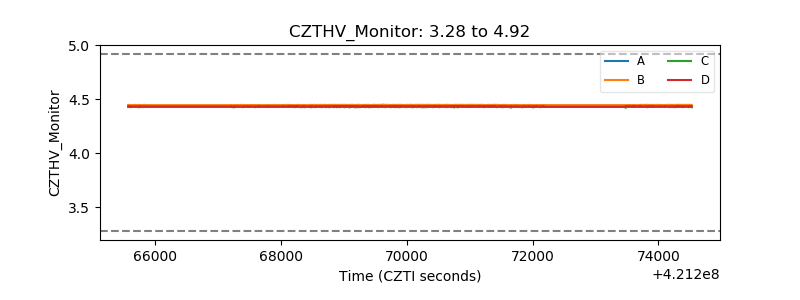 |
| D_VDD | 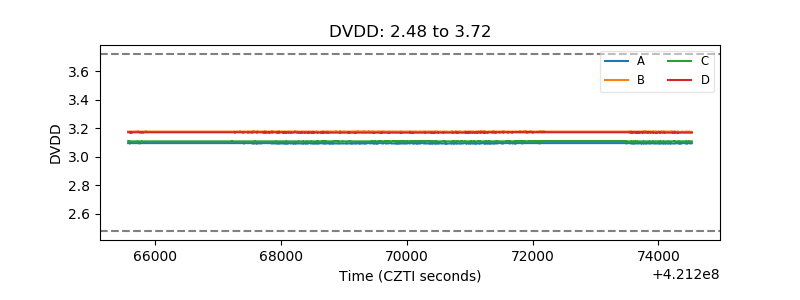 |
| Temperature 1 | 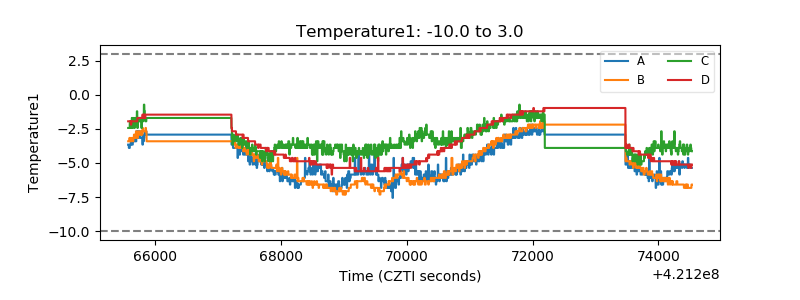 |
| Veto HV Monitor | 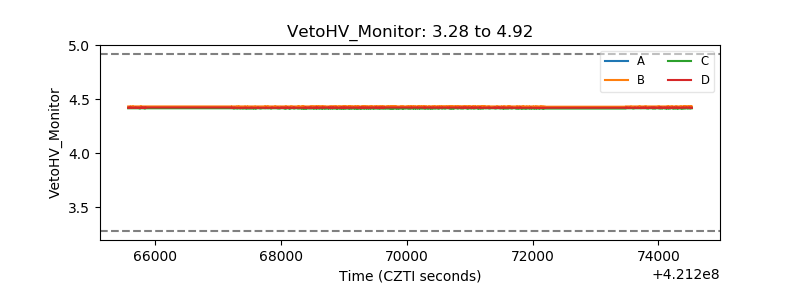 |
| Veto LLD | 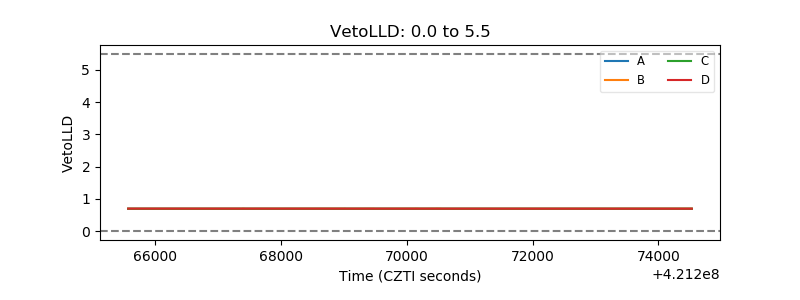 |
| Alpha Counter | 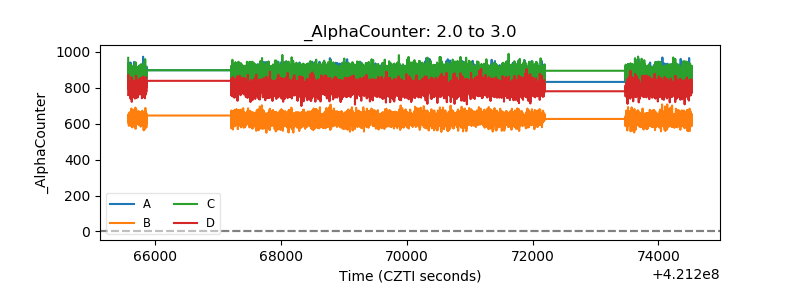 |
| _CPM_Rate | 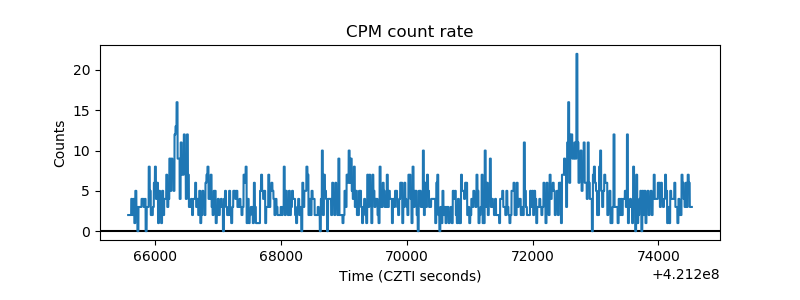 |
| CZT Counter | 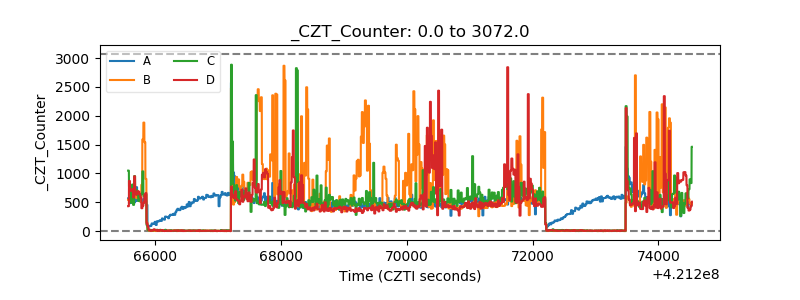 |
| +2.5 Volts monitor | 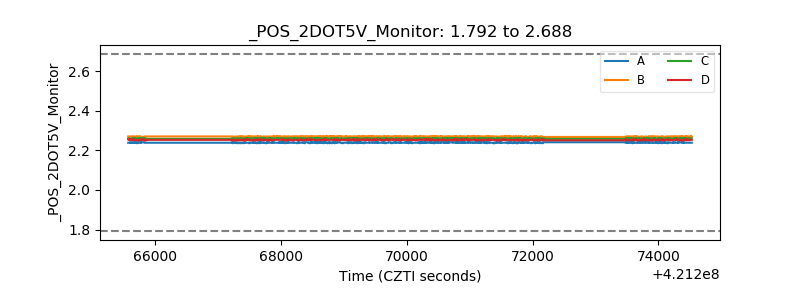 |
| +5 Volts monitor | 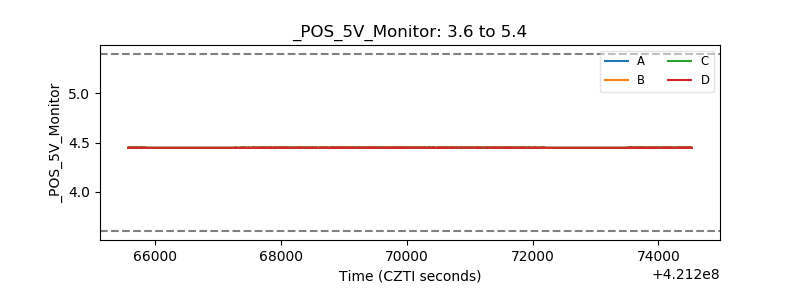 |
| _ROLL_ROT | 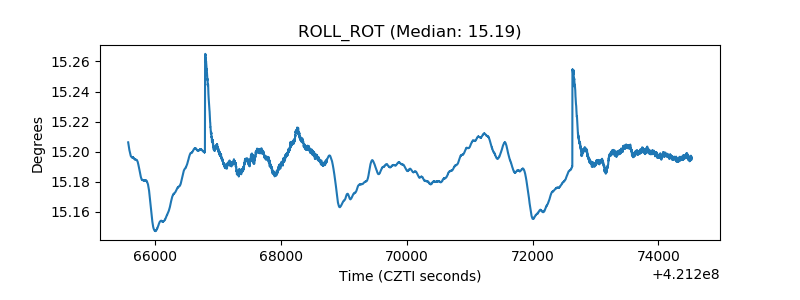 |
| _Roll_DEC | 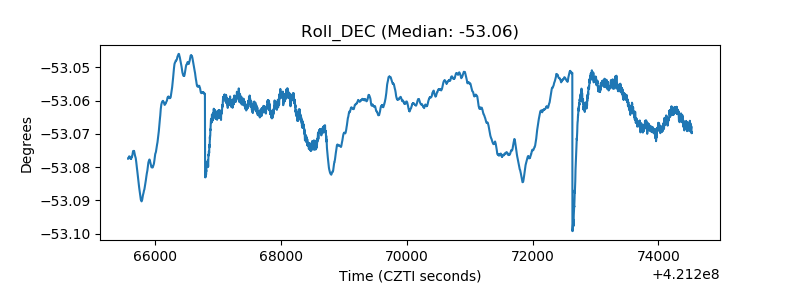 |
| _Roll_RA | 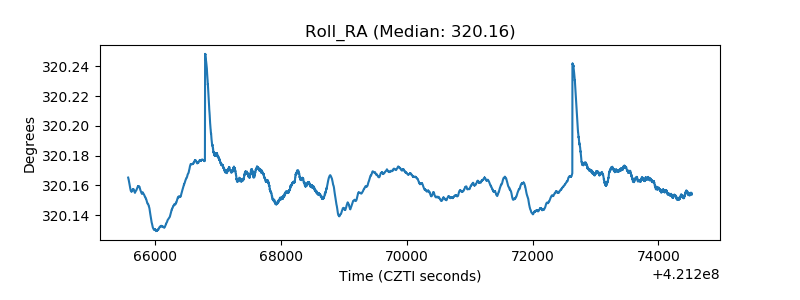 |
| Veto Counter | 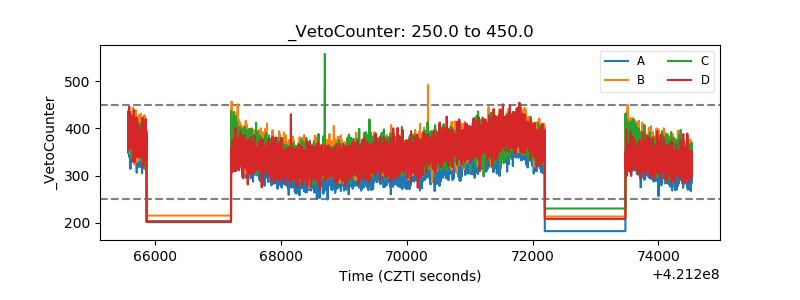 |