| Param | Original file | Final file |
|---|---|---|
| Filename | modeM0/AS1A12_052T04_9000005602_41149cztM0_level2.fits | modeM0/AS1A12_052T04_9000005602_41149cztM0_level2_quad_clean.evt |
| Size (bytes) | 405,889,920 | 89,136,000 |
| Size | 387.1 MB | 85.0 MB |
| Events in quadrant A | 2,896,628 | 606,077 |
| Events in quadrant B | 3,797,896 | 592,146 |
| Events in quadrant C | 4,627,244 | 577,693 |
| Events in quadrant D | 3,273,412 | 536,064 |
| Mode M0 | |||
|---|---|---|---|
| Quadrant | BADHDUFLAG | Total packets | Discarded packets |
| A | 0 | 12045 | 2 |
| B | 0 | 15149 | 2 |
| C | 0 | 17524 | 2 |
| D | 0 | 13739 | 2 |
| Mode M9 | |||
|---|---|---|---|
| Quadrant | BADHDUFLAG | Total packets | Discarded packets |
| A | 0 | 26 | 0 |
| B | 0 | 26 | 0 |
| C | 0 | 26 | 0 |
| D | 0 | 26 | 0 |
| Mode SS | |||
|---|---|---|---|
| Quadrant | BADHDUFLAG | Total packets | Discarded packets |
| A | 0 | 114 | 0 |
| B | 0 | 114 | 0 |
| C | 0 | 114 | 0 |
| D | 0 | 114 | 0 |
| Quadrant | Total seconds | Saturated seconds | Saturation percentage |
|---|---|---|---|
| A | 5529 | 13 | 0.235124% |
| B | 5529 | 272 | 4.919515% |
| C | 5529 | 72 | 1.302225% |
| D | 5529 | 148 | 2.676795% |
Noise dominated data is calculated using 1-second bins in cleaned event files. If a bin has >2000 counts, and if more than 50% of those come from <1% of pixels, then it is considered to be noise-dominated and hence unusable.
| Quadrant | # 1 sec bins | Bins with >0 counts | Bins with >2000 counts | High rate bins dominated by noise | Noise dominated (total time) | Noise dominated (detector-on time) | Marked lightcurve |
|---|---|---|---|---|---|---|---|
| A | 8124 | 5531 | 3 | 3 | 0.04% | 0.05% | 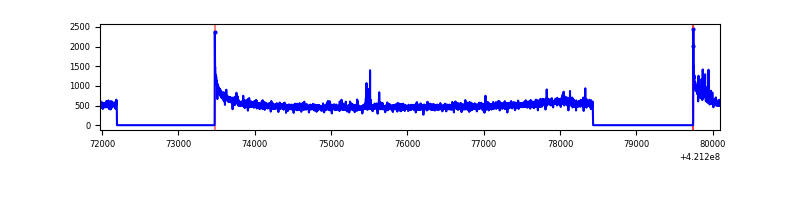 |
| B | 8124 | 5531 | 189 | 189 | 2.33% | 3.42% | 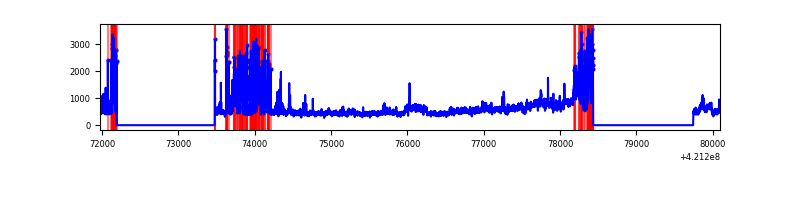 |
| C | 8124 | 5531 | 57 | 57 | 0.70% | 1.03% | 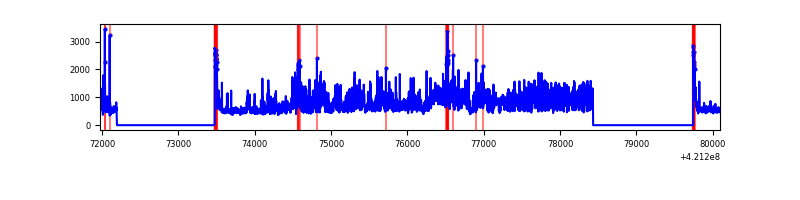 |
| D | 8124 | 5531 | 128 | 128 | 1.58% | 2.31% | 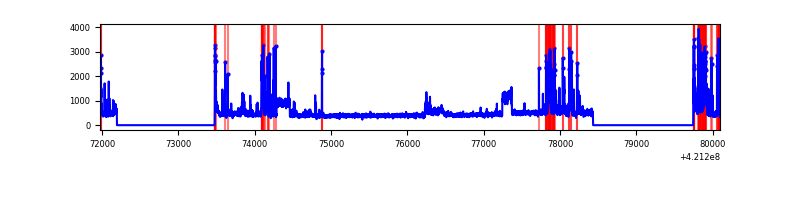 |
Top three noisy pixels from each quadrant. If the there are fewer than three noisy pixels in the level2.evt file, extra rows are filled as -1
| Pixel properties | Quadrant properties | ||||||
|---|---|---|---|---|---|---|---|
| Quadrant | DetID | PixID | Counts | Sigma | Mean | Median | Sigma |
| A | 10 | 83 | 498399 | 3967.08 | 603 | 590 | 125.5 |
| A | 12 | 189 | 33341 | 261.0 | 603 | 590 | 125.5 |
| A | 2 | 79 | 17136 | 131.86 | 603 | 590 | 125.5 |
| B | 0 | 245 | 759992 | 6700.43 | 588 | 573 | 113.3 |
| B | 7 | 202 | 577461 | 5089.94 | 588 | 573 | 113.3 |
| B | 0 | 186 | 127253 | 1117.71 | 588 | 573 | 113.3 |
| C | 9 | 54 | 1826546 | 13339.25 | 585 | 589 | 136.9 |
| C | 15 | 214 | 233867 | 1704.18 | 585 | 589 | 136.9 |
| C | 0 | 10 | 108741 | 790.09 | 585 | 589 | 136.9 |
| D | 13 | 249 | 464671 | 3210.83 | 585 | 567 | 144.5 |
| D | 2 | 16 | 345411 | 2385.75 | 585 | 567 | 144.5 |
| D | 2 | 249 | 156210 | 1076.79 | 585 | 567 | 144.5 |
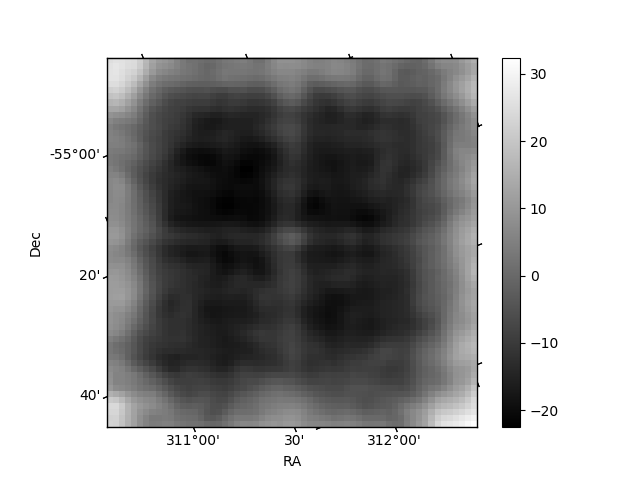
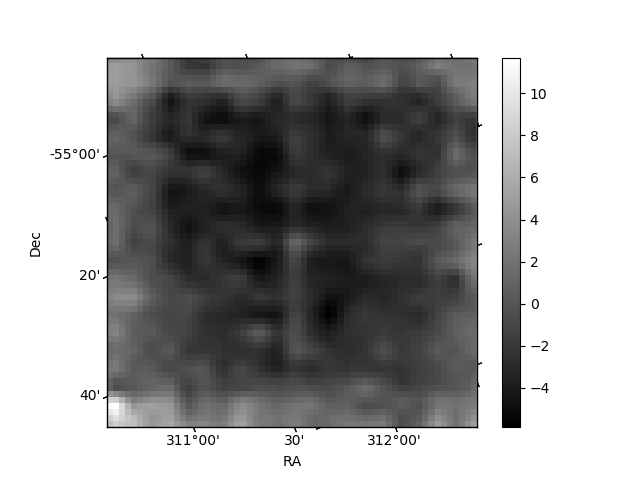
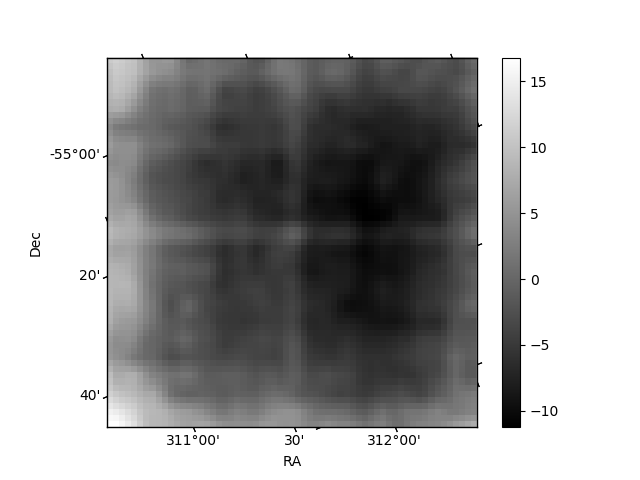
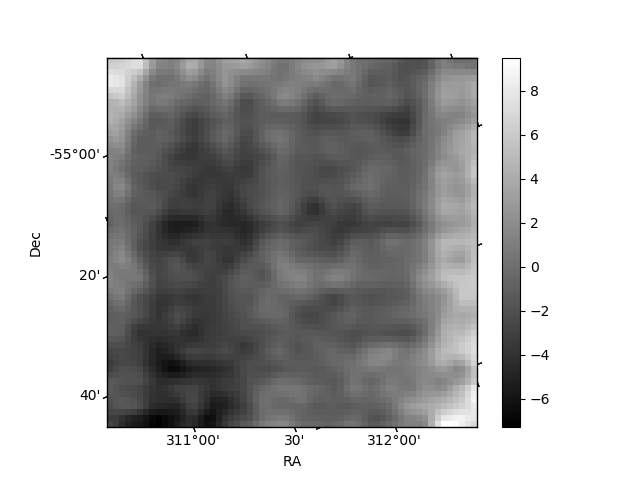
Histogram calculated using DETX and DETY for each event in the final _common_clean file
| Quadrant A | 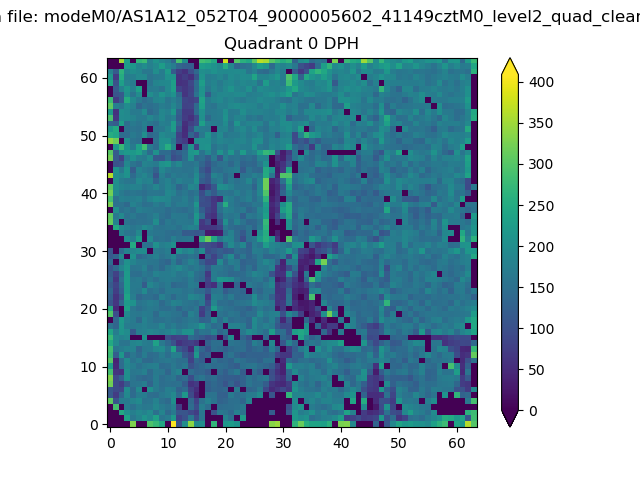 |
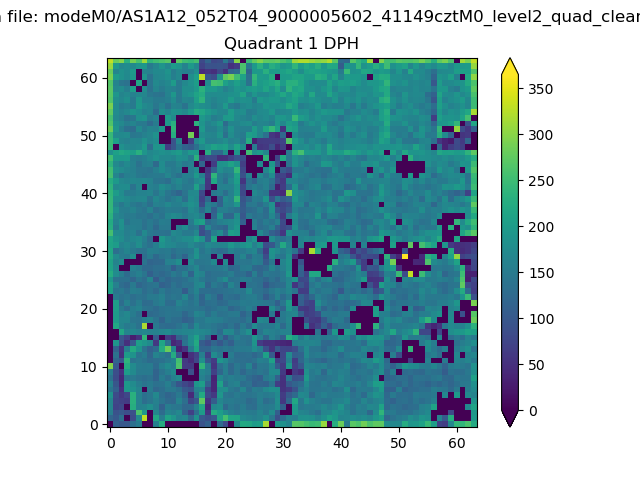 |
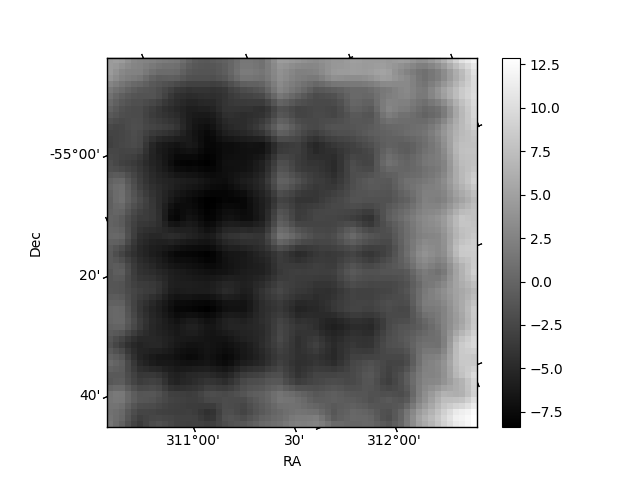
Quadrant B |
|---|---|---|---|
| Quadrant D |  |
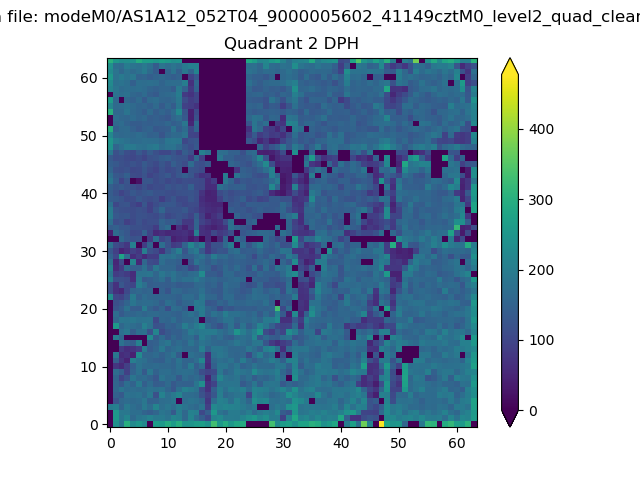 |
Quadrant C |
| Plot type | Count rate plots | Images |
|---|---|---|
| Comparison with Poisson distribution Blue bars denote a histogram of data divided into 1 sec bins. Red curve is a Poisson curve with rate = median count rate of data. |
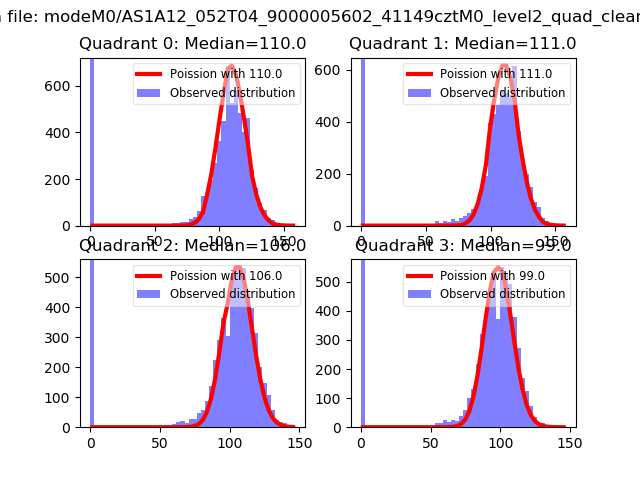 |
 |
| Quadrant-wise count rates Data is divided into 100 sec bins |
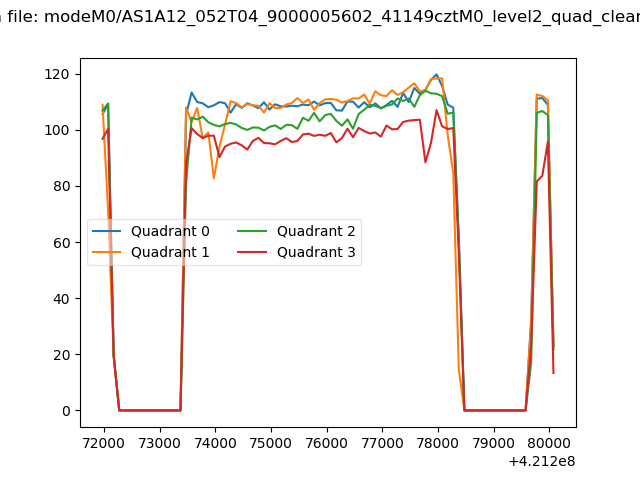 |
|
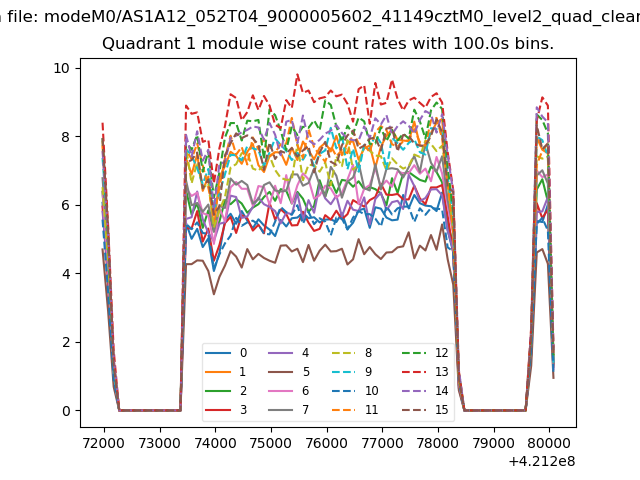
| Module-wise count rates for Quadrant A Data is divided into 100 sec bins |
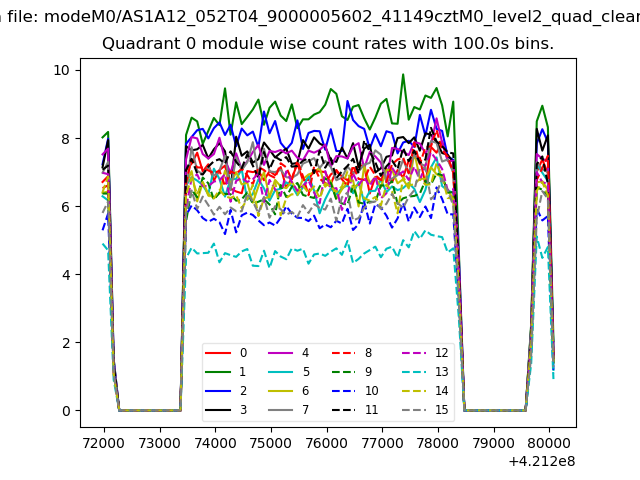 |
 |
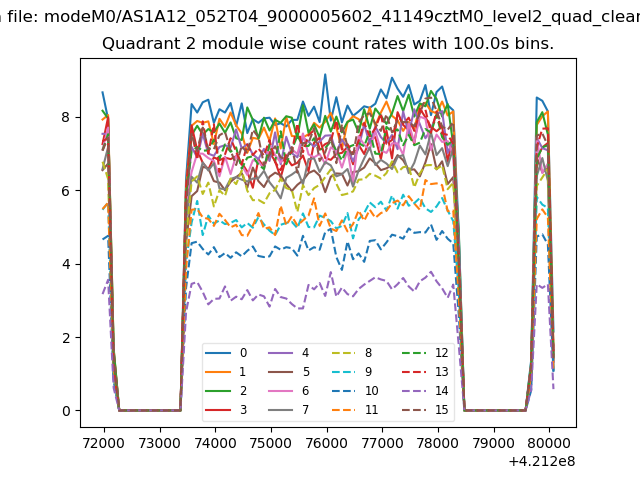
| Module-wise count rates for Quadrant B Data is divided into 100 sec bins |
 |
 |
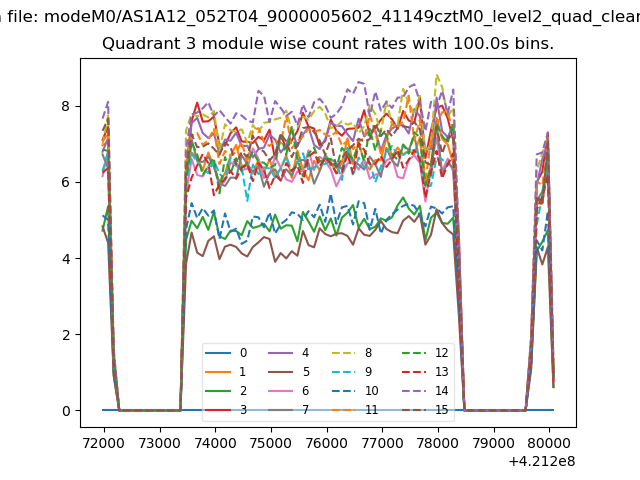
| Module-wise count rates for Quadrant C Data is divided into 100 sec bins |
 |
 |
| Module-wise count rates for Quadrant D Data is divided into 100 sec bins |
 |
 |
| Parameter | Plot |
|---|---|
| CZT HV Monitor | 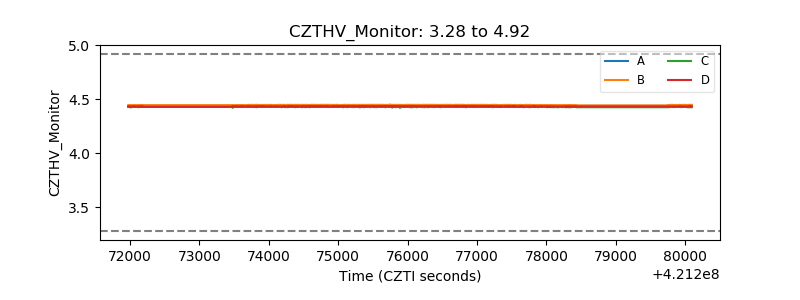 |
| D_VDD | 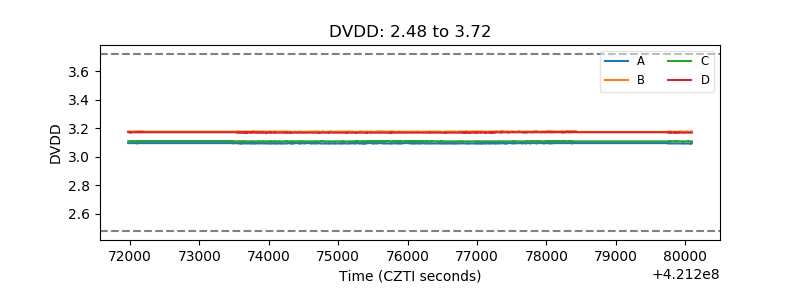 |
| Temperature 1 | 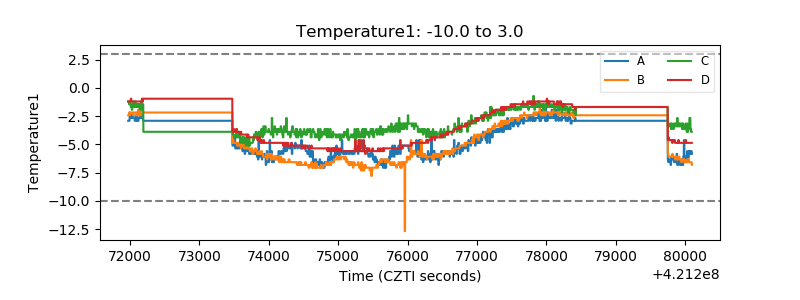 |
| Veto HV Monitor | 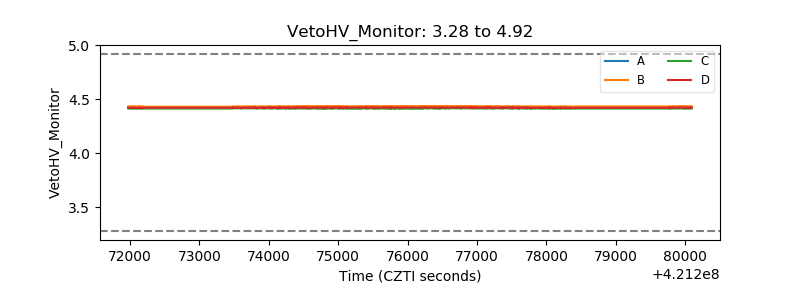 |
| Veto LLD | 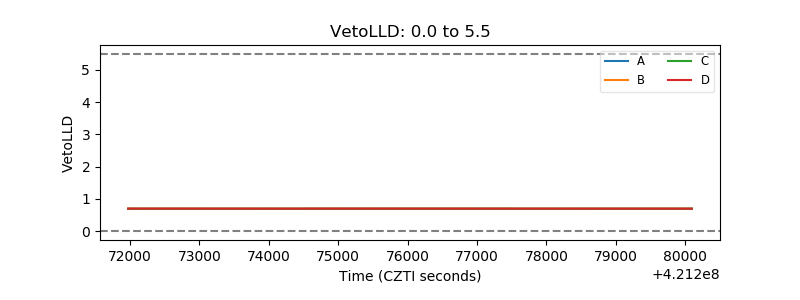 |
| Alpha Counter | 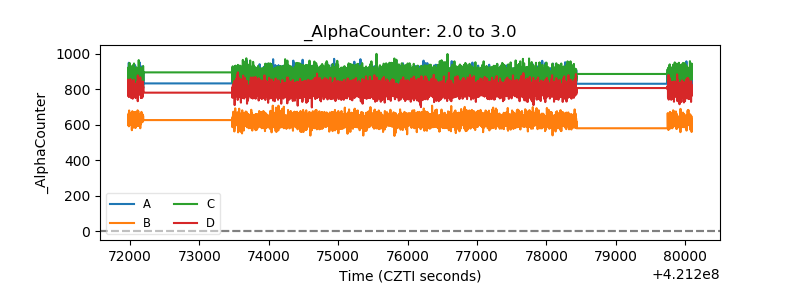 |
| _CPM_Rate | 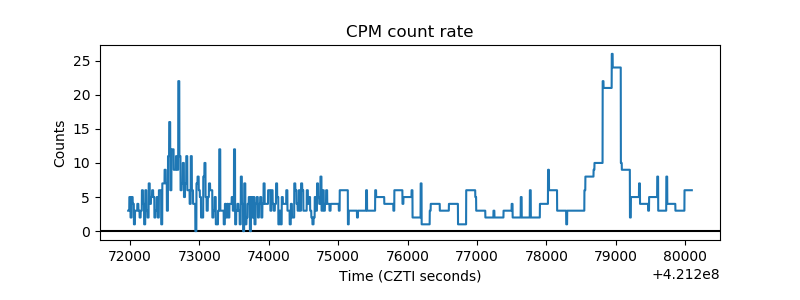 |
| CZT Counter | 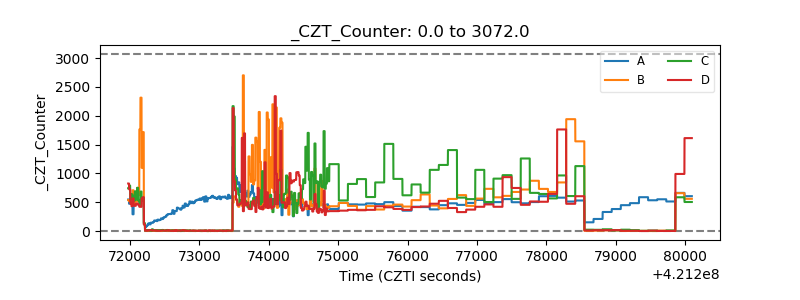 |
| +2.5 Volts monitor | 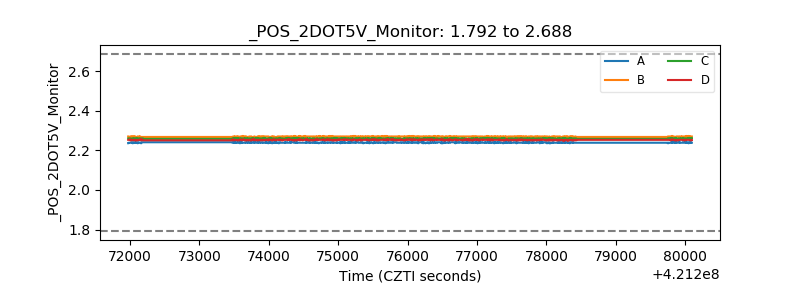 |
| +5 Volts monitor | 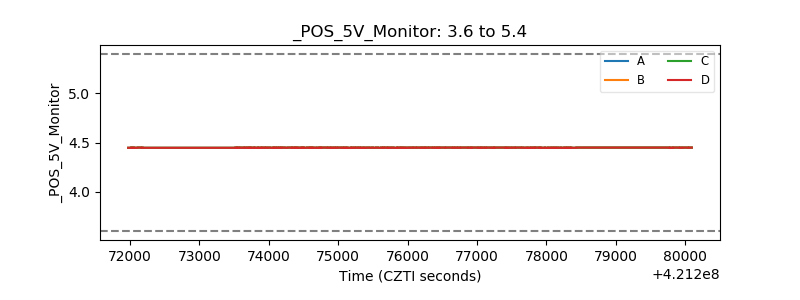 |
| _ROLL_ROT |  |
| _Roll_DEC | 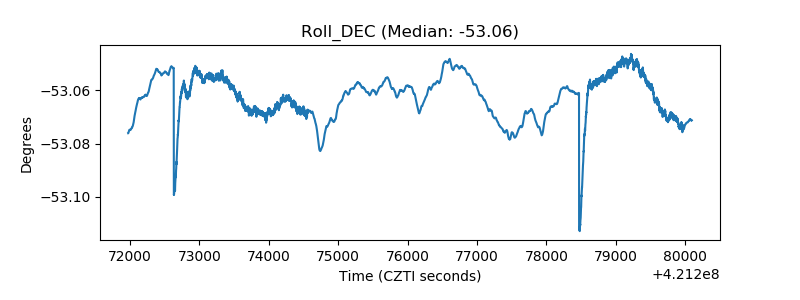 |
| _Roll_RA | 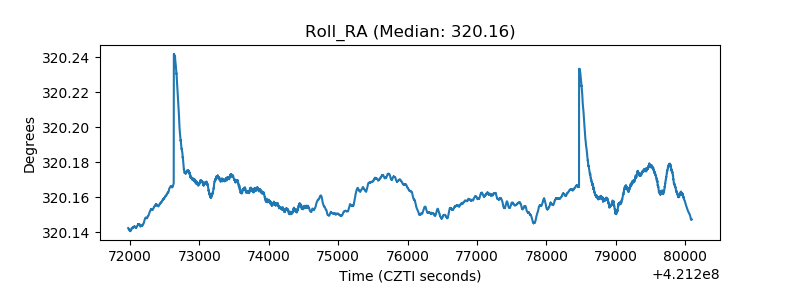 |
| Veto Counter | 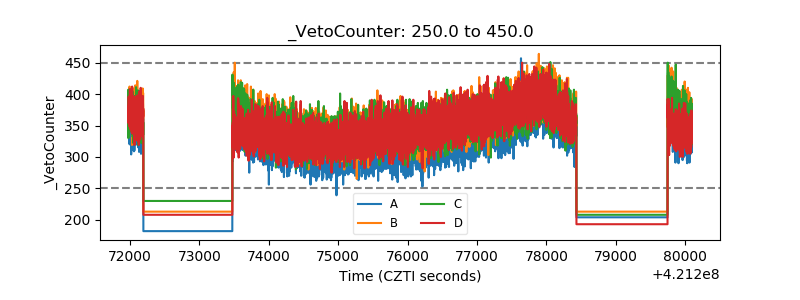 |