| Param | Original file | Final file |
|---|---|---|
| Filename | modeM0/AS1A12_025T12_9000005604_41149cztM0_level2.fits | modeM0/AS1A12_025T12_9000005604_41149cztM0_level2_quad_clean.evt |
| Size (bytes) | 116,519,040 | 34,329,600 |
| Size | 111.1 MB | 32.7 MB |
| Events in quadrant A | 1,046,890 | 226,368 |
| Events in quadrant B | 985,054 | 233,312 |
| Events in quadrant C | 1,206,591 | 219,262 |
| Events in quadrant D | 905,310 | 205,990 |
| Mode SS | |||
|---|---|---|---|
| Quadrant | BADHDUFLAG | Total packets | Discarded packets |
| A | 0 | 42 | 0 |
| B | 0 | 42 | 0 |
| C | 0 | 42 | 0 |
| D | 0 | 42 | 0 |
| Mode M0 | |||
|---|---|---|---|
| Quadrant | BADHDUFLAG | Total packets | Discarded packets |
| A | 0 | 4339 | 1 |
| B | 0 | 4339 | 0 |
| C | 0 | 4805 | 0 |
| D | 0 | 4363 | 0 |
| Quadrant | Total seconds | Saturated seconds | Saturation percentage |
|---|---|---|---|
| A | 2140 | 0 | 0.000000% |
| B | 2140 | 2 | 0.093458% |
| C | 2140 | 23 | 1.074766% |
| D | 2140 | 1 | 0.046729% |
Noise dominated data is calculated using 1-second bins in cleaned event files. If a bin has >2000 counts, and if more than 50% of those come from <1% of pixels, then it is considered to be noise-dominated and hence unusable.
| Quadrant | # 1 sec bins | Bins with >0 counts | Bins with >2000 counts | High rate bins dominated by noise | Noise dominated (total time) | Noise dominated (detector-on time) | Marked lightcurve |
|---|---|---|---|---|---|---|---|
| A | 2140 | 2140 | 0 | 0 | 0.00% | 0.00% | 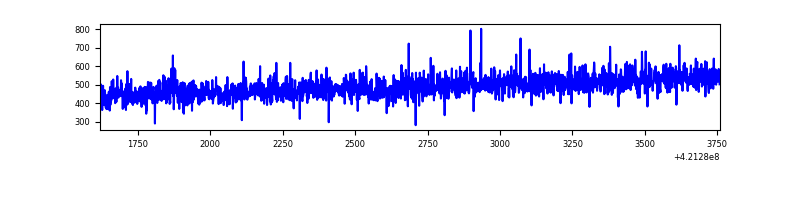 |
| B | 2140 | 2140 | 0 | 0 | 0.00% | 0.00% | 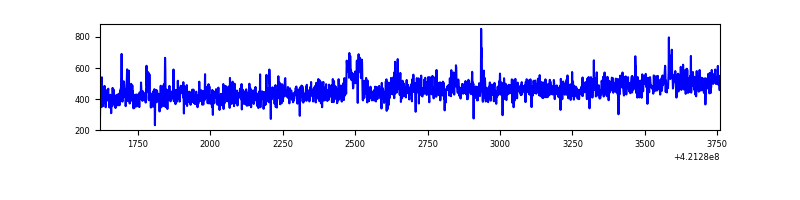 |
| C | 2140 | 2140 | 18 | 18 | 0.84% | 0.84% | 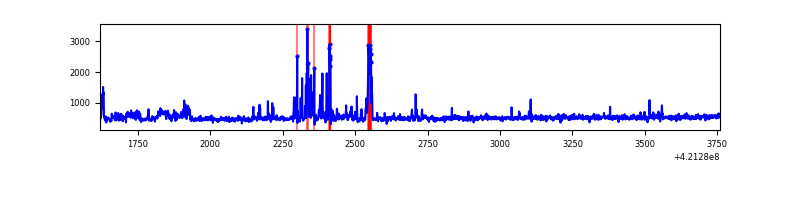 |
| D | 2140 | 2140 | 0 | 0 | 0.00% | 0.00% | 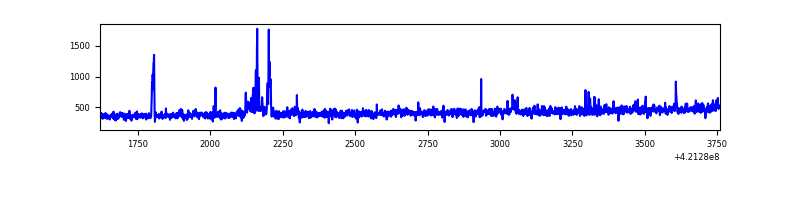 |
Top three noisy pixels from each quadrant. If the there are fewer than three noisy pixels in the level2.evt file, extra rows are filled as -1
| Pixel properties | Quadrant properties | ||||||
|---|---|---|---|---|---|---|---|
| Quadrant | DetID | PixID | Counts | Sigma | Mean | Median | Sigma |
| A | 10 | 83 | 122342 | 2433.74 | 236 | 231 | 50.2 |
| A | 12 | 189 | 9148 | 177.72 | 236 | 231 | 50.2 |
| A | 2 | 79 | 3990 | 74.92 | 236 | 231 | 50.2 |
| B | 7 | 202 | 44804 | 928.1 | 233 | 226 | 48.0 |
| B | 0 | 190 | 16138 | 331.28 | 233 | 226 | 48.0 |
| B | 12 | 111 | 6190 | 124.17 | 233 | 226 | 48.0 |
| C | 9 | 54 | 120895 | 2196.28 | 225 | 226 | 54.9 |
| C | 14 | 254 | 106064 | 1926.34 | 225 | 226 | 54.9 |
| C | 15 | 214 | 87159 | 1582.26 | 225 | 226 | 54.9 |
| D | 2 | 249 | 30594 | 535.2 | 226 | 220 | 56.8 |
| D | 2 | 234 | 9790 | 168.63 | 226 | 220 | 56.8 |
| D | 13 | 249 | 9736 | 167.68 | 226 | 220 | 56.8 |
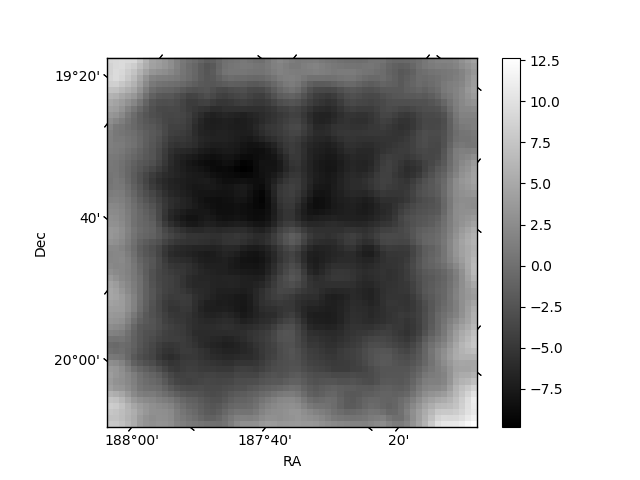
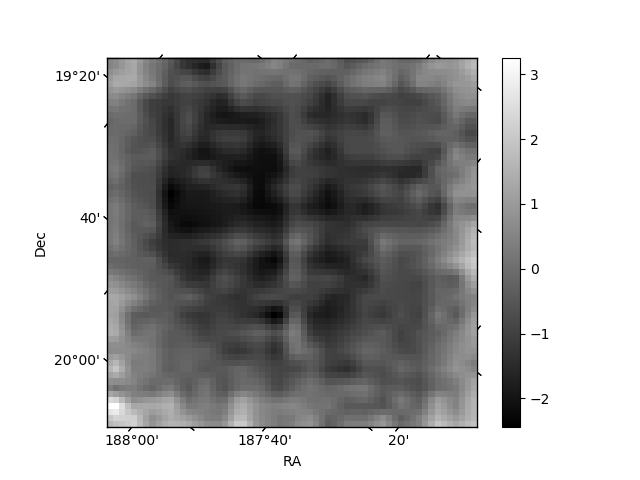
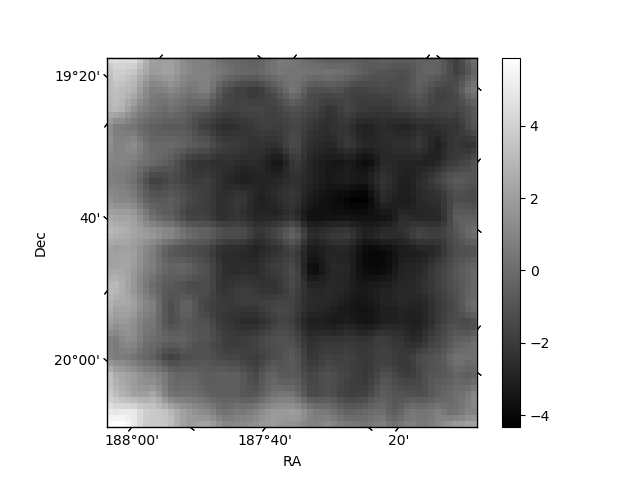
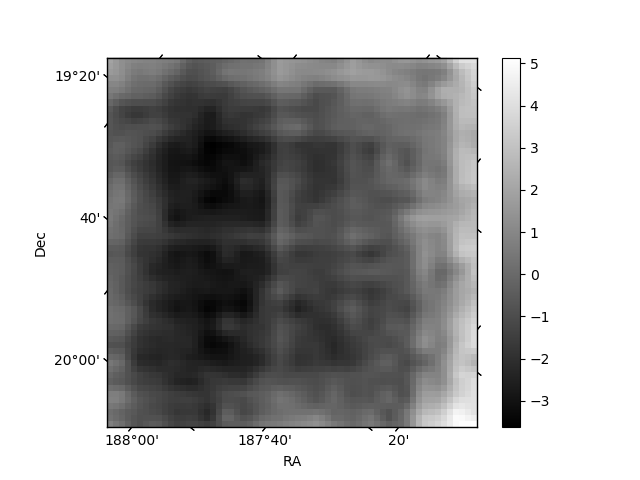
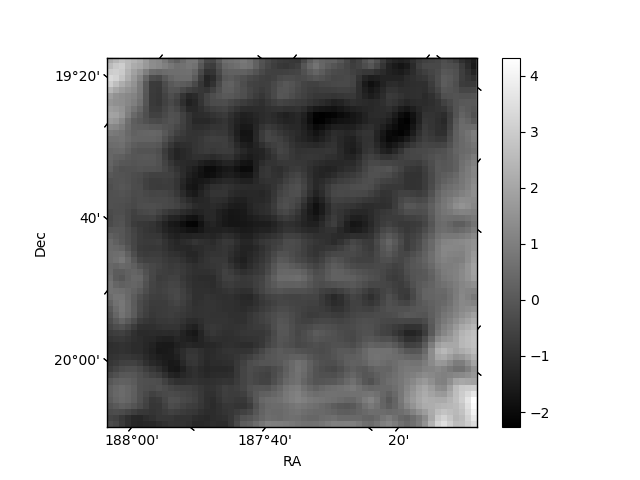
Histogram calculated using DETX and DETY for each event in the final _common_clean file
| Quadrant A | 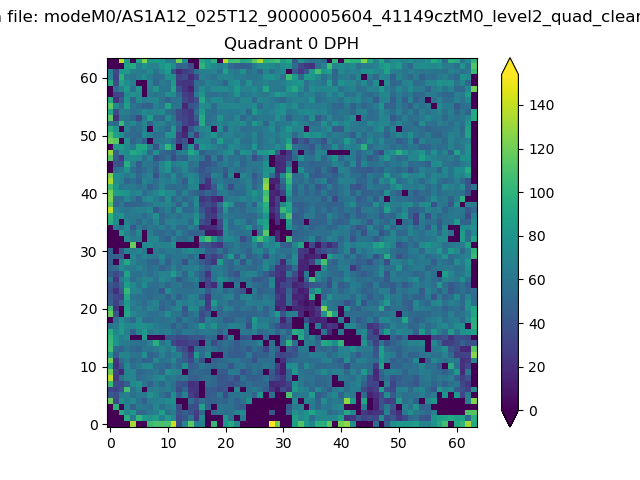 |
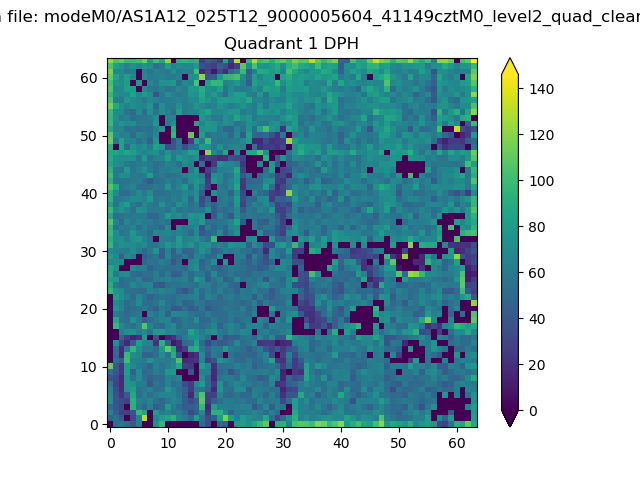 |
Quadrant B |
|---|---|---|---|
| Quadrant D | 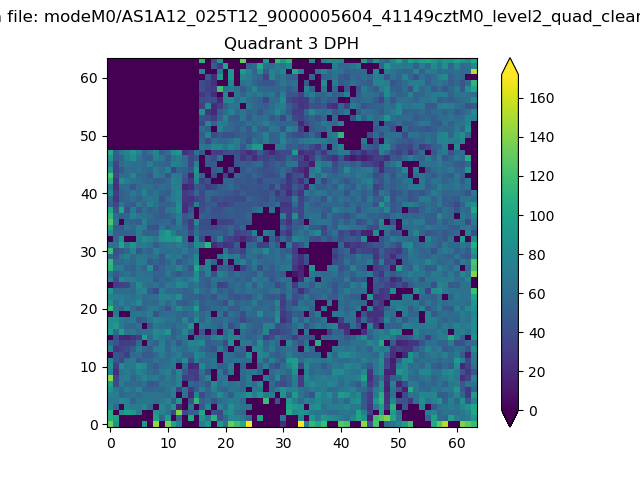 |
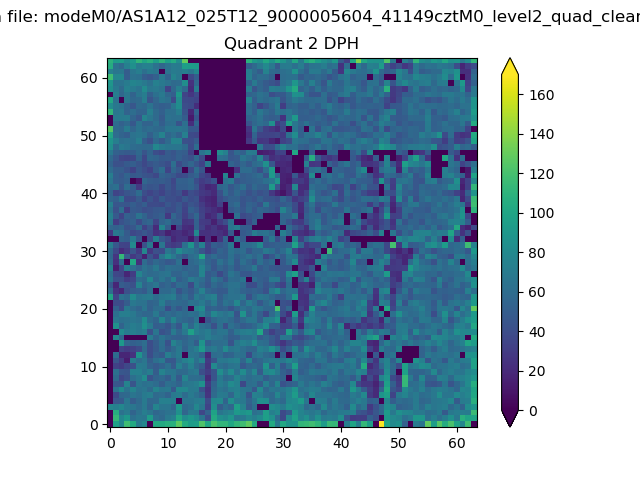 |
Quadrant C |
| Plot type | Count rate plots | Images |
|---|---|---|
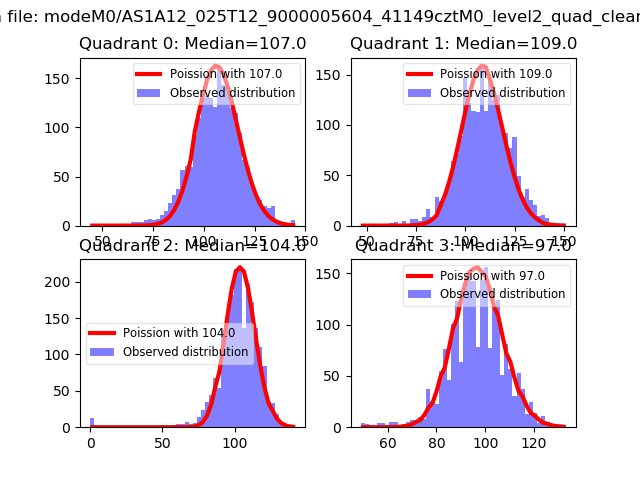
| Comparison with Poisson distribution Blue bars denote a histogram of data divided into 1 sec bins. Red curve is a Poisson curve with rate = median count rate of data. |
 |
 |
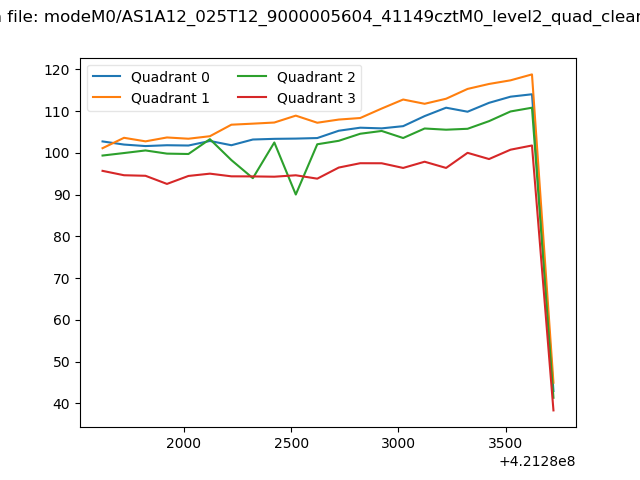
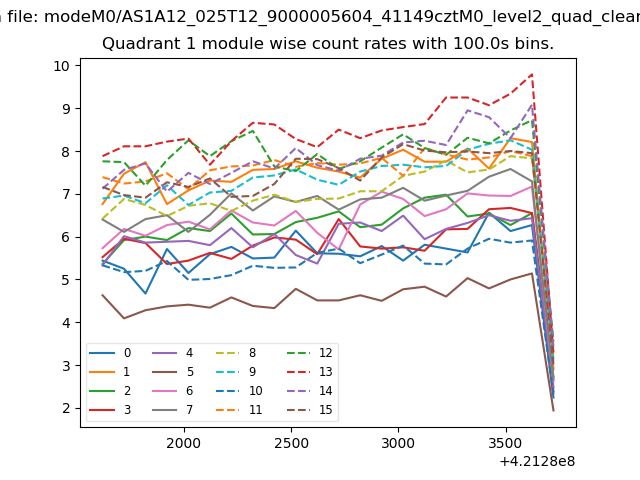
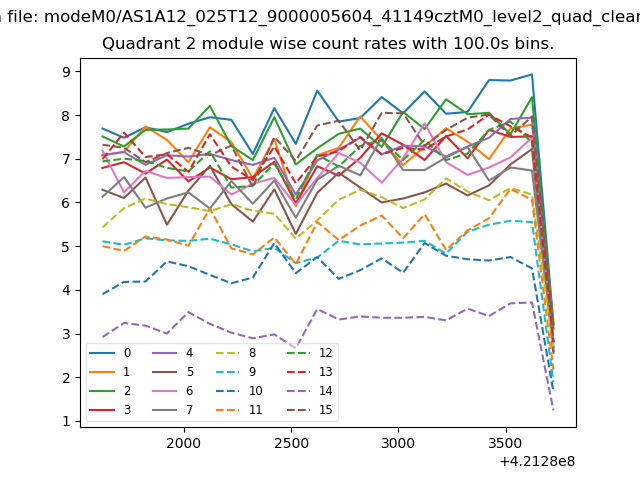
| Quadrant-wise count rates Data is divided into 100 sec bins |
 |
|
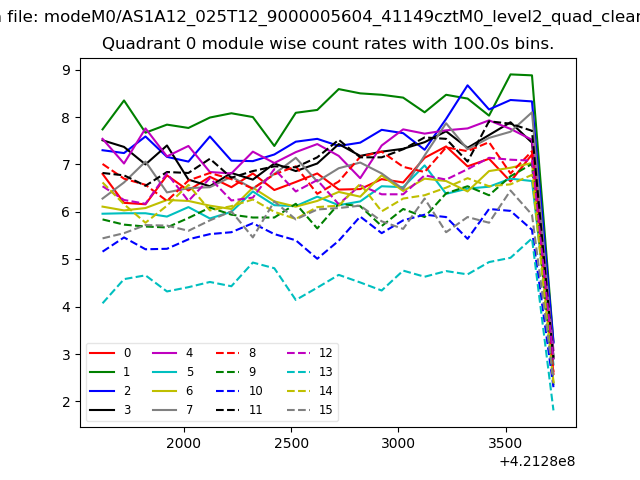
| Module-wise count rates for Quadrant A Data is divided into 100 sec bins |
 |
 |
| Module-wise count rates for Quadrant B Data is divided into 100 sec bins |
 |
 |
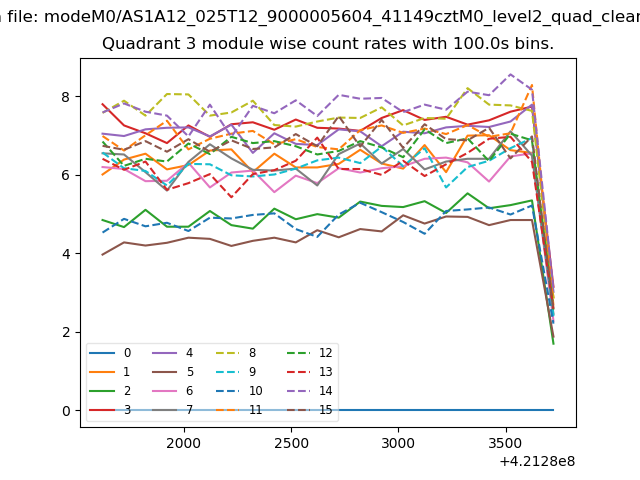
| Module-wise count rates for Quadrant C Data is divided into 100 sec bins |
 |
 |
| Module-wise count rates for Quadrant D Data is divided into 100 sec bins |
 |
 |
| Parameter | Plot |
|---|---|
| CZT HV Monitor | 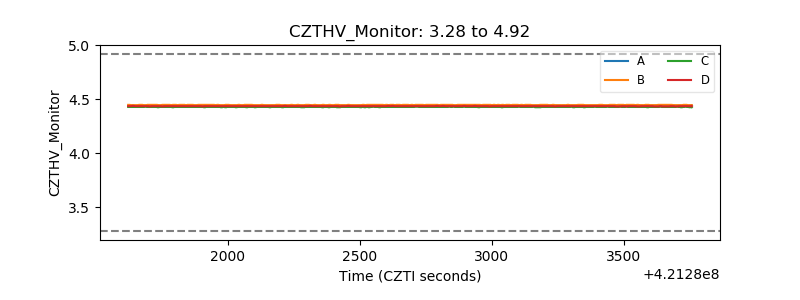 |
| D_VDD | 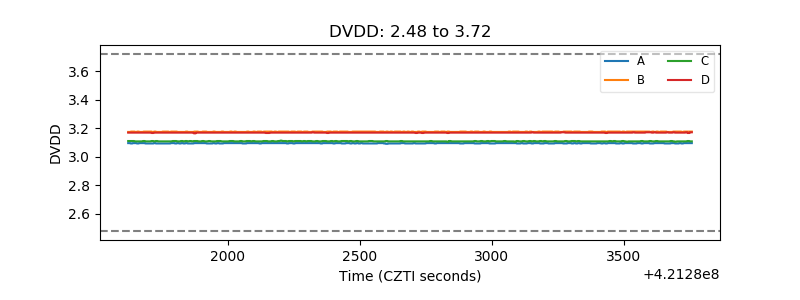 |
| Temperature 1 | 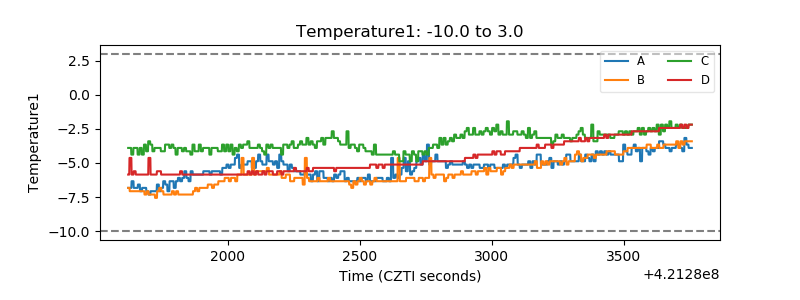 |
| Veto HV Monitor | 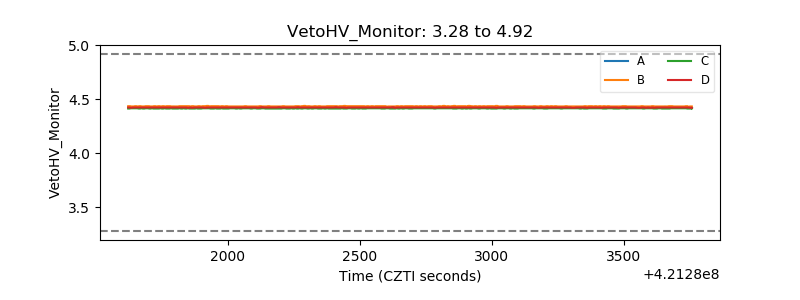 |
| Veto LLD | 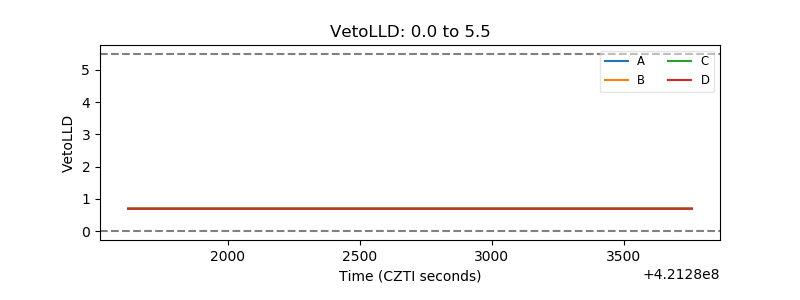 |
| Alpha Counter | 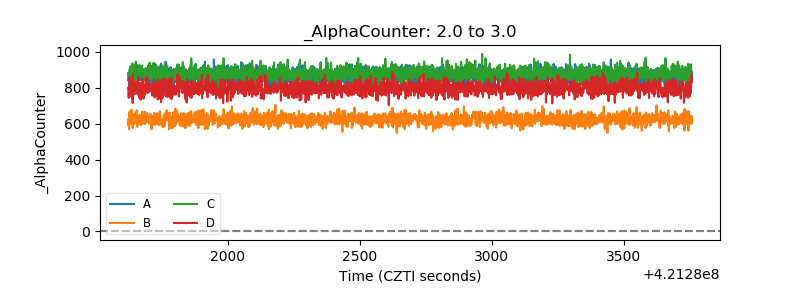 |
| _CPM_Rate | 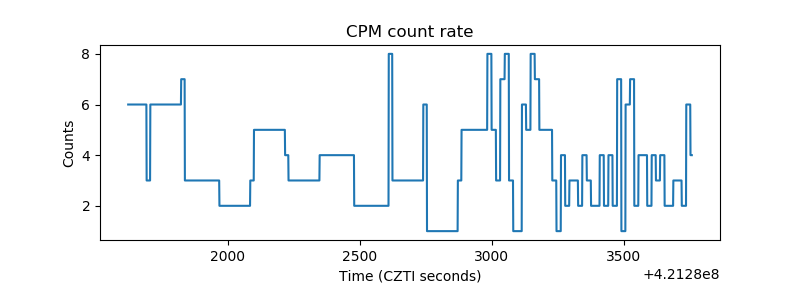 |
| CZT Counter | 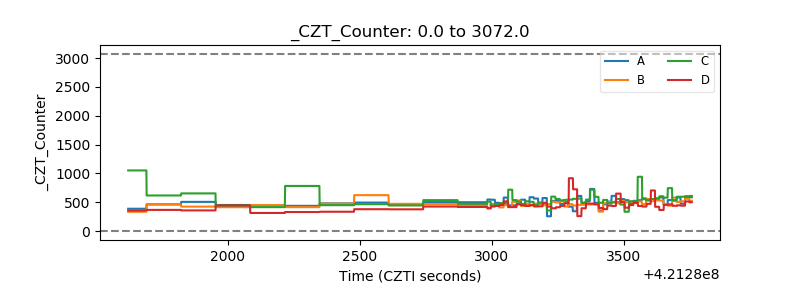 |
| +2.5 Volts monitor |  |
| +5 Volts monitor |  |
| _ROLL_ROT | 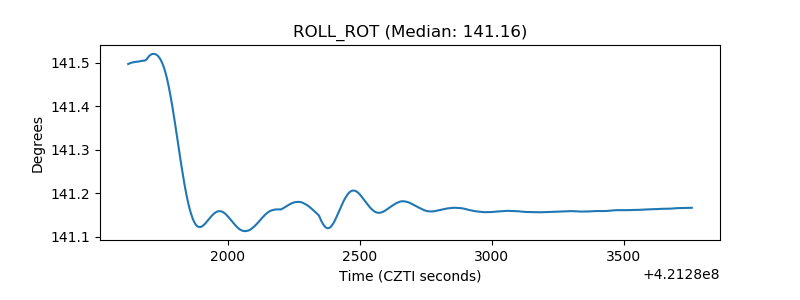 |
| _Roll_DEC | 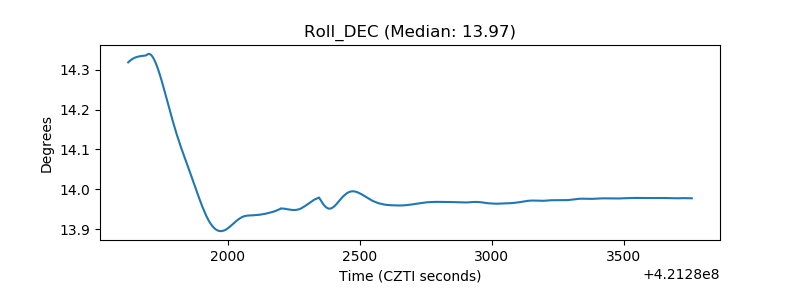 |
| _Roll_RA | 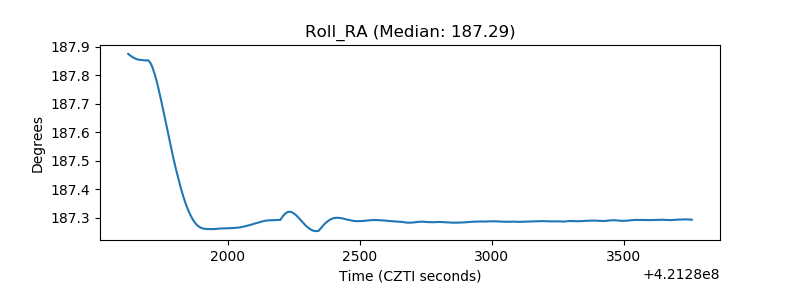 |
| Veto Counter | 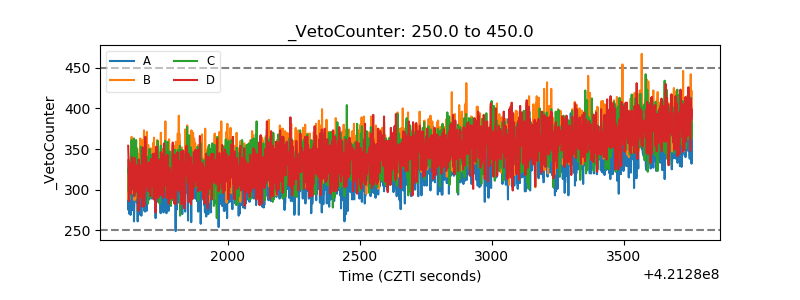 |