| Param | Original file | Final file |
|---|---|---|
| Filename | modeM0/AS1A12_025T12_9000005604_41150cztM0_level2.fits | modeM0/AS1A12_025T12_9000005604_41150cztM0_level2_quad_clean.evt |
| Size (bytes) | 437,878,080 | 119,957,760 |
| Size | 417.6 MB | 114.4 MB |
| Events in quadrant A | 3,924,012 | 803,779 |
| Events in quadrant B | 3,595,714 | 820,833 |
| Events in quadrant C | 4,400,139 | 774,608 |
| Events in quadrant D | 3,717,041 | 720,648 |
| Mode M9 | |||
|---|---|---|---|
| Quadrant | BADHDUFLAG | Total packets | Discarded packets |
| A | 0 | 29 | 0 |
| B | 0 | 29 | 0 |
| C | 0 | 29 | 0 |
| D | 0 | 29 | 0 |
| Mode SS | |||
|---|---|---|---|
| Quadrant | BADHDUFLAG | Total packets | Discarded packets |
| A | 0 | 150 | 0 |
| B | 0 | 150 | 0 |
| C | 0 | 150 | 0 |
| D | 0 | 150 | 0 |
| Mode M0 | |||
|---|---|---|---|
| Quadrant | BADHDUFLAG | Total packets | Discarded packets |
| A | 0 | 16080 | 4 |
| B | 0 | 15494 | 2 |
| C | 0 | 17500 | 2 |
| D | 0 | 16386 | 2 |
| Quadrant | Total seconds | Saturated seconds | Saturation percentage |
|---|---|---|---|
| A | 7358 | 14 | 0.190269% |
| B | 7358 | 38 | 0.516445% |
| C | 7358 | 63 | 0.856211% |
| D | 7358 | 82 | 1.114433% |
Noise dominated data is calculated using 1-second bins in cleaned event files. If a bin has >2000 counts, and if more than 50% of those come from <1% of pixels, then it is considered to be noise-dominated and hence unusable.
| Quadrant | # 1 sec bins | Bins with >0 counts | Bins with >2000 counts | High rate bins dominated by noise | Noise dominated (total time) | Noise dominated (detector-on time) | Marked lightcurve |
|---|---|---|---|---|---|---|---|
| A | 10284 | 7361 | 7 | 7 | 0.07% | 0.10% | 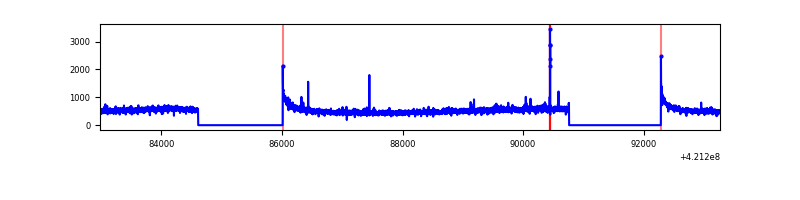 |
| B | 10284 | 7361 | 29 | 29 | 0.28% | 0.39% | 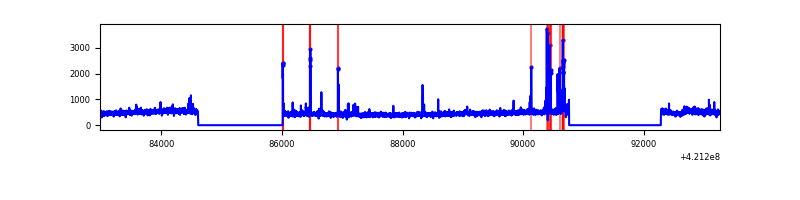 |
| C | 10284 | 7361 | 52 | 52 | 0.51% | 0.71% | 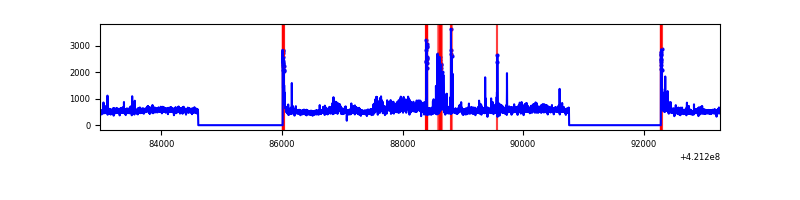 |
| D | 10284 | 7361 | 67 | 67 | 0.65% | 0.91% | 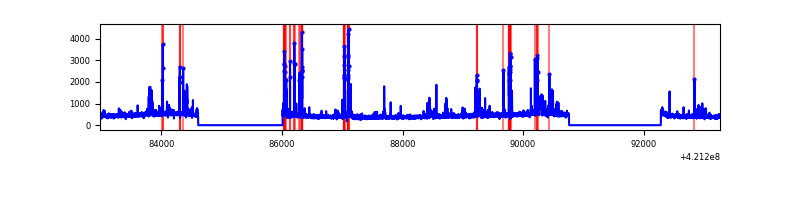 |
Top three noisy pixels from each quadrant. If the there are fewer than three noisy pixels in the level2.evt file, extra rows are filled as -1
| Pixel properties | Quadrant properties | ||||||
|---|---|---|---|---|---|---|---|
| Quadrant | DetID | PixID | Counts | Sigma | Mean | Median | Sigma |
| A | 10 | 83 | 624547 | 3647.52 | 833 | 815 | 171.0 |
| A | 2 | 79 | 47111 | 270.73 | 833 | 815 | 171.0 |
| A | 12 | 189 | 27041 | 153.37 | 833 | 815 | 171.0 |
| B | 7 | 202 | 148772 | 910.24 | 822 | 799 | 162.6 |
| B | 0 | 245 | 126155 | 771.11 | 822 | 799 | 162.6 |
| B | 5 | 255 | 58640 | 355.8 | 822 | 799 | 162.6 |
| C | 9 | 54 | 682582 | 3596.4 | 806 | 810 | 189.6 |
| C | 15 | 214 | 310943 | 1635.98 | 806 | 810 | 189.6 |
| C | 14 | 254 | 169397 | 889.31 | 806 | 810 | 189.6 |
| D | 13 | 249 | 196848 | 981.56 | 808 | 784 | 199.7 |
| D | 2 | 249 | 192652 | 960.55 | 808 | 784 | 199.7 |
| D | 5 | 32 | 74025 | 366.67 | 808 | 784 | 199.7 |
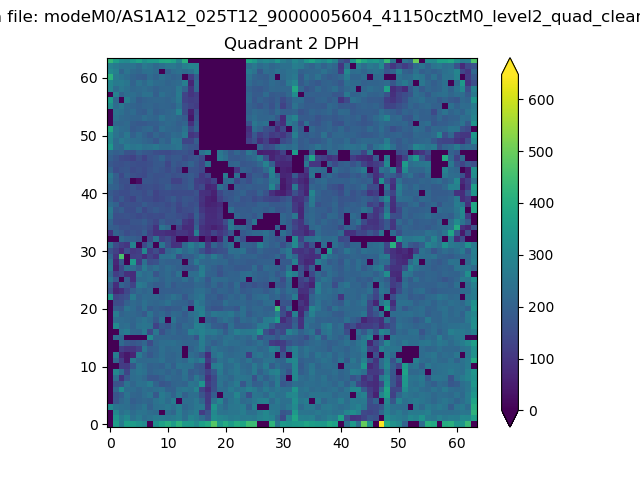
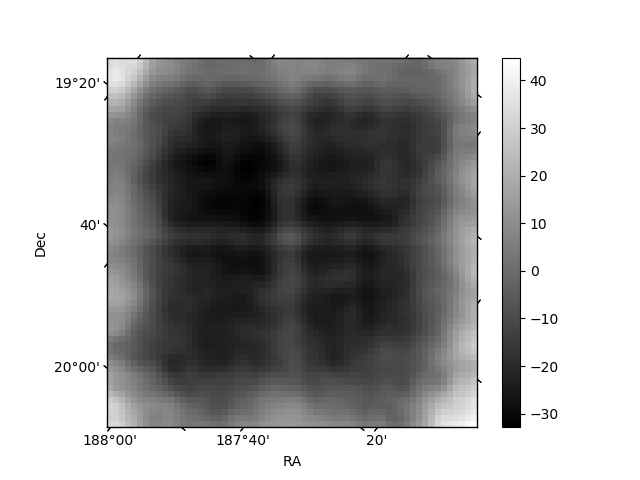
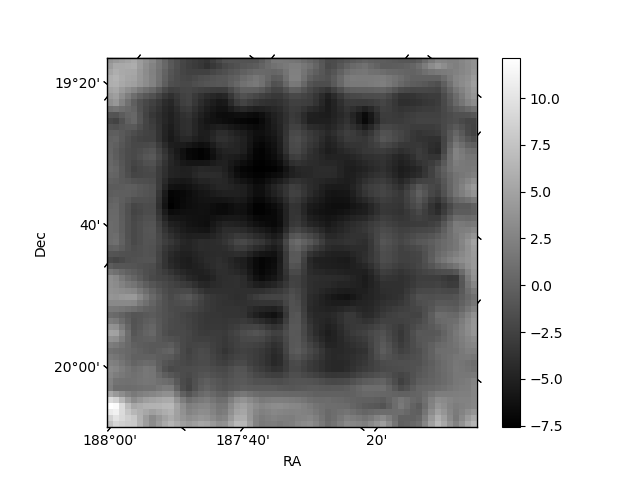
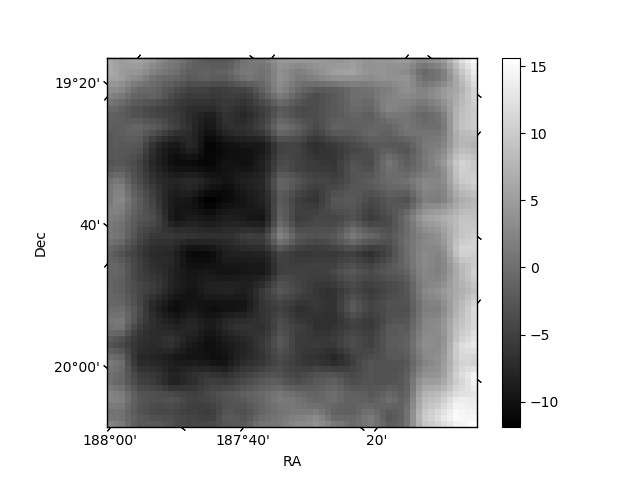
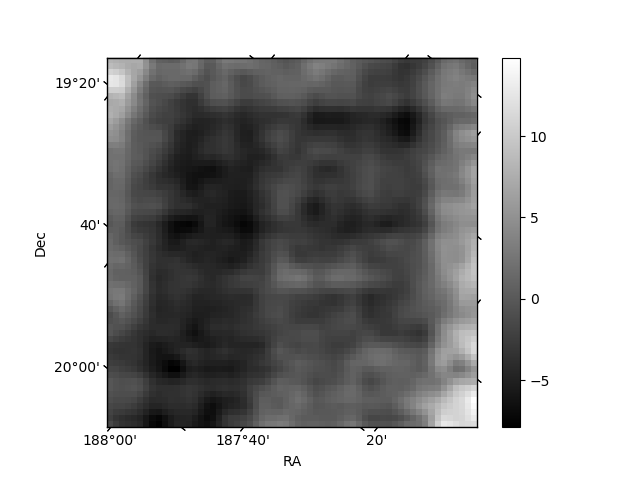
Histogram calculated using DETX and DETY for each event in the final _common_clean file
| Quadrant A | 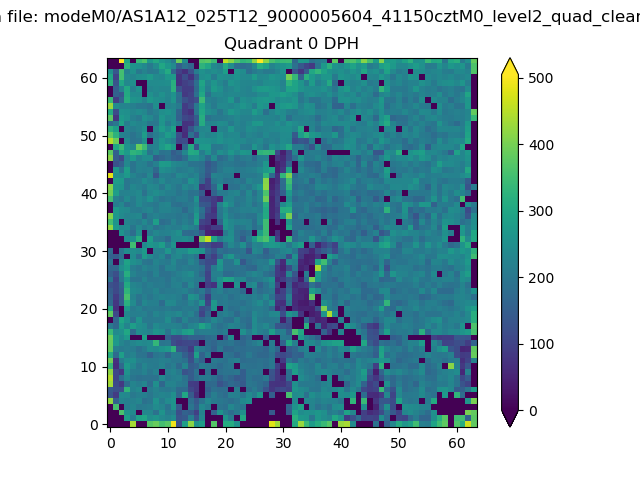 |
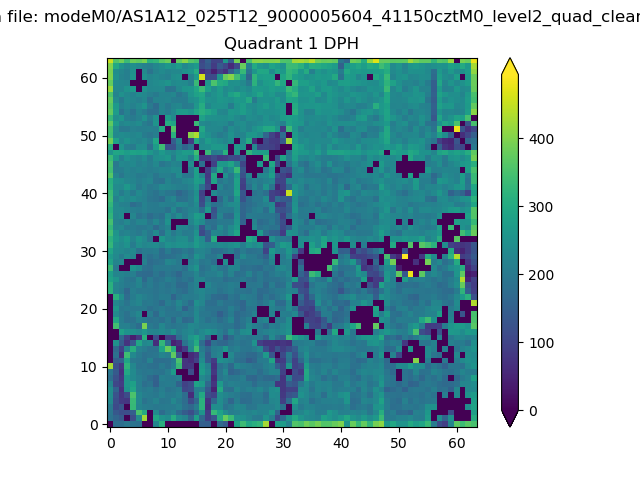 |
Quadrant B |
|---|---|---|---|
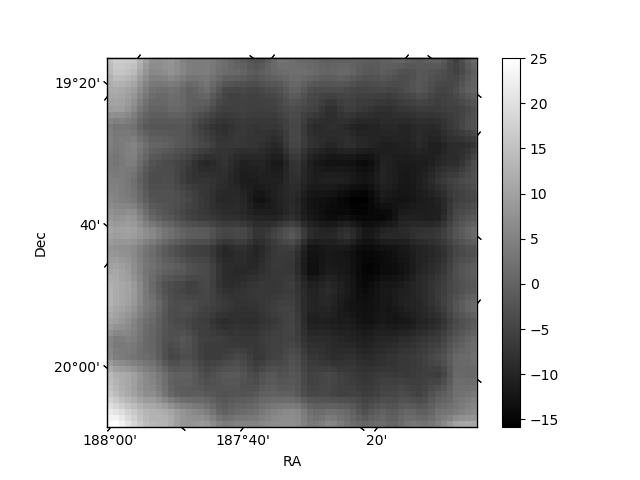
| Quadrant D | 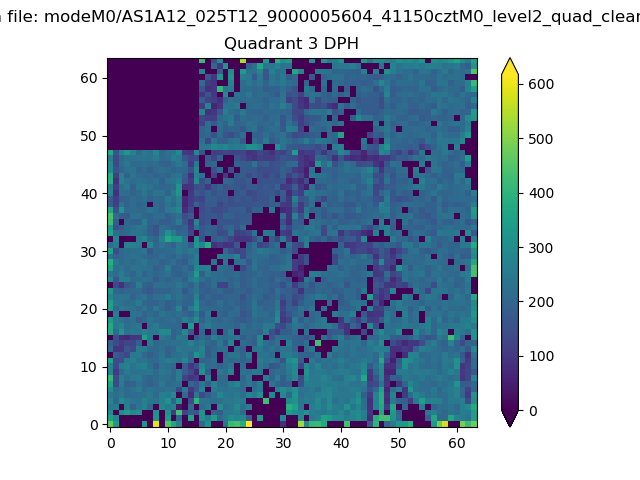 |
 |
Quadrant C |
| Plot type | Count rate plots | Images |
|---|---|---|
| Comparison with Poisson distribution Blue bars denote a histogram of data divided into 1 sec bins. Red curve is a Poisson curve with rate = median count rate of data. |
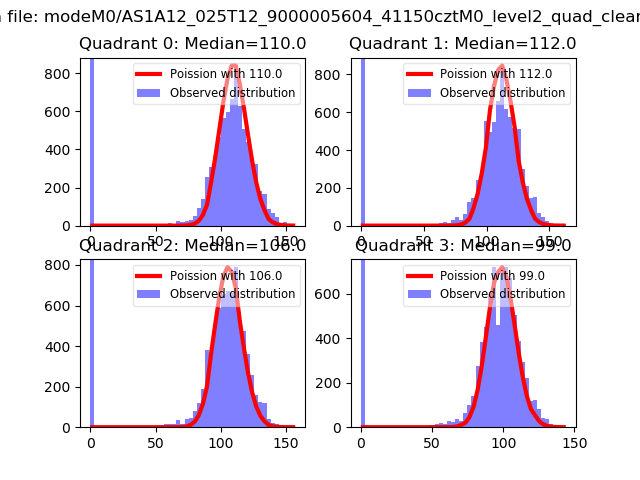 |
 |
| Quadrant-wise count rates Data is divided into 100 sec bins |
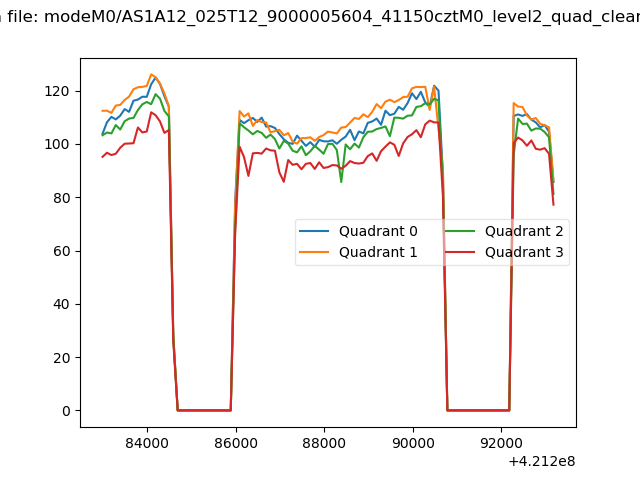 |
|
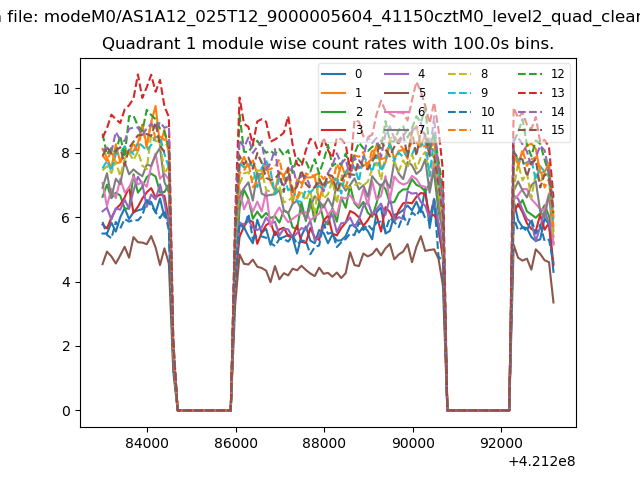
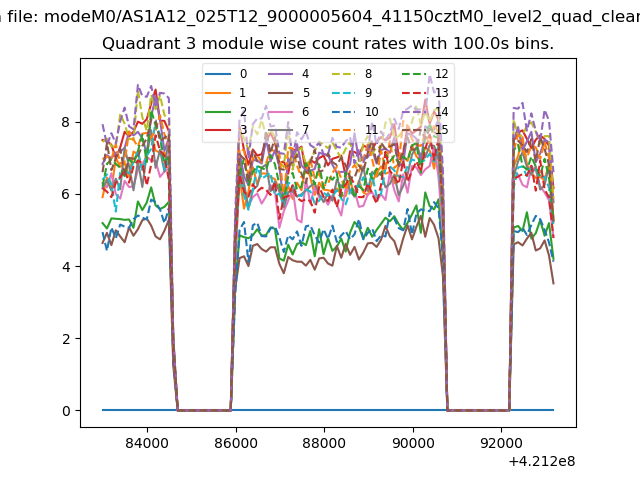
| Module-wise count rates for Quadrant A Data is divided into 100 sec bins |
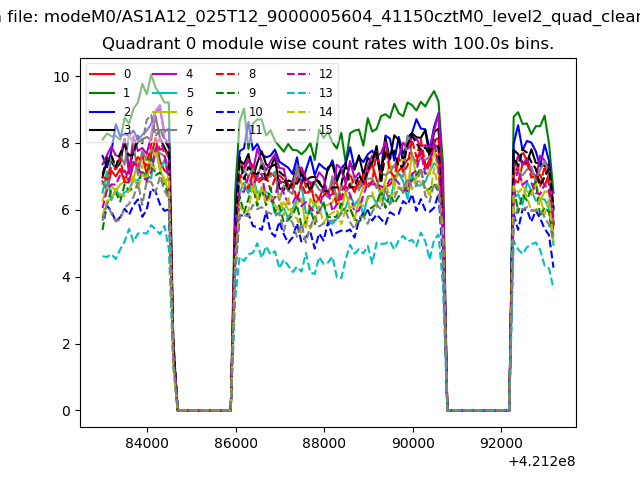 |
 |
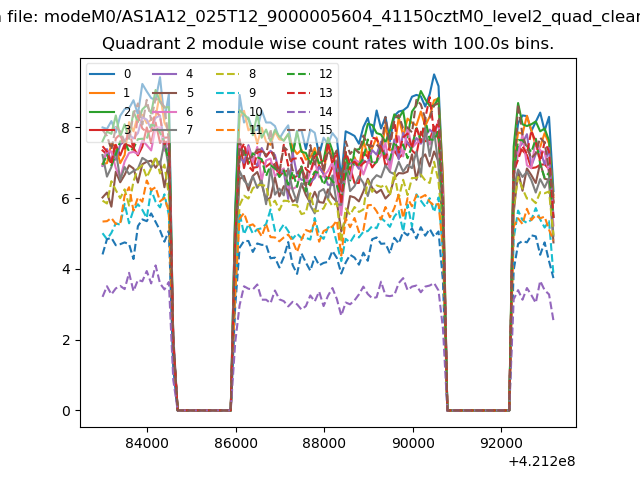
| Module-wise count rates for Quadrant B Data is divided into 100 sec bins |
 |
 |
| Module-wise count rates for Quadrant C Data is divided into 100 sec bins |
 |
 |
| Module-wise count rates for Quadrant D Data is divided into 100 sec bins |
 |
 |
| Parameter | Plot |
|---|---|
| CZT HV Monitor | 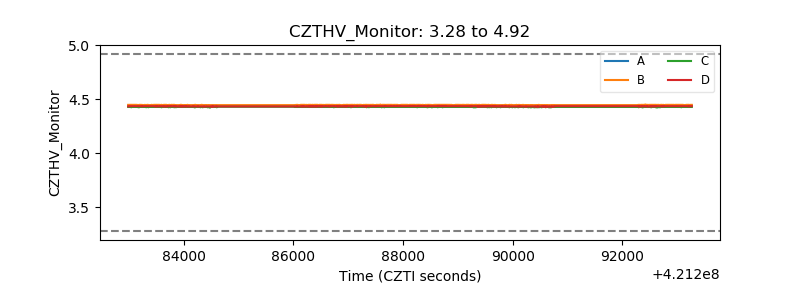 |
| D_VDD | 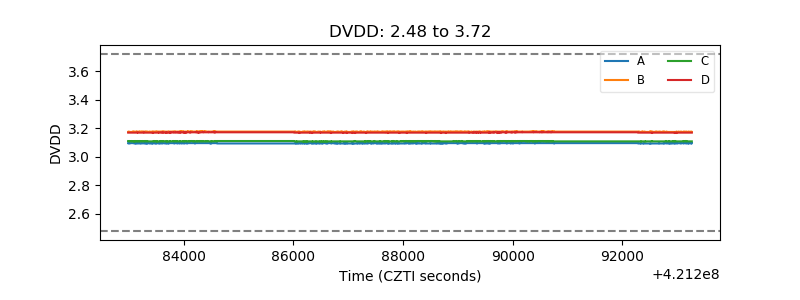 |
| Temperature 1 |  |
| Veto HV Monitor | 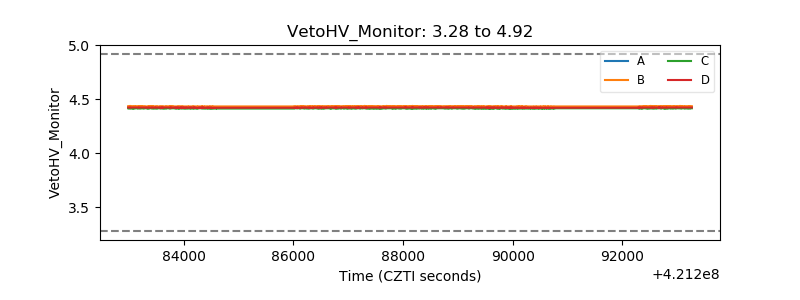 |
| Veto LLD | 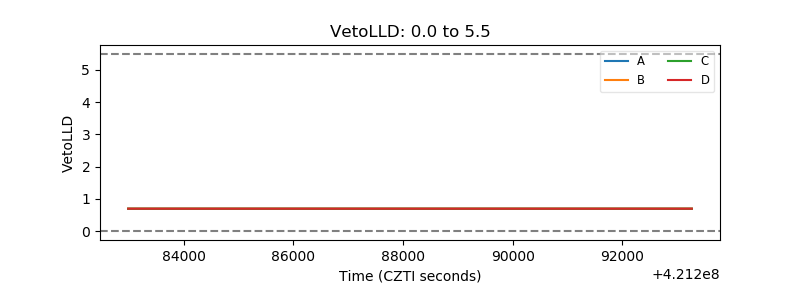 |
| Alpha Counter | 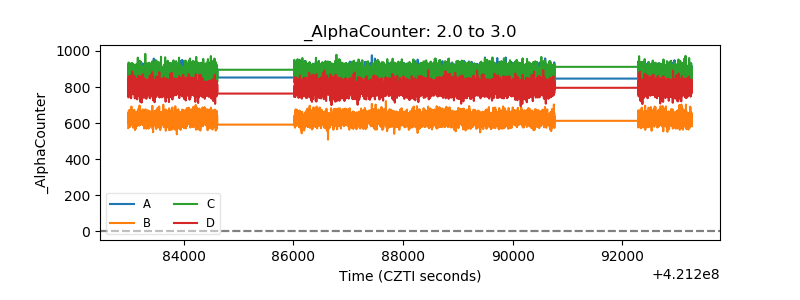 |
| _CPM_Rate | 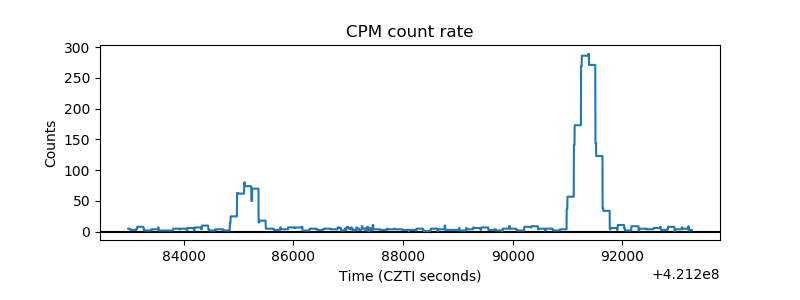 |
| CZT Counter | 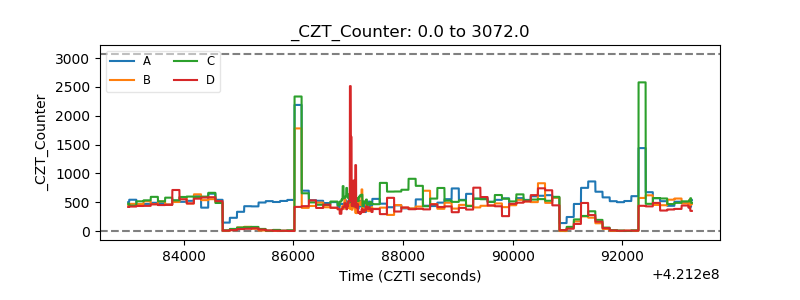 |
| +2.5 Volts monitor | 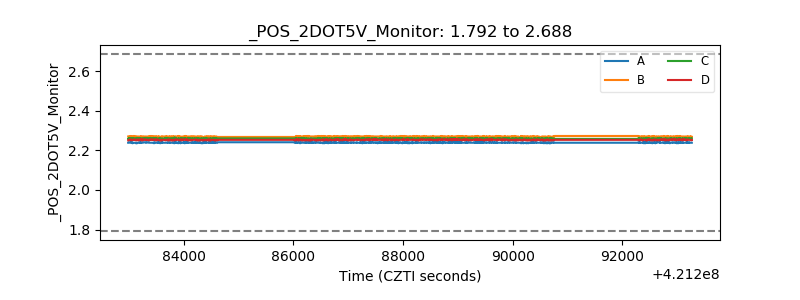 |
| +5 Volts monitor | 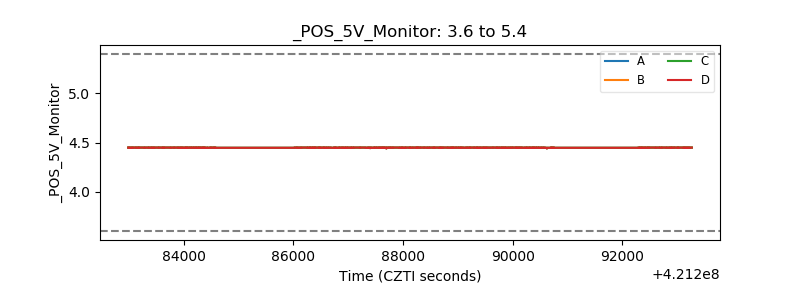 |
| _ROLL_ROT | 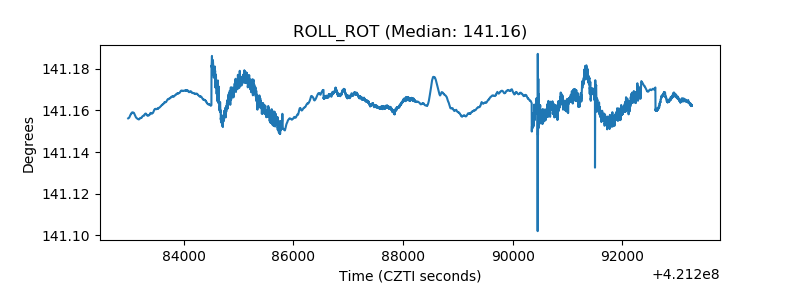 |
| _Roll_DEC | 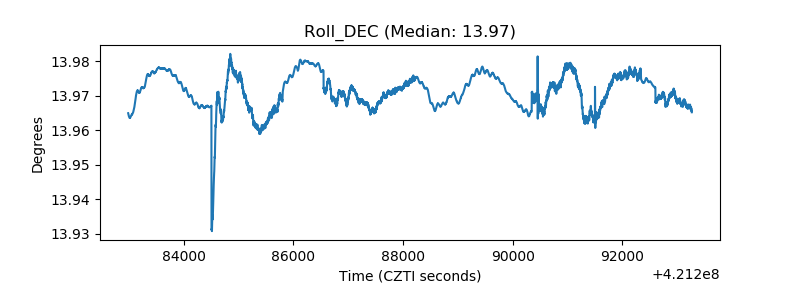 |
| _Roll_RA | 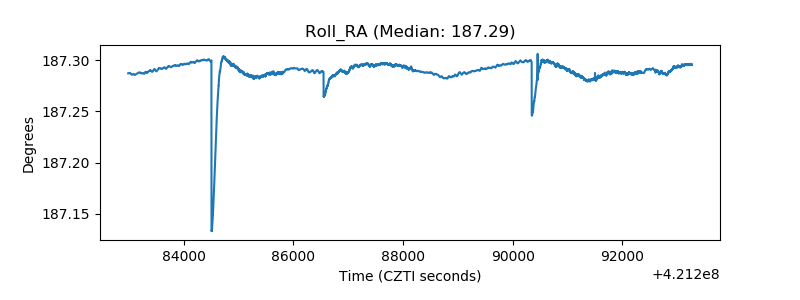 |
| Veto Counter | 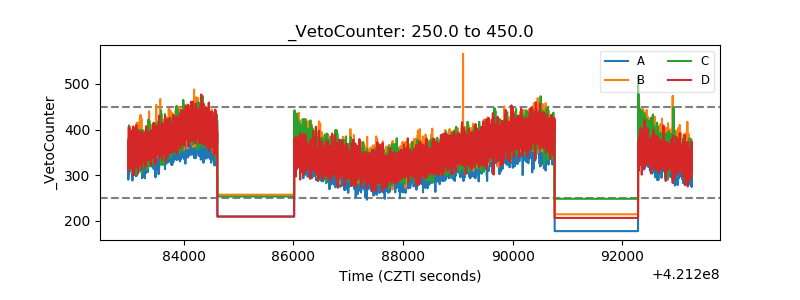 |