| Param | Original file | Final file |
|---|---|---|
| Filename | modeM0/AS1A12_025T12_9000005604_41151cztM0_level2.fits | modeM0/AS1A12_025T12_9000005604_41151cztM0_level2_quad_clean.evt |
| Size (bytes) | 374,336,640 | 89,487,360 |
| Size | 357.0 MB | 85.3 MB |
| Events in quadrant A | 2,977,978 | 614,149 |
| Events in quadrant B | 4,460,125 | 557,335 |
| Events in quadrant C | 3,348,602 | 591,404 |
| Events in quadrant D | 2,633,183 | 554,366 |
| Mode M9 | |||
|---|---|---|---|
| Quadrant | BADHDUFLAG | Total packets | Discarded packets |
| A | 0 | 32 | 0 |
| B | 0 | 32 | 0 |
| C | 0 | 32 | 0 |
| D | 0 | 32 | 0 |
| Mode SS | |||
|---|---|---|---|
| Quadrant | BADHDUFLAG | Total packets | Discarded packets |
| A | 0 | 116 | 0 |
| B | 0 | 116 | 0 |
| C | 0 | 116 | 0 |
| D | 0 | 116 | 0 |
| Mode M0 | |||
|---|---|---|---|
| Quadrant | BADHDUFLAG | Total packets | Discarded packets |
| A | 0 | 12089 | 3 |
| B | 0 | 16754 | 2 |
| C | 0 | 13245 | 2 |
| D | 0 | 11908 | 2 |
| Quadrant | Total seconds | Saturated seconds | Saturation percentage |
|---|---|---|---|
| A | 5610 | 10 | 0.178253% |
| B | 5610 | 651 | 11.604278% |
| C | 5610 | 79 | 1.408200% |
| D | 5610 | 14 | 0.249554% |
Noise dominated data is calculated using 1-second bins in cleaned event files. If a bin has >2000 counts, and if more than 50% of those come from <1% of pixels, then it is considered to be noise-dominated and hence unusable.
| Quadrant | # 1 sec bins | Bins with >0 counts | Bins with >2000 counts | High rate bins dominated by noise | Noise dominated (total time) | Noise dominated (detector-on time) | Marked lightcurve |
|---|---|---|---|---|---|---|---|
| A | 8807 | 5612 | 3 | 3 | 0.03% | 0.05% | 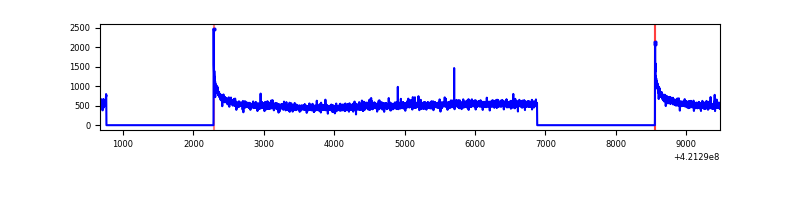 |
| B | 8807 | 5612 | 545 | 545 | 6.19% | 9.71% | 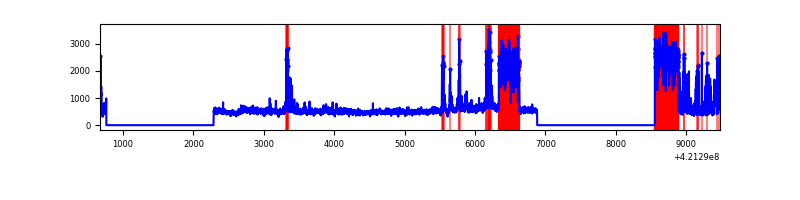 |
| C | 8807 | 5612 | 65 | 65 | 0.74% | 1.16% | 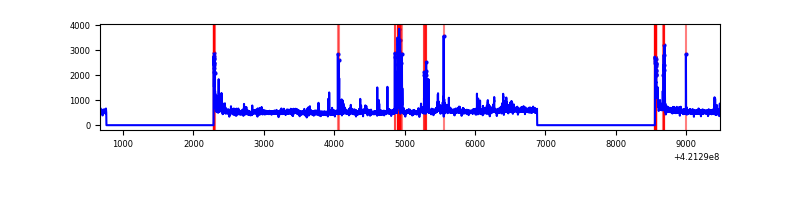 |
| D | 8807 | 5612 | 9 | 9 | 0.10% | 0.16% | 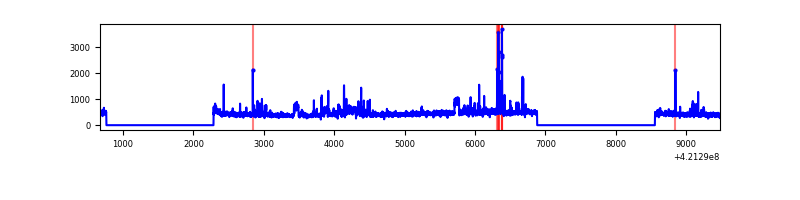 |
Top three noisy pixels from each quadrant. If the there are fewer than three noisy pixels in the level2.evt file, extra rows are filled as -1
| Pixel properties | Quadrant properties | ||||||
|---|---|---|---|---|---|---|---|
| Quadrant | DetID | PixID | Counts | Sigma | Mean | Median | Sigma |
| A | 10 | 83 | 518766 | 4026.32 | 623 | 609 | 128.7 |
| A | 12 | 189 | 22281 | 168.4 | 623 | 609 | 128.7 |
| A | 2 | 79 | 13918 | 103.42 | 623 | 609 | 128.7 |
| B | 7 | 202 | 1804876 | 15663.32 | 588 | 570 | 115.2 |
| B | 0 | 245 | 166352 | 1439.16 | 588 | 570 | 115.2 |
| B | 5 | 255 | 165155 | 1428.77 | 588 | 570 | 115.2 |
| C | 9 | 54 | 469429 | 3317.07 | 603 | 607 | 141.3 |
| C | 15 | 214 | 240826 | 1699.63 | 603 | 607 | 141.3 |
| C | 14 | 254 | 140584 | 990.38 | 603 | 607 | 141.3 |
| D | 2 | 249 | 122233 | 822.36 | 603 | 587 | 147.9 |
| D | 2 | 16 | 100985 | 678.72 | 603 | 587 | 147.9 |
| D | 5 | 32 | 37786 | 251.47 | 603 | 587 | 147.9 |
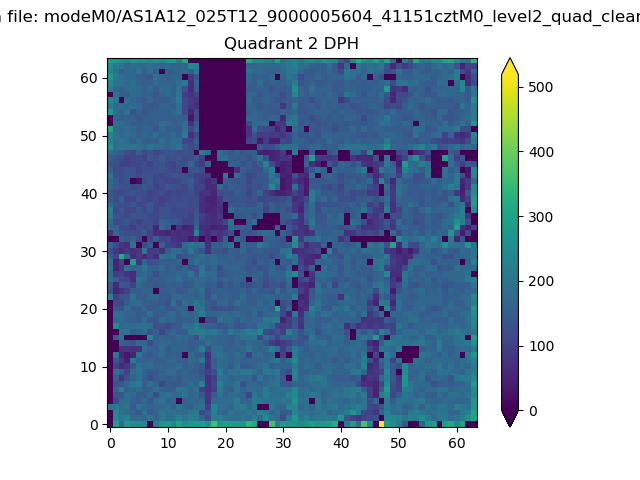
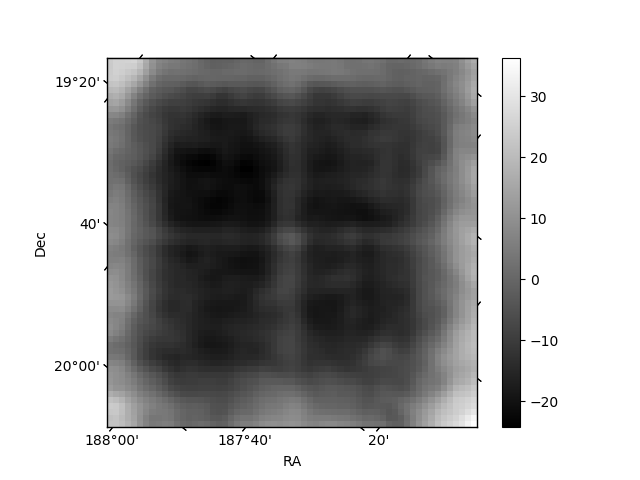
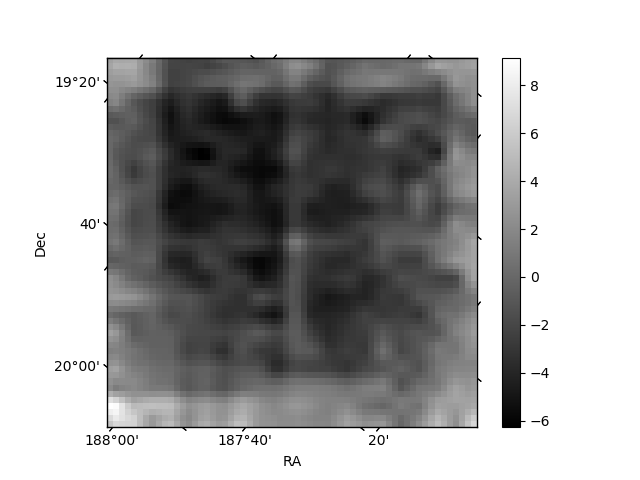
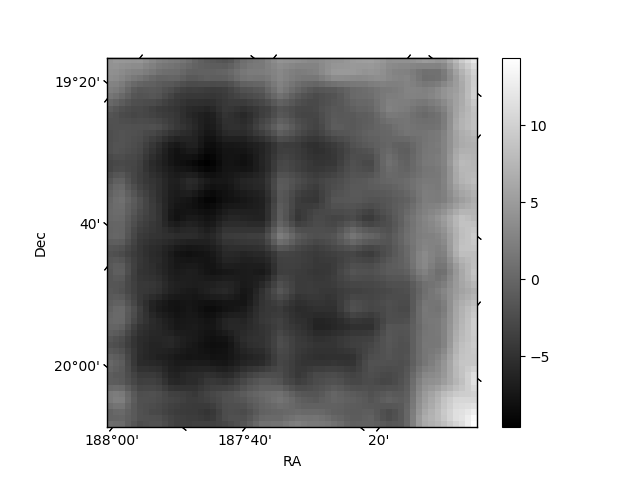
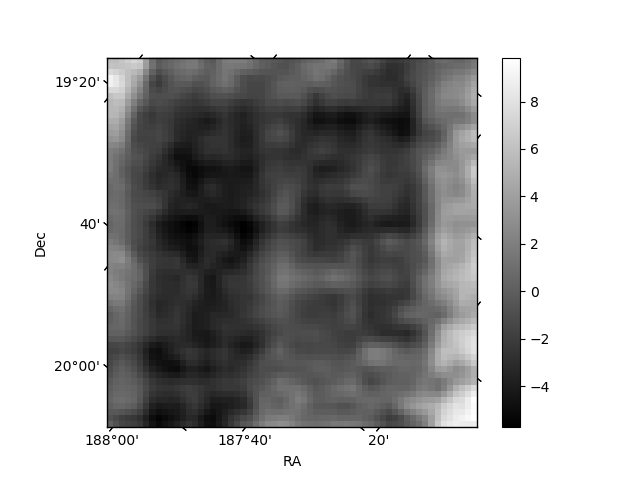
Histogram calculated using DETX and DETY for each event in the final _common_clean file
| Quadrant A | 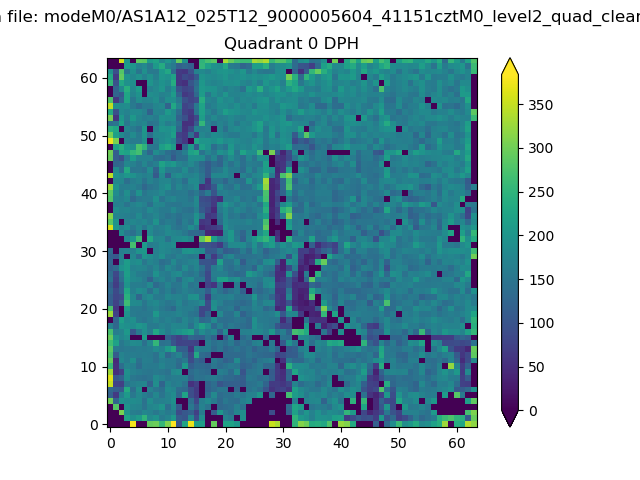 |
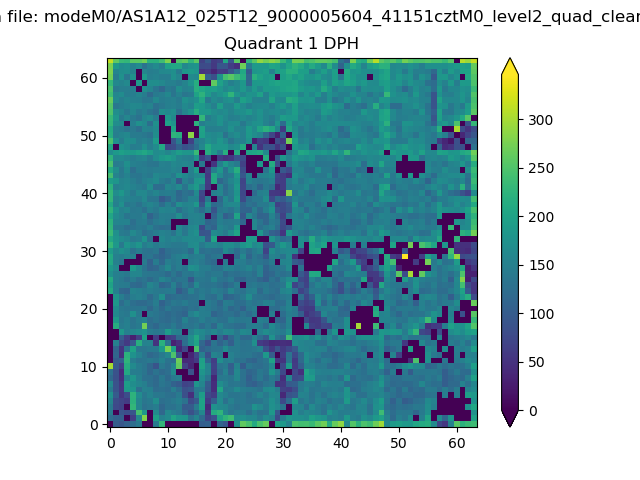 |
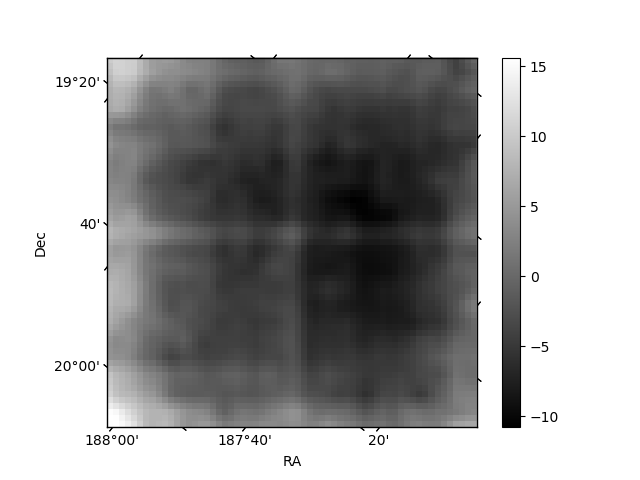
Quadrant B |
|---|---|---|---|
| Quadrant D | 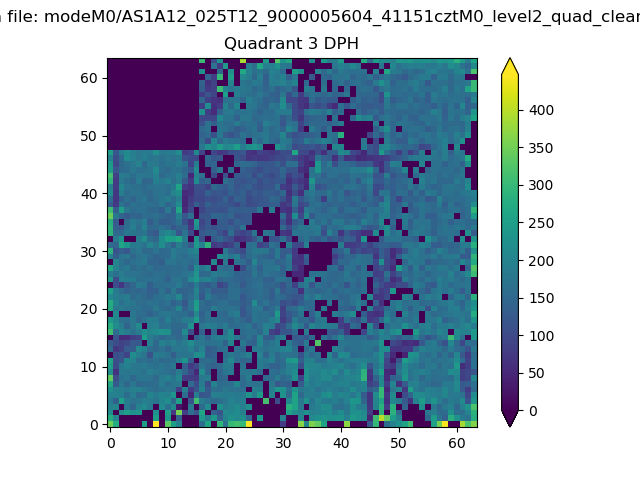 |
 |
Quadrant C |
| Plot type | Count rate plots | Images |
|---|---|---|
| Comparison with Poisson distribution Blue bars denote a histogram of data divided into 1 sec bins. Red curve is a Poisson curve with rate = median count rate of data. |
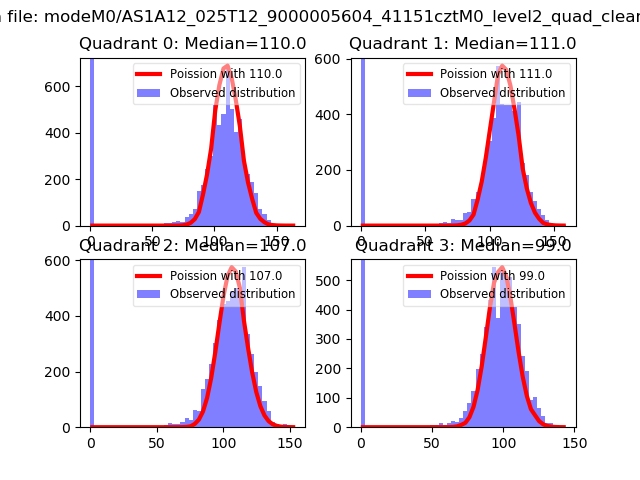 |
 |
| Quadrant-wise count rates Data is divided into 100 sec bins |
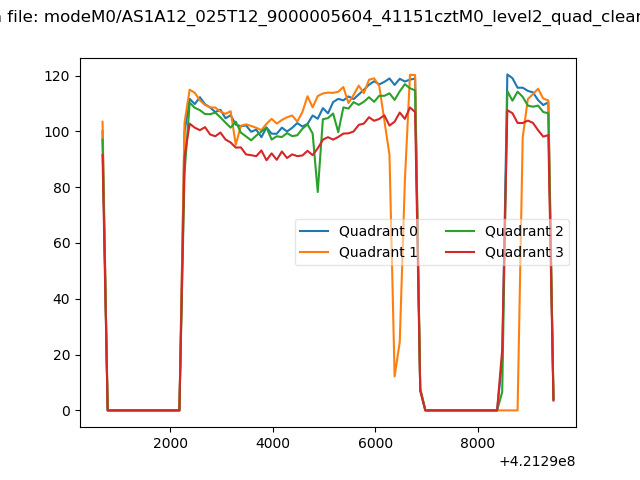 |
|
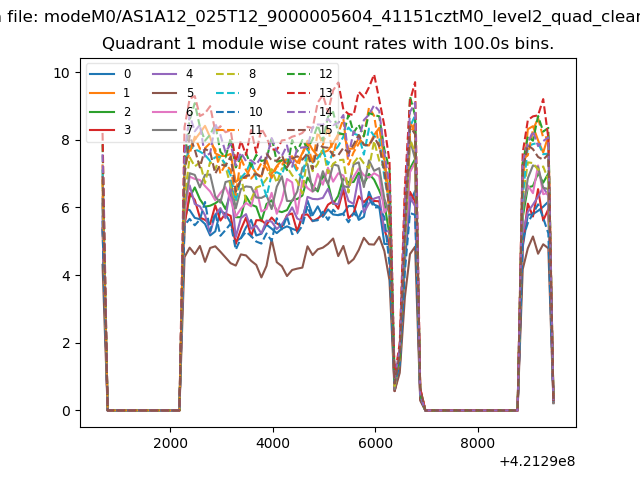
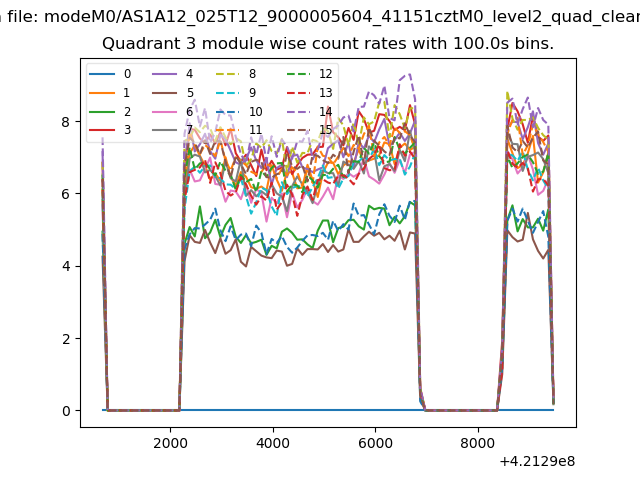
| Module-wise count rates for Quadrant A Data is divided into 100 sec bins |
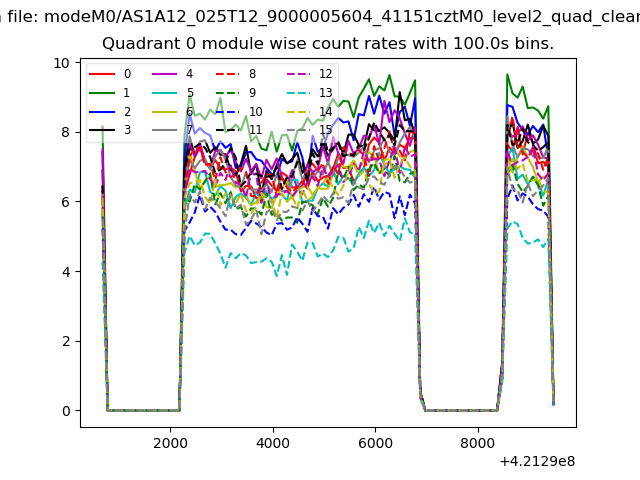 |
 |
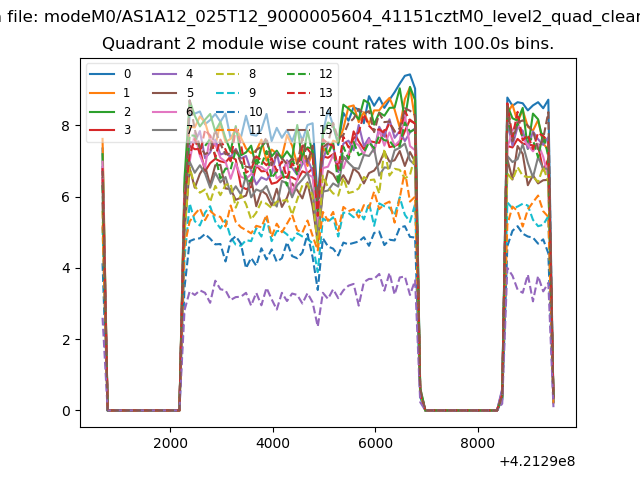
| Module-wise count rates for Quadrant B Data is divided into 100 sec bins |
 |
 |
| Module-wise count rates for Quadrant C Data is divided into 100 sec bins |
 |
 |
| Module-wise count rates for Quadrant D Data is divided into 100 sec bins |
 |
 |
| Parameter | Plot |
|---|---|
| CZT HV Monitor | 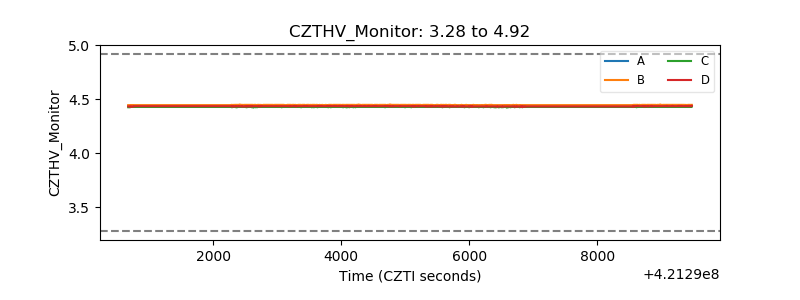 |
| D_VDD | 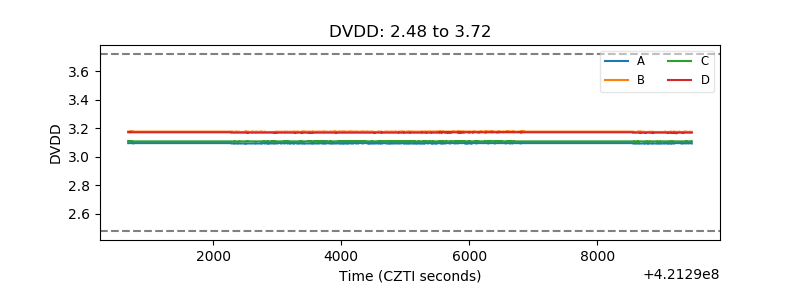 |
| Temperature 1 | 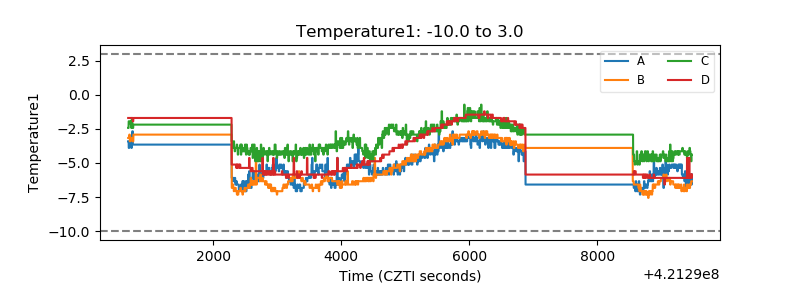 |
| Veto HV Monitor | 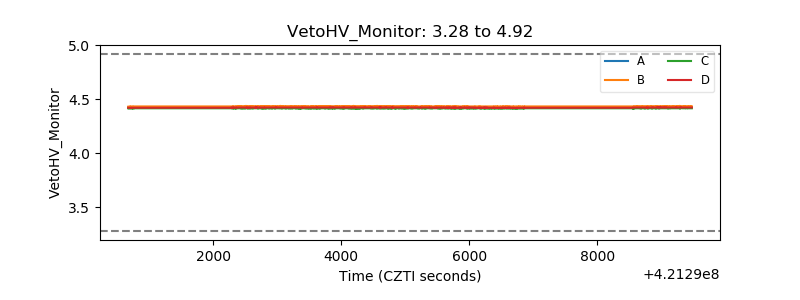 |
| Veto LLD | 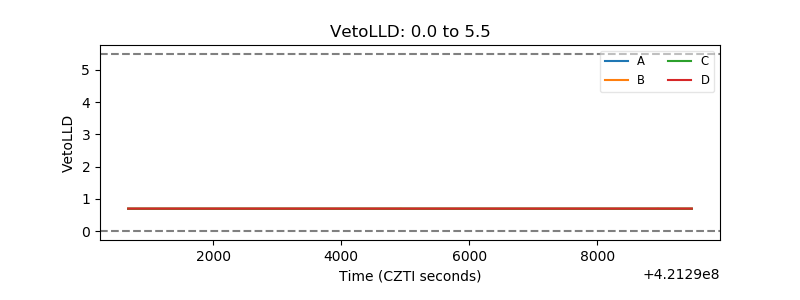 |
| Alpha Counter | 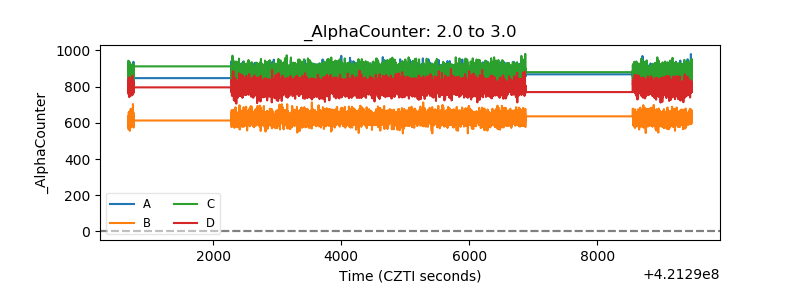 |
| _CPM_Rate | 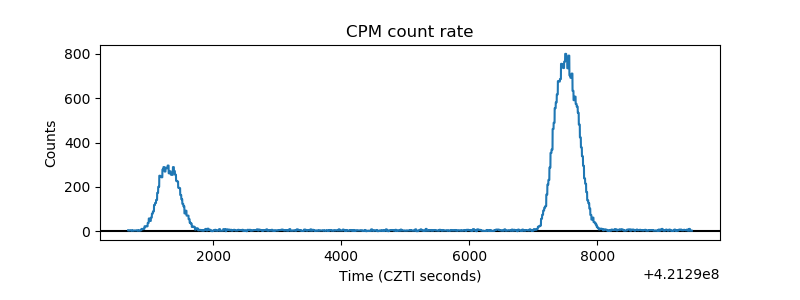 |
| CZT Counter | 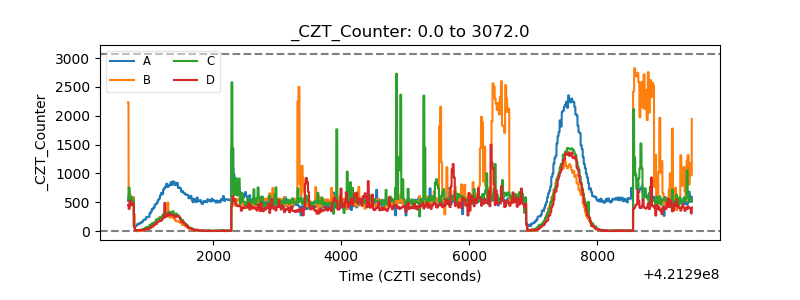 |
| +2.5 Volts monitor | 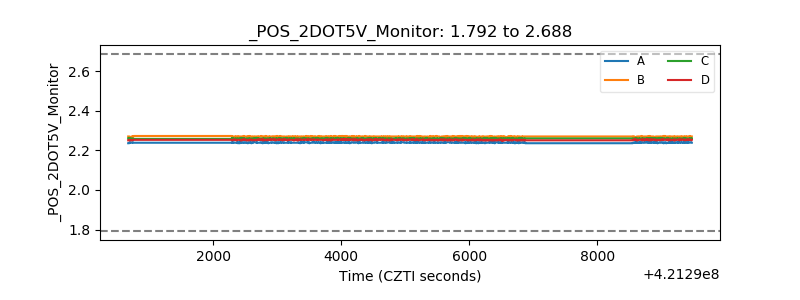 |
| +5 Volts monitor | 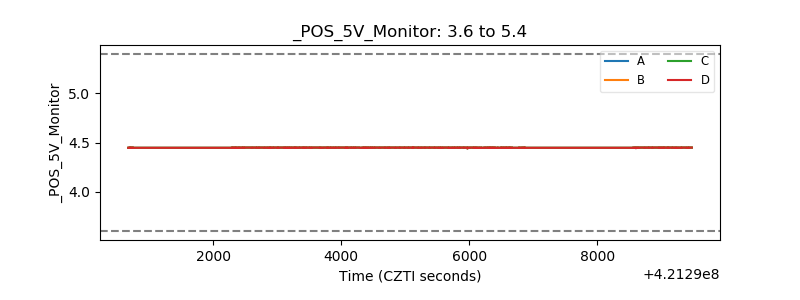 |
| _ROLL_ROT | 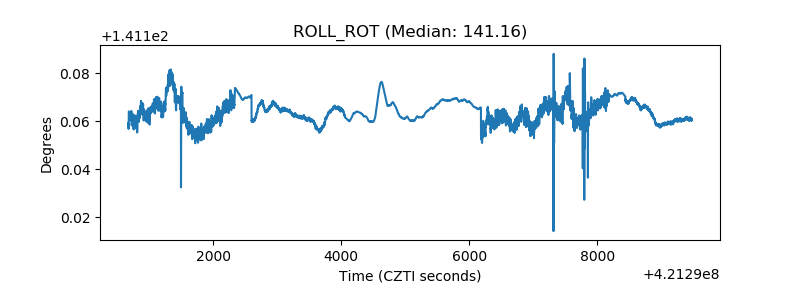 |
| _Roll_DEC | 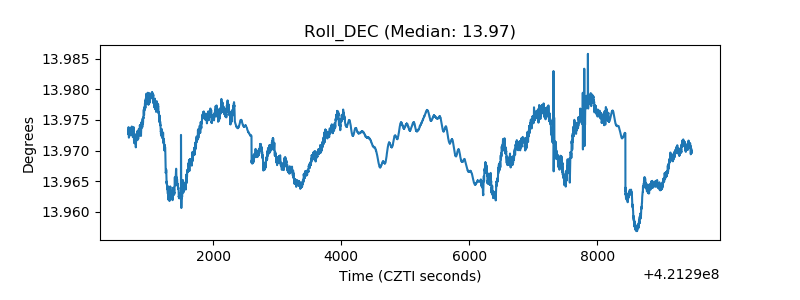 |
| _Roll_RA | 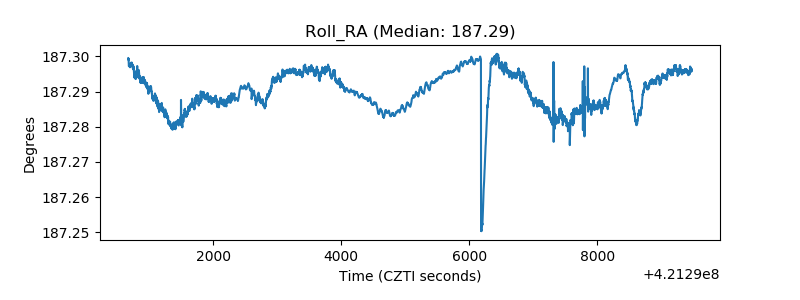 |
| Veto Counter | 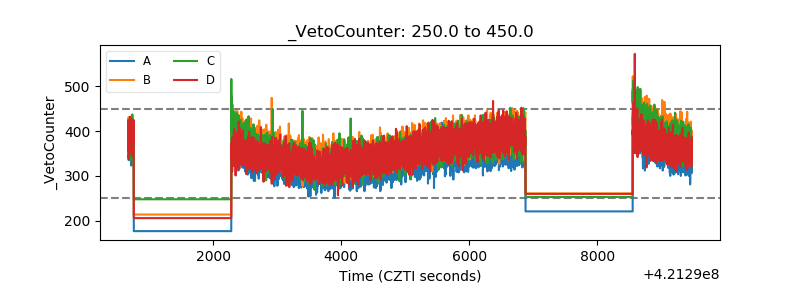 |