| Param | Original file | Final file |
|---|---|---|
| Filename | modeM0/AS1A12_025T12_9000005604_41153cztM0_level2.fits | modeM0/AS1A12_025T12_9000005604_41153cztM0_level2_quad_clean.evt |
| Size (bytes) | 367,021,440 | 88,617,600 |
| Size | 350.0 MB | 84.5 MB |
| Events in quadrant A | 2,847,723 | 608,468 |
| Events in quadrant B | 4,426,694 | 581,065 |
| Events in quadrant C | 3,406,034 | 582,980 |
| Events in quadrant D | 2,498,471 | 544,669 |
| Mode M9 | |||
|---|---|---|---|
| Quadrant | BADHDUFLAG | Total packets | Discarded packets |
| A | 0 | 23 | 0 |
| B | 0 | 23 | 0 |
| C | 0 | 23 | 0 |
| D | 0 | 24 | 0 |
| Mode SS | |||
|---|---|---|---|
| Quadrant | BADHDUFLAG | Total packets | Discarded packets |
| A | 0 | 106 | 0 |
| B | 0 | 106 | 0 |
| C | 0 | 106 | 0 |
| D | 0 | 106 | 0 |
| Mode M0 | |||
|---|---|---|---|
| Quadrant | BADHDUFLAG | Total packets | Discarded packets |
| A | 0 | 11457 | 3 |
| B | 0 | 16603 | 2 |
| C | 0 | 13456 | 2 |
| D | 0 | 11223 | 2 |
| Quadrant | Total seconds | Saturated seconds | Saturation percentage |
|---|---|---|---|
| A | 5230 | 10 | 0.191205% |
| B | 5230 | 482 | 9.216061% |
| C | 5230 | 52 | 0.994264% |
| D | 5230 | 28 | 0.535373% |
Noise dominated data is calculated using 1-second bins in cleaned event files. If a bin has >2000 counts, and if more than 50% of those come from <1% of pixels, then it is considered to be noise-dominated and hence unusable.
| Quadrant | # 1 sec bins | Bins with >0 counts | Bins with >2000 counts | High rate bins dominated by noise | Noise dominated (total time) | Noise dominated (detector-on time) | Marked lightcurve |
|---|---|---|---|---|---|---|---|
| A | 7021 | 5231 | 3 | 3 | 0.04% | 0.06% | 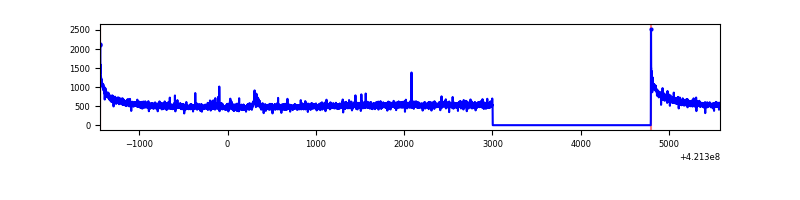 |
| B | 7021 | 5231 | 382 | 382 | 5.44% | 7.30% | 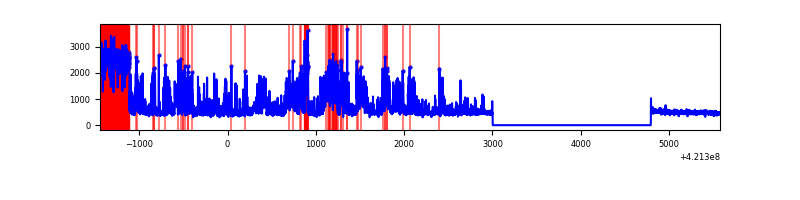 |
| C | 7021 | 5231 | 39 | 39 | 0.56% | 0.75% | 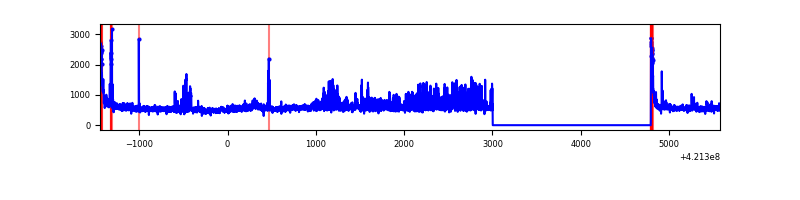 |
| D | 7021 | 5231 | 21 | 21 | 0.30% | 0.40% | 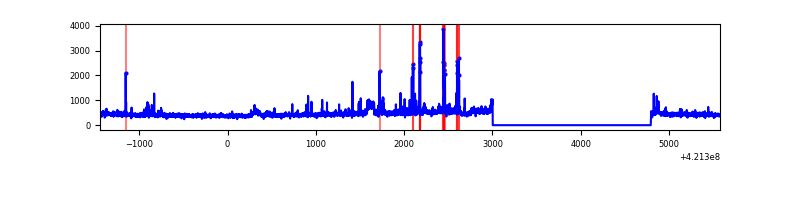 |
Top three noisy pixels from each quadrant. If the there are fewer than three noisy pixels in the level2.evt file, extra rows are filled as -1
| Pixel properties | Quadrant properties | ||||||
|---|---|---|---|---|---|---|---|
| Quadrant | DetID | PixID | Counts | Sigma | Mean | Median | Sigma |
| A | 10 | 83 | 491799 | 3982.32 | 599 | 586 | 123.3 |
| A | 2 | 79 | 28481 | 226.15 | 599 | 586 | 123.3 |
| A | 13 | 254 | 8932 | 67.66 | 599 | 586 | 123.3 |
| B | 7 | 202 | 2035661 | 18327.7 | 571 | 554 | 111.0 |
| B | 5 | 255 | 87440 | 782.48 | 571 | 554 | 111.0 |
| B | 0 | 245 | 34180 | 302.83 | 571 | 554 | 111.0 |
| C | 9 | 54 | 771969 | 5667.25 | 579 | 581 | 136.1 |
| C | 15 | 214 | 228590 | 1675.14 | 579 | 581 | 136.1 |
| C | 0 | 10 | 114664 | 838.15 | 579 | 581 | 136.1 |
| D | 2 | 16 | 116775 | 806.45 | 578 | 561 | 144.1 |
| D | 2 | 249 | 61743 | 424.56 | 578 | 561 | 144.1 |
| D | 13 | 249 | 60300 | 414.55 | 578 | 561 | 144.1 |
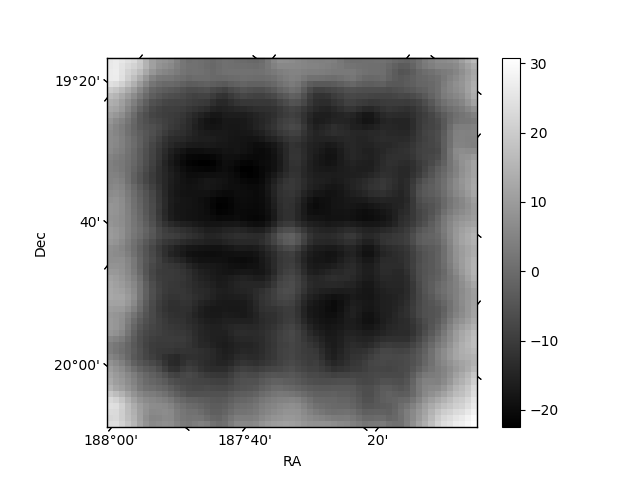
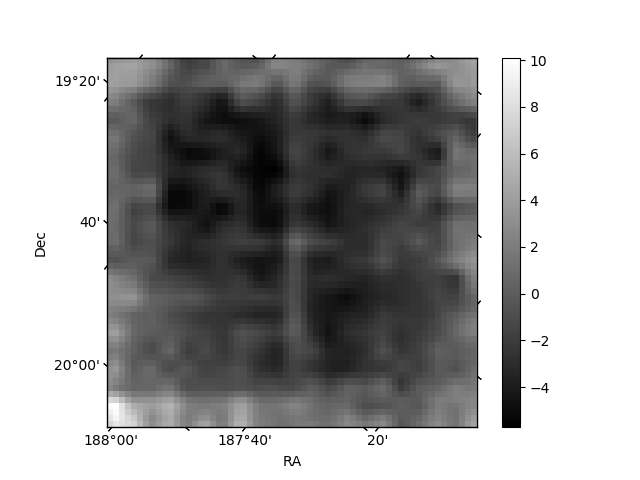
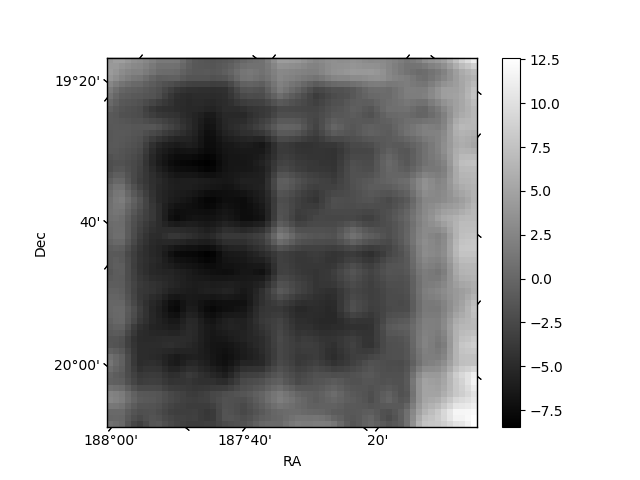
Histogram calculated using DETX and DETY for each event in the final _common_clean file
| Quadrant A | 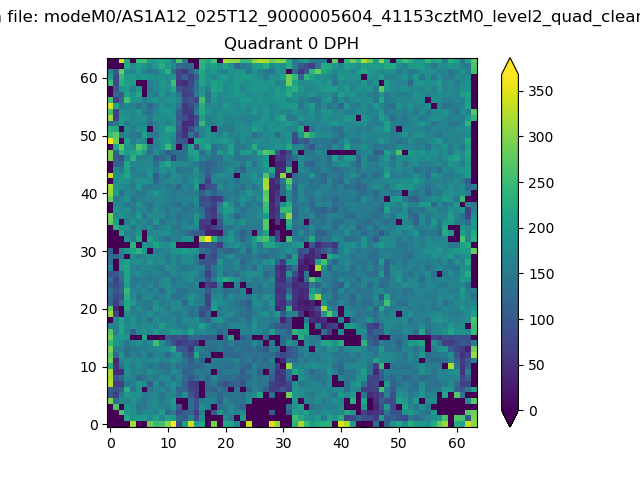 |
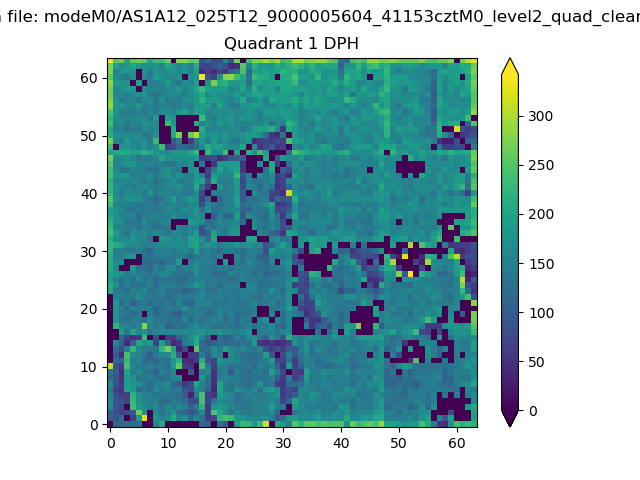 |
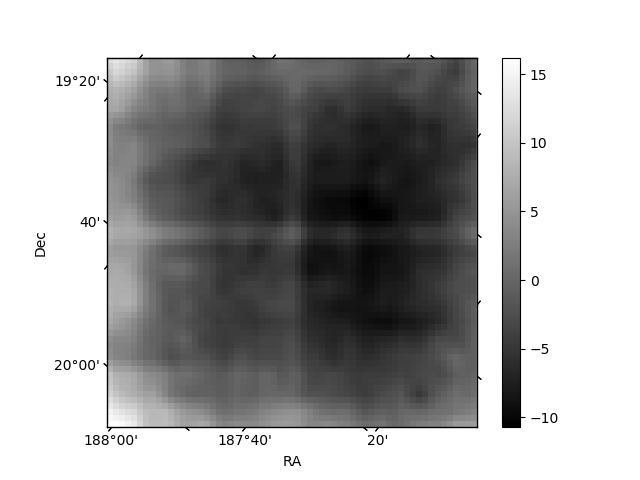
Quadrant B |
|---|---|---|---|
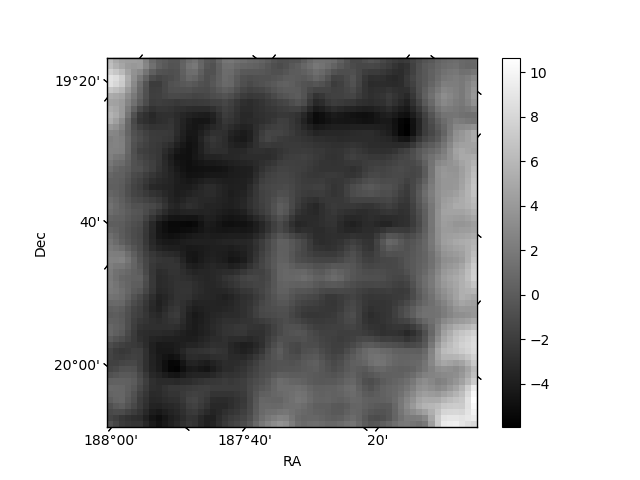
| Quadrant D | 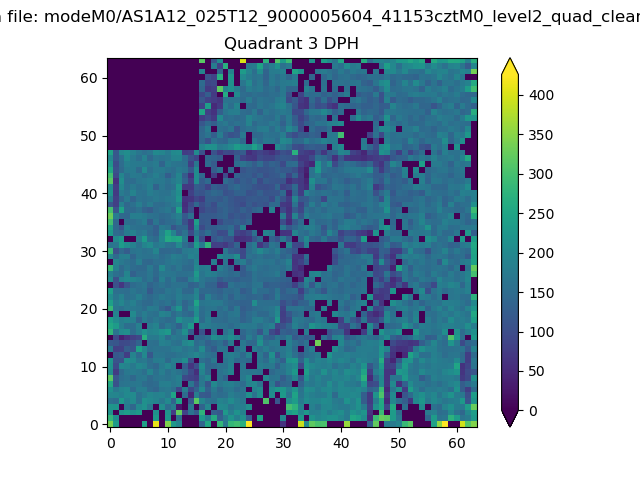 |
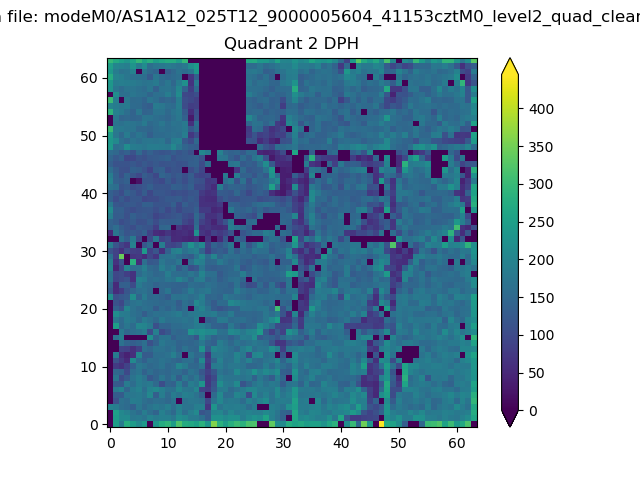 |
Quadrant C |
| Plot type | Count rate plots | Images |
|---|---|---|
| Comparison with Poisson distribution Blue bars denote a histogram of data divided into 1 sec bins. Red curve is a Poisson curve with rate = median count rate of data. |
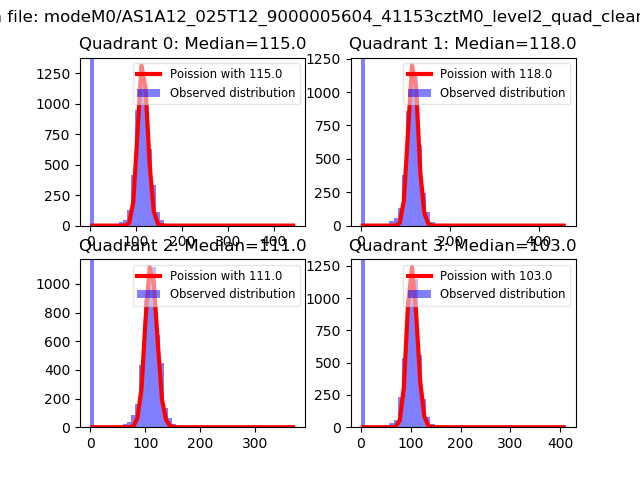 |
 |
| Quadrant-wise count rates Data is divided into 100 sec bins |
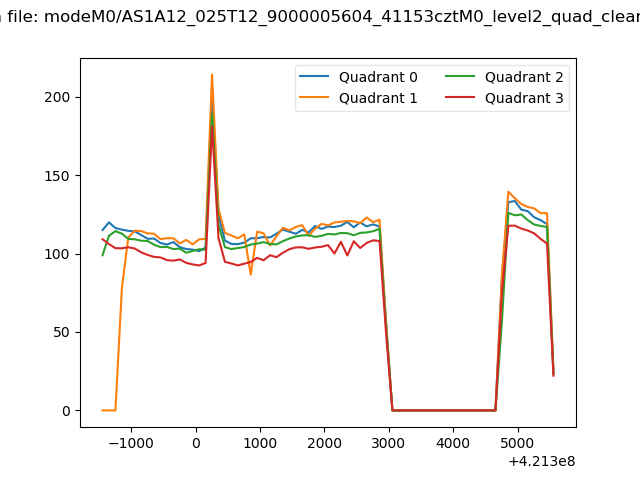 |
|
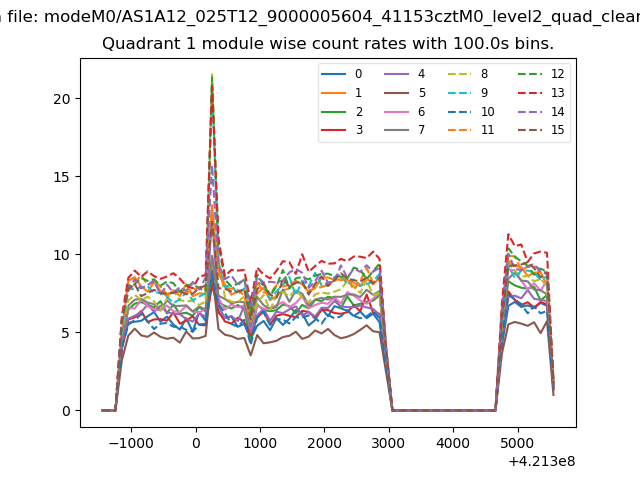
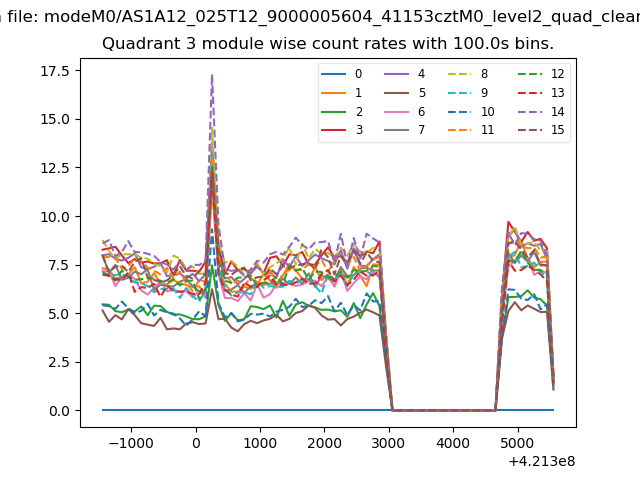
| Module-wise count rates for Quadrant A Data is divided into 100 sec bins |
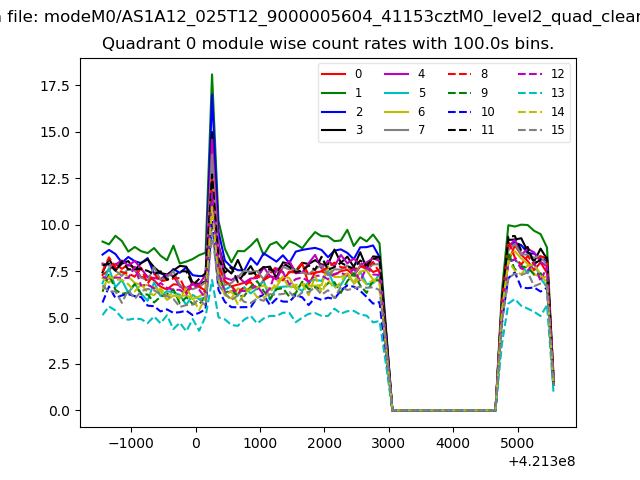 |
 |
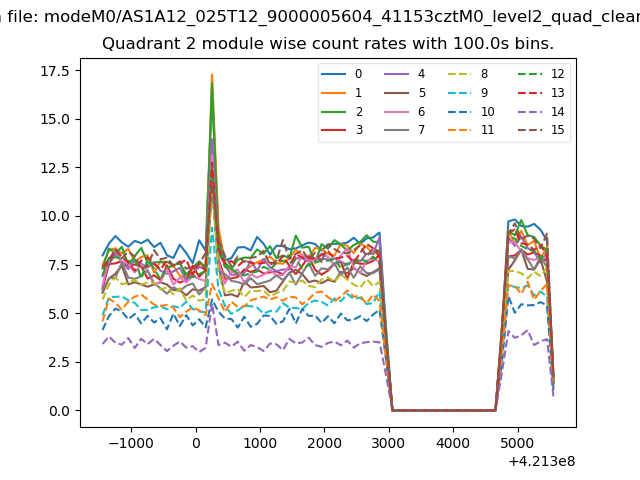
| Module-wise count rates for Quadrant B Data is divided into 100 sec bins |
 |
 |
| Module-wise count rates for Quadrant C Data is divided into 100 sec bins |
 |
 |
| Module-wise count rates for Quadrant D Data is divided into 100 sec bins |
 |
 |
| Parameter | Plot |
|---|---|
| CZT HV Monitor | 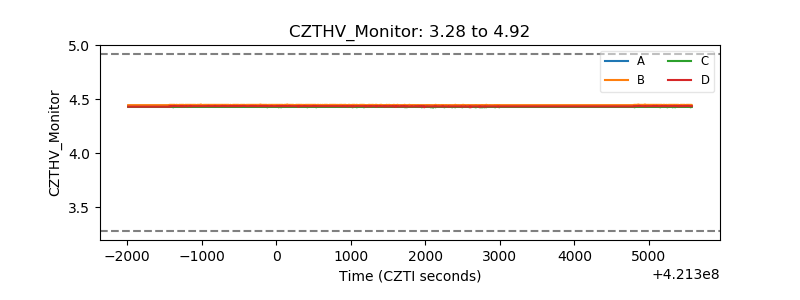 |
| D_VDD | 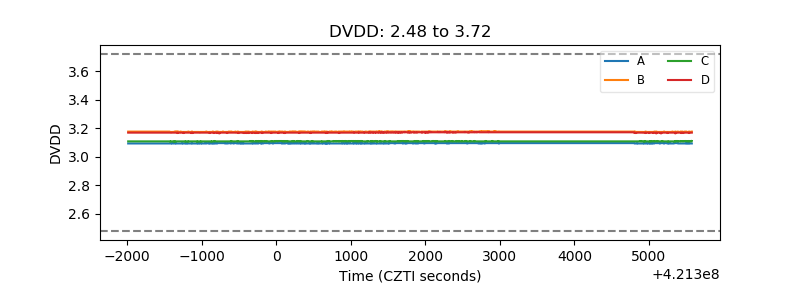 |
| Temperature 1 | 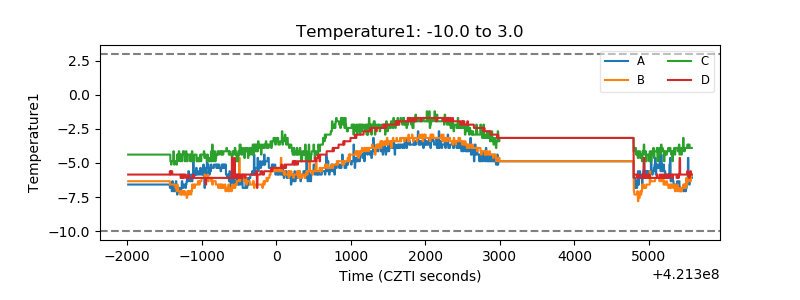 |
| Veto HV Monitor | 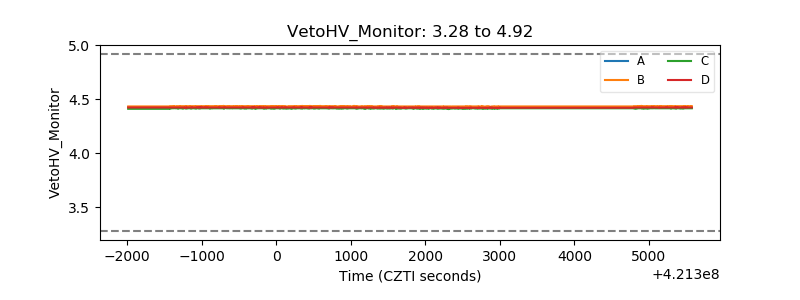 |
| Veto LLD | 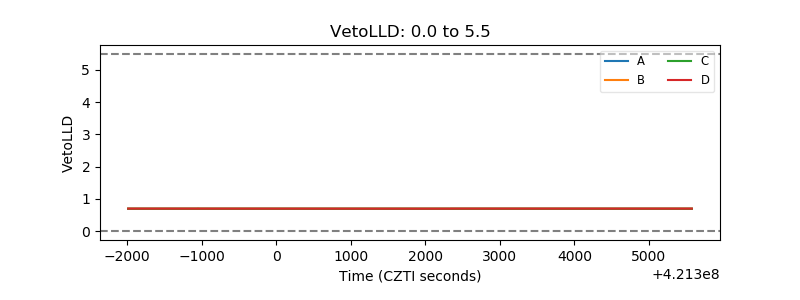 |
| Alpha Counter | 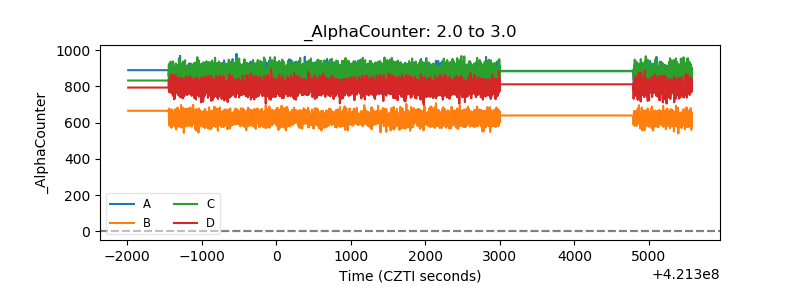 |
| _CPM_Rate | 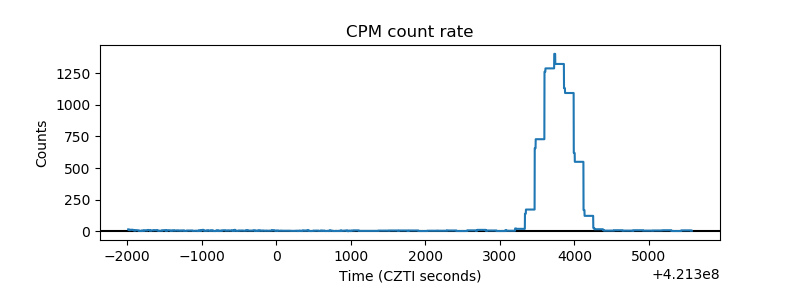 |
| CZT Counter | 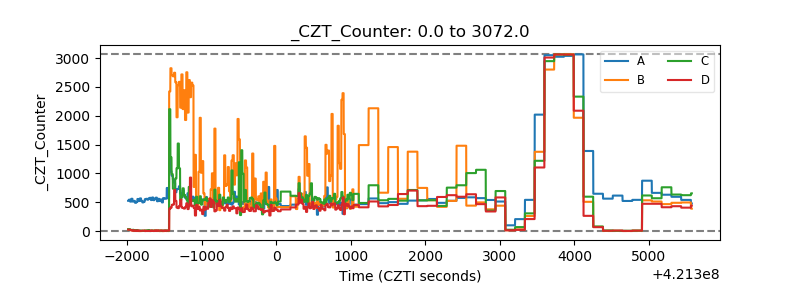 |
| +2.5 Volts monitor | 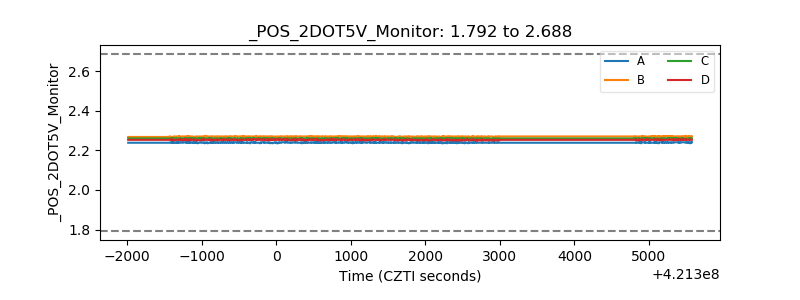 |
| +5 Volts monitor | 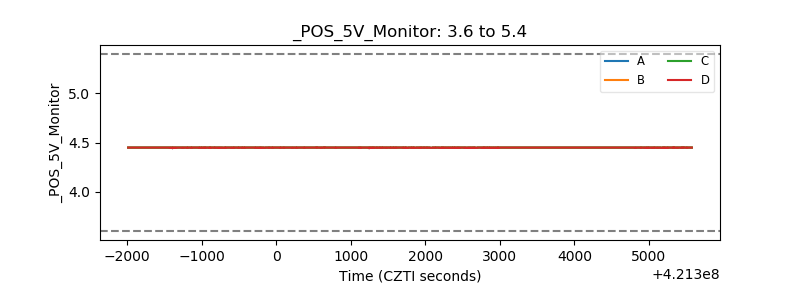 |
| _ROLL_ROT | 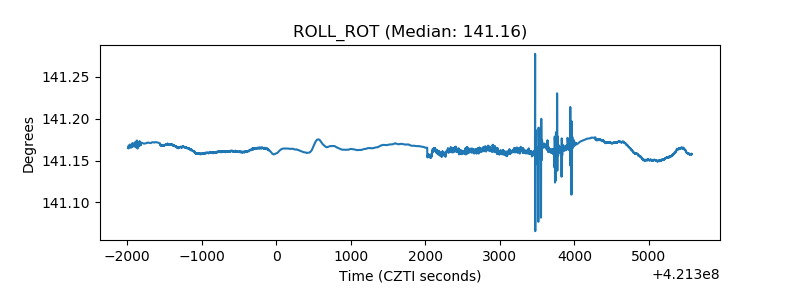 |
| _Roll_DEC | 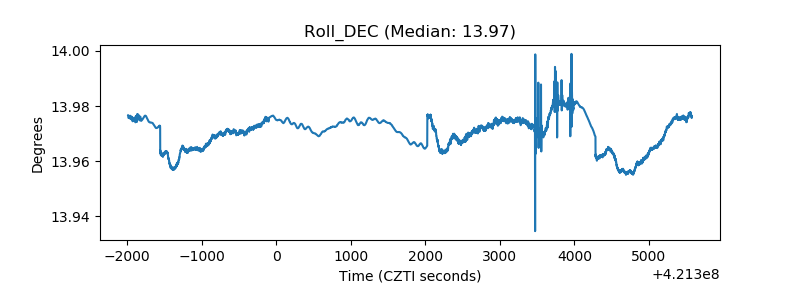 |
| _Roll_RA | 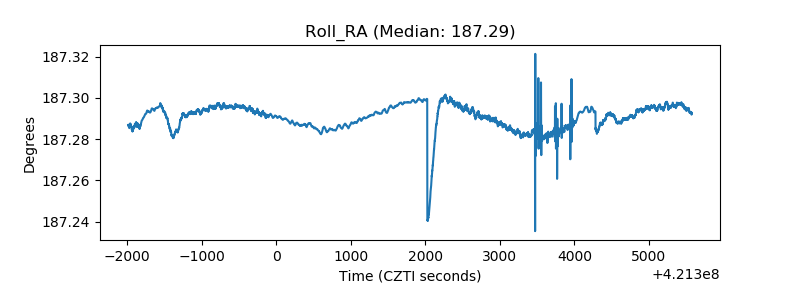 |
| Veto Counter | 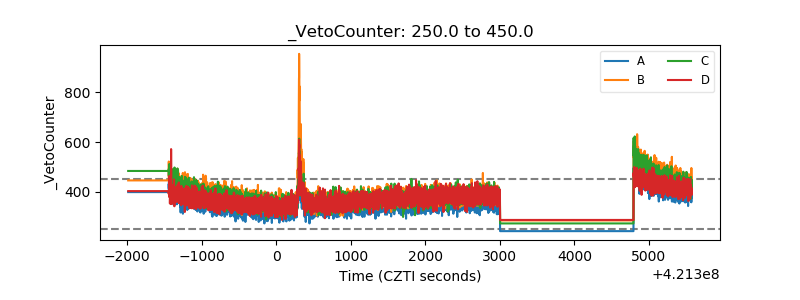 |