| Param | Original file | Final file |
|---|---|---|
| Filename | modeM0/AS1A12_025T12_9000005604_41154cztM0_level2.fits | modeM0/AS1A12_025T12_9000005604_41154cztM0_level2_quad_clean.evt |
| Size (bytes) | 305,844,480 | 90,164,160 |
| Size | 291.7 MB | 86.0 MB |
| Events in quadrant A | 2,827,632 | 615,922 |
| Events in quadrant B | 2,489,656 | 634,914 |
| Events in quadrant C | 2,883,772 | 581,526 |
| Events in quadrant D | 2,725,913 | 543,234 |
| Mode M9 | |||
|---|---|---|---|
| Quadrant | BADHDUFLAG | Total packets | Discarded packets |
| A | 0 | 25 | 0 |
| B | 0 | 25 | 0 |
| C | 0 | 25 | 0 |
| D | 0 | 26 | 0 |
| Mode SS | |||
|---|---|---|---|
| Quadrant | BADHDUFLAG | Total packets | Discarded packets |
| A | 0 | 104 | 0 |
| B | 0 | 104 | 0 |
| C | 0 | 104 | 0 |
| D | 0 | 104 | 0 |
| Mode M0 | |||
|---|---|---|---|
| Quadrant | BADHDUFLAG | Total packets | Discarded packets |
| A | 0 | 11308 | 3 |
| B | 0 | 10476 | 2 |
| C | 0 | 11499 | 2 |
| D | 0 | 11544 | 2 |
| Quadrant | Total seconds | Saturated seconds | Saturation percentage |
|---|---|---|---|
| A | 5058 | 8 | 0.158165% |
| B | 5058 | 15 | 0.296560% |
| C | 5058 | 68 | 1.344405% |
| D | 5058 | 81 | 1.601423% |
Noise dominated data is calculated using 1-second bins in cleaned event files. If a bin has >2000 counts, and if more than 50% of those come from <1% of pixels, then it is considered to be noise-dominated and hence unusable.
| Quadrant | # 1 sec bins | Bins with >0 counts | Bins with >2000 counts | High rate bins dominated by noise | Noise dominated (total time) | Noise dominated (detector-on time) | Marked lightcurve |
|---|---|---|---|---|---|---|---|
| A | 6970 | 5059 | 2 | 2 | 0.03% | 0.04% | 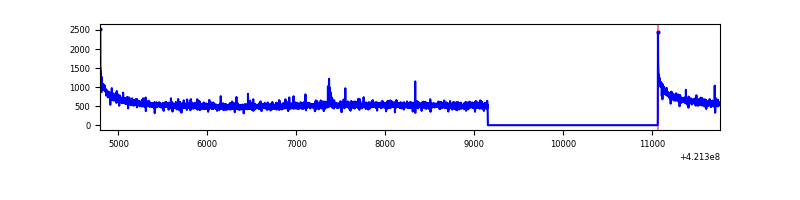 |
| B | 6970 | 5059 | 2 | 2 | 0.03% | 0.04% | 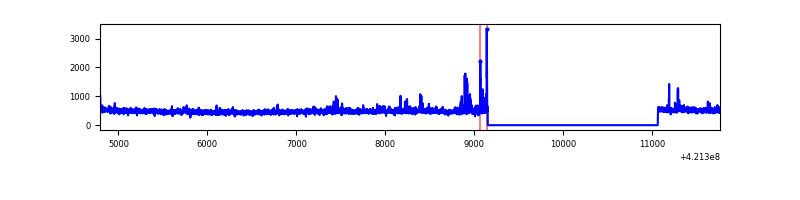 |
| C | 6970 | 5059 | 59 | 59 | 0.85% | 1.17% | 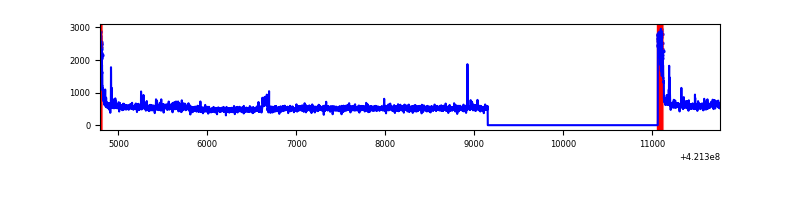 |
| D | 6970 | 5059 | 73 | 73 | 1.05% | 1.44% | 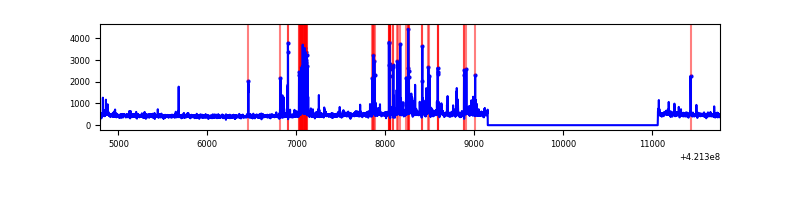 |
Top three noisy pixels from each quadrant. If the there are fewer than three noisy pixels in the level2.evt file, extra rows are filled as -1
| Pixel properties | Quadrant properties | ||||||
|---|---|---|---|---|---|---|---|
| Quadrant | DetID | PixID | Counts | Sigma | Mean | Median | Sigma |
| A | 10 | 83 | 483869 | 3937.89 | 601 | 590 | 122.7 |
| A | 2 | 79 | 22820 | 181.14 | 601 | 590 | 122.7 |
| A | 13 | 254 | 7891 | 59.49 | 601 | 590 | 122.7 |
| B | 0 | 245 | 99698 | 855.99 | 596 | 582 | 115.8 |
| B | 0 | 190 | 22496 | 189.25 | 596 | 582 | 115.8 |
| B | 5 | 255 | 19139 | 160.26 | 596 | 582 | 115.8 |
| C | 9 | 54 | 227523 | 1695.32 | 575 | 580 | 133.9 |
| C | 15 | 214 | 223199 | 1663.02 | 575 | 580 | 133.9 |
| C | 0 | 10 | 183308 | 1365.02 | 575 | 580 | 133.9 |
| D | 2 | 249 | 264495 | 1860.03 | 574 | 557 | 141.9 |
| D | 13 | 249 | 110861 | 777.34 | 574 | 557 | 141.9 |
| D | 2 | 16 | 87872 | 615.33 | 574 | 557 | 141.9 |
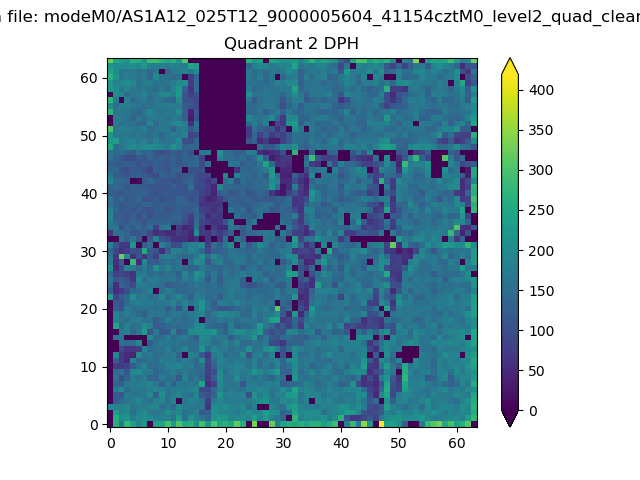
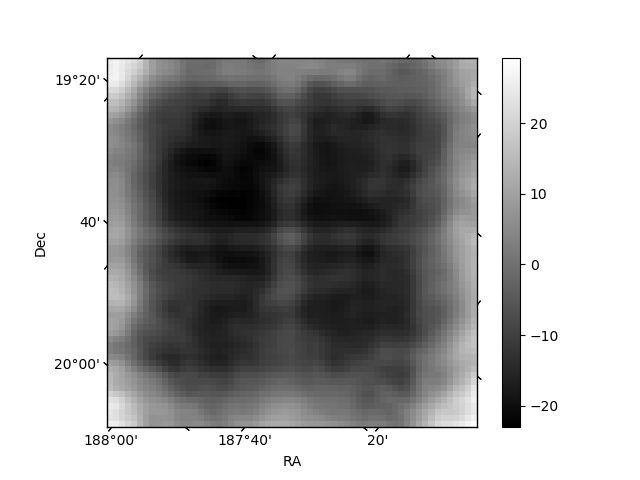
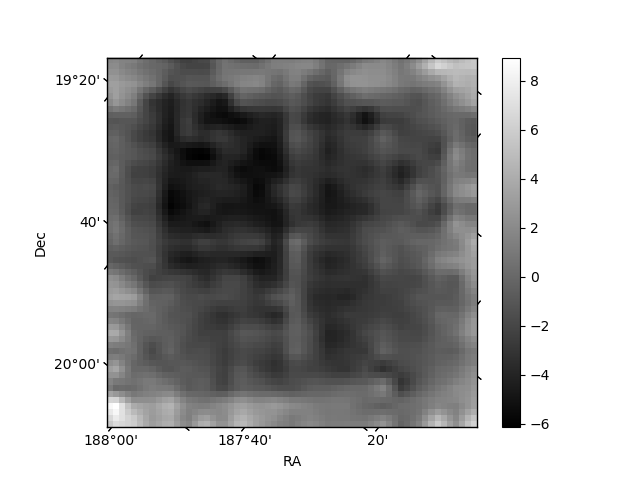
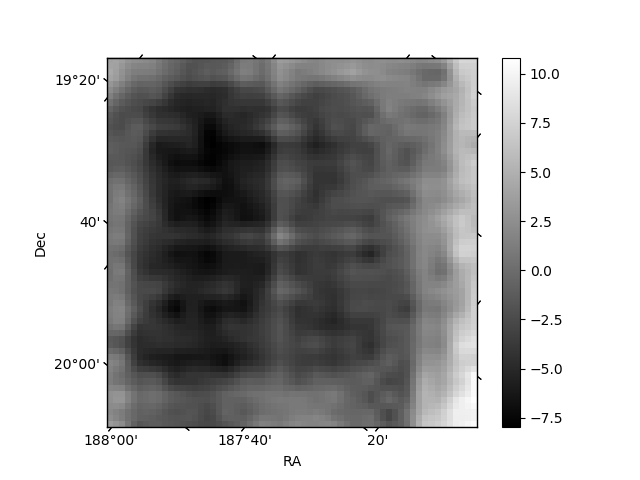
Histogram calculated using DETX and DETY for each event in the final _common_clean file
| Quadrant A | 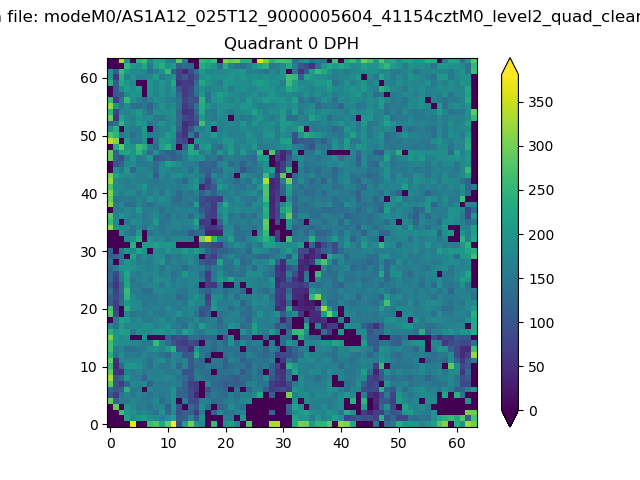 |
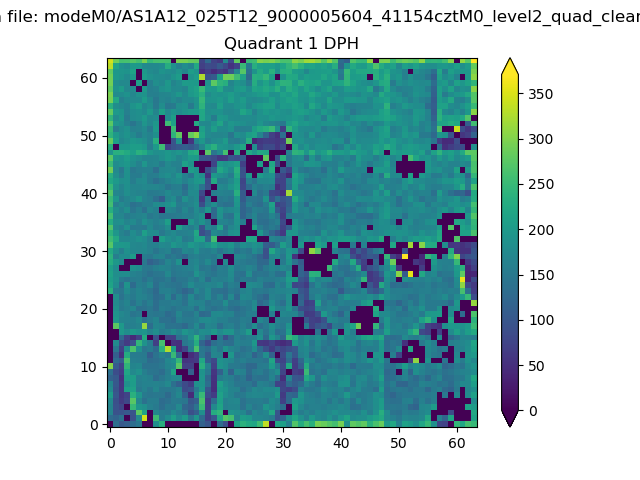 |
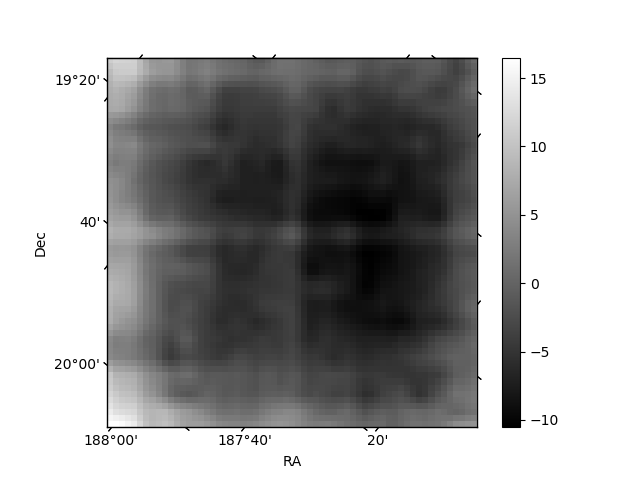
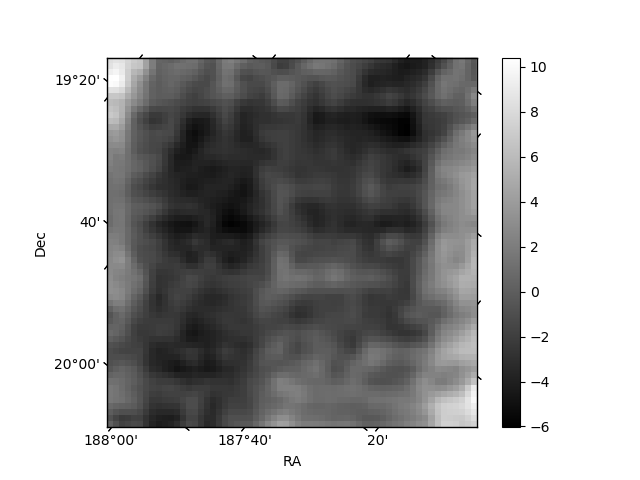
Quadrant B |
|---|---|---|---|
| Quadrant D | 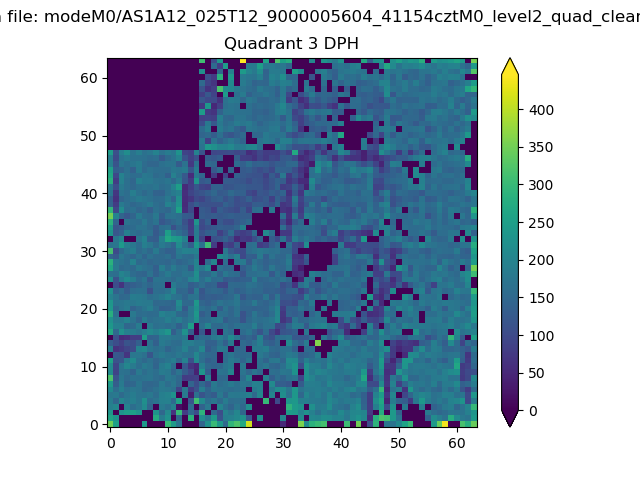 |
 |
Quadrant C |
| Plot type | Count rate plots | Images |
|---|---|---|
| Comparison with Poisson distribution Blue bars denote a histogram of data divided into 1 sec bins. Red curve is a Poisson curve with rate = median count rate of data. |
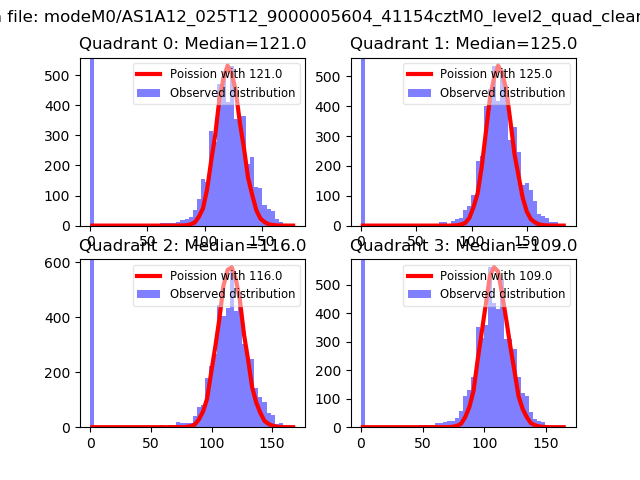 |
 |
| Quadrant-wise count rates Data is divided into 100 sec bins |
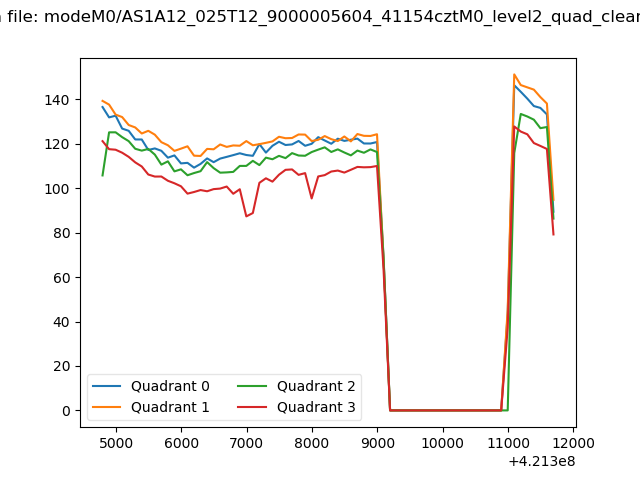 |
|
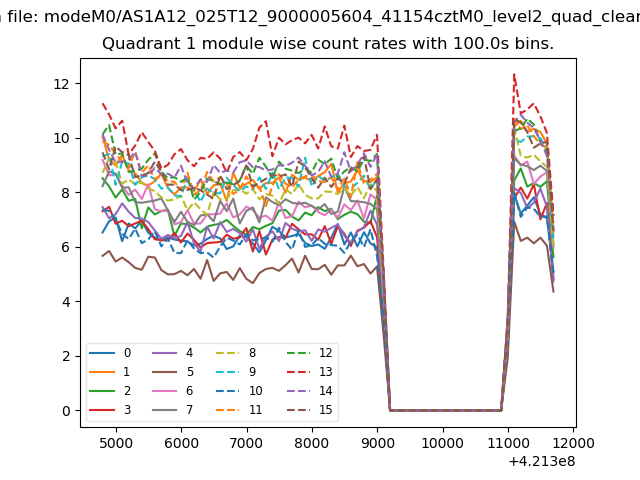
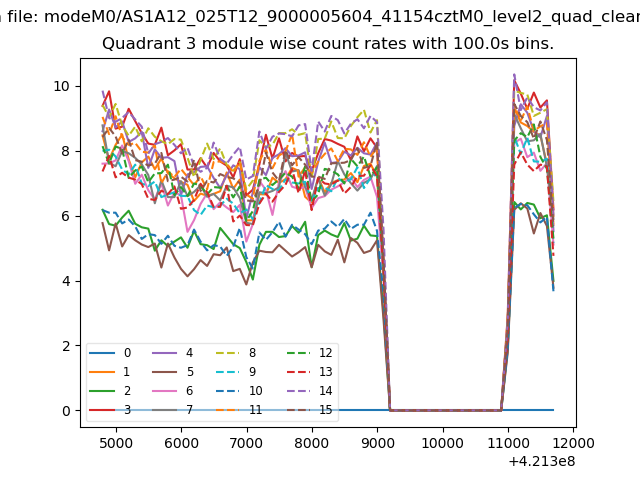
| Module-wise count rates for Quadrant A Data is divided into 100 sec bins |
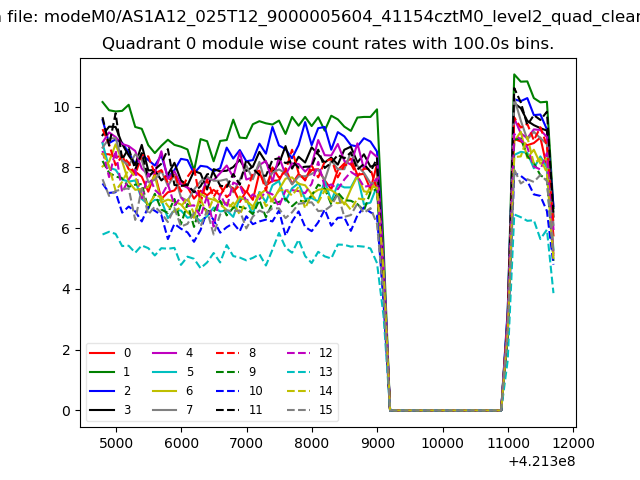 |
 |
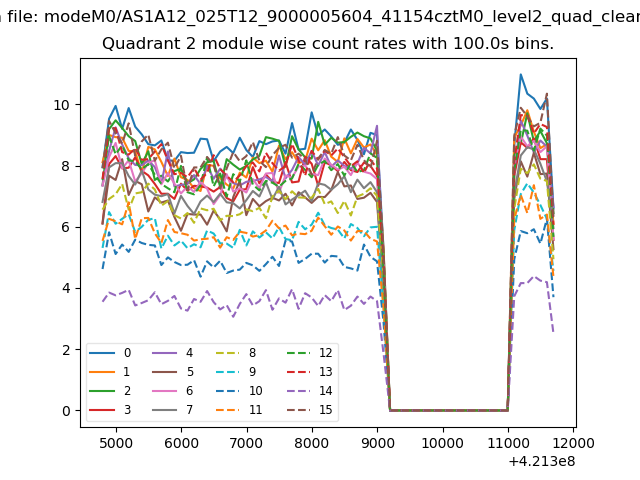
| Module-wise count rates for Quadrant B Data is divided into 100 sec bins |
 |
 |
| Module-wise count rates for Quadrant C Data is divided into 100 sec bins |
 |
 |
| Module-wise count rates for Quadrant D Data is divided into 100 sec bins |
 |
 |
| Parameter | Plot |
|---|---|
| CZT HV Monitor | 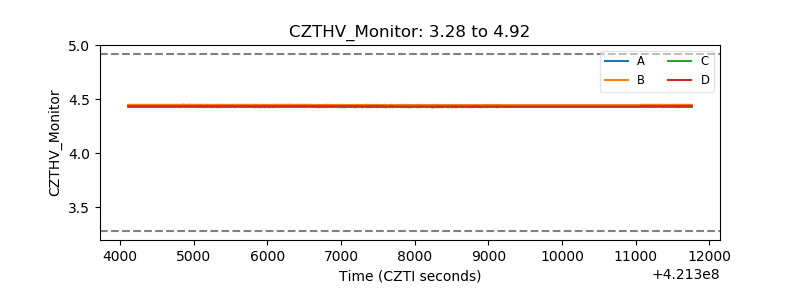 |
| D_VDD | 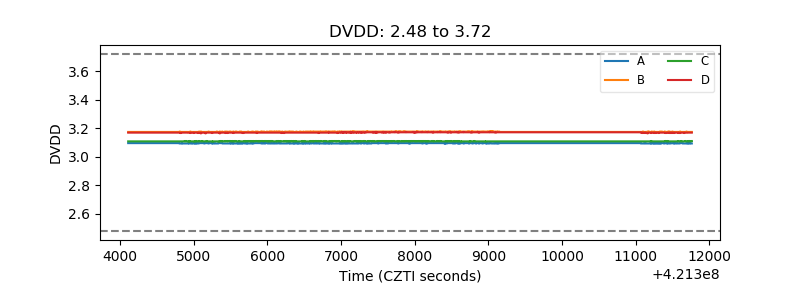 |
| Temperature 1 | 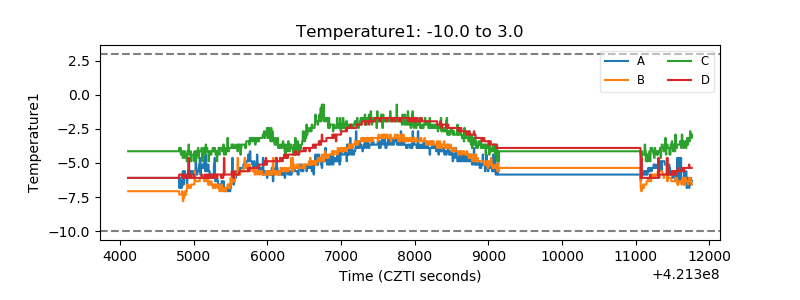 |
| Veto HV Monitor | 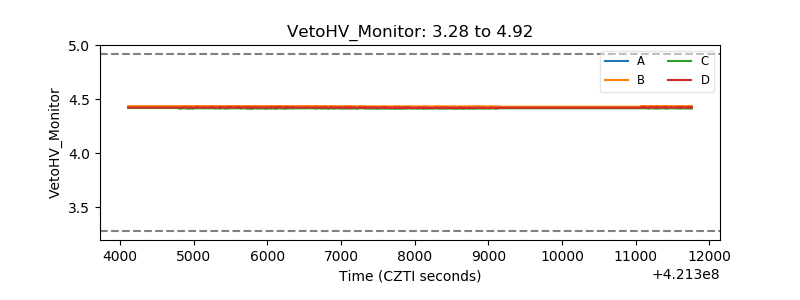 |
| Veto LLD | 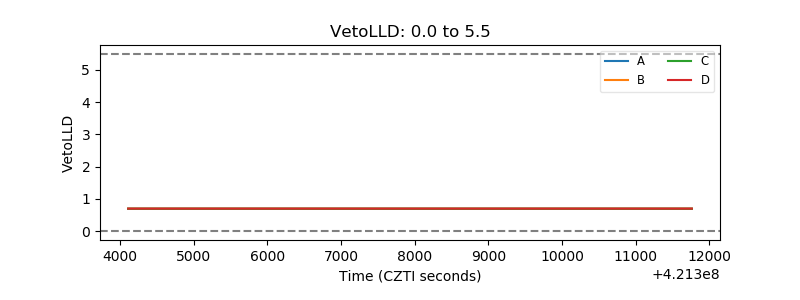 |
| Alpha Counter | 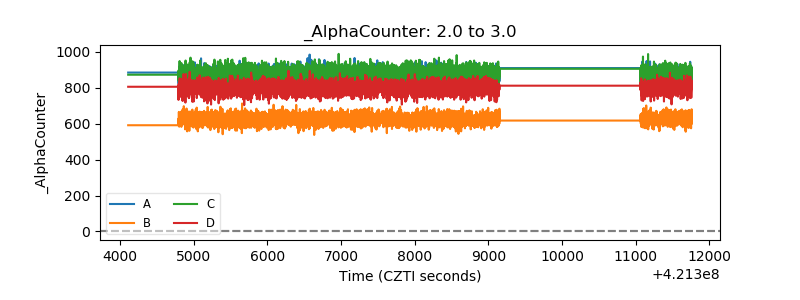 |
| _CPM_Rate | 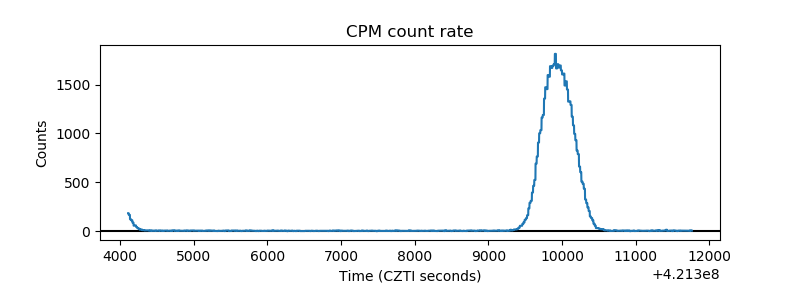 |
| CZT Counter | 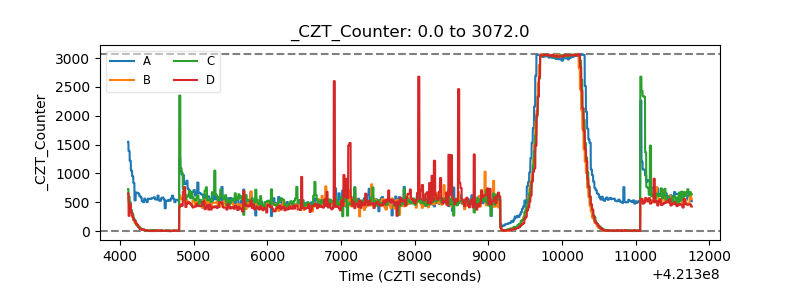 |
| +2.5 Volts monitor | 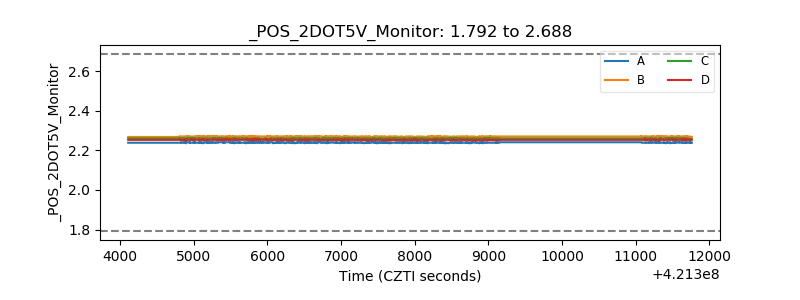 |
| +5 Volts monitor | 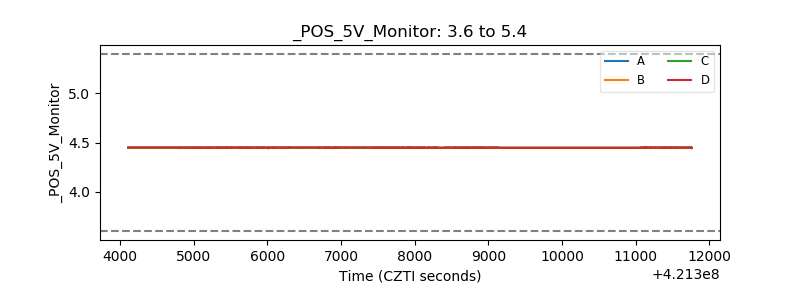 |
| _ROLL_ROT | 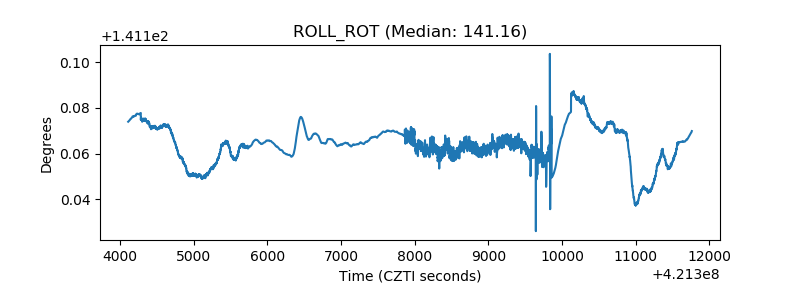 |
| _Roll_DEC |  |
| _Roll_RA | 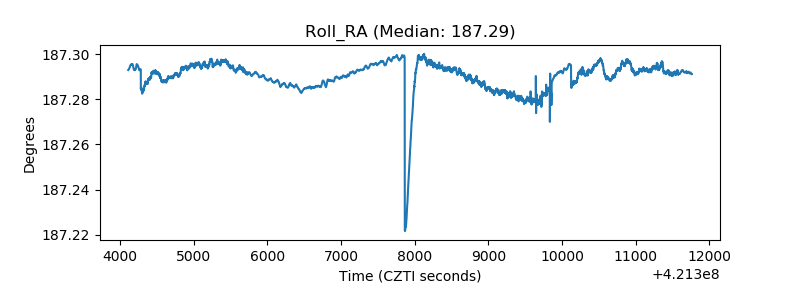 |
| Veto Counter | 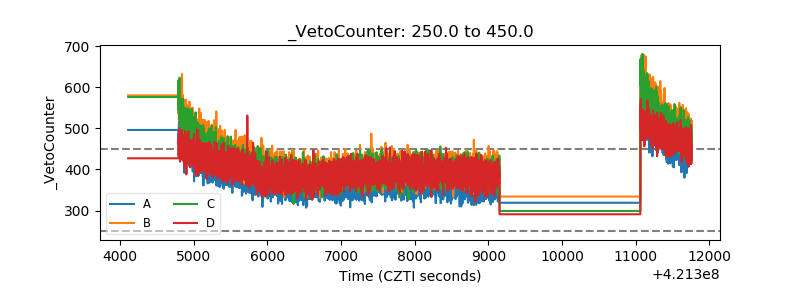 |