| Param | Original file | Final file |
|---|---|---|
| Filename | modeM0/AS1A12_025T12_9000005604_41155cztM0_level2.fits | modeM0/AS1A12_025T12_9000005604_41155cztM0_level2_quad_clean.evt |
| Size (bytes) | 331,346,880 | 95,552,640 |
| Size | 316.0 MB | 91.1 MB |
| Events in quadrant A | 2,985,110 | 660,620 |
| Events in quadrant B | 2,556,617 | 685,627 |
| Events in quadrant C | 3,304,631 | 617,489 |
| Events in quadrant D | 3,019,525 | 570,713 |
| Mode M9 | |||
|---|---|---|---|
| Quadrant | BADHDUFLAG | Total packets | Discarded packets |
| A | 0 | 36 | 0 |
| B | 0 | 36 | 0 |
| C | 0 | 36 | 0 |
| D | 0 | 37 | 0 |
| Mode SS | |||
|---|---|---|---|
| Quadrant | BADHDUFLAG | Total packets | Discarded packets |
| A | 0 | 104 | 0 |
| B | 0 | 104 | 0 |
| C | 0 | 104 | 0 |
| D | 0 | 104 | 0 |
| Mode M0 | |||
|---|---|---|---|
| Quadrant | BADHDUFLAG | Total packets | Discarded packets |
| A | 0 | 11801 | 3 |
| B | 0 | 10561 | 2 |
| C | 0 | 13003 | 2 |
| D | 0 | 12201 | 2 |
| Quadrant | Total seconds | Saturated seconds | Saturation percentage |
|---|---|---|---|
| A | 5129 | 12 | 0.233964% |
| B | 5129 | 7 | 0.136479% |
| C | 5129 | 114 | 2.222655% |
| D | 5129 | 141 | 2.749074% |
Noise dominated data is calculated using 1-second bins in cleaned event files. If a bin has >2000 counts, and if more than 50% of those come from <1% of pixels, then it is considered to be noise-dominated and hence unusable.
| Quadrant | # 1 sec bins | Bins with >0 counts | Bins with >2000 counts | High rate bins dominated by noise | Noise dominated (total time) | Noise dominated (detector-on time) | Marked lightcurve |
|---|---|---|---|---|---|---|---|
| A | 7162 | 5130 | 3 | 3 | 0.04% | 0.06% | 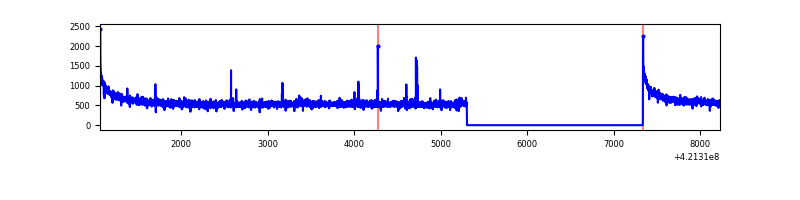 |
| B | 7162 | 5130 | 0 | 0 | 0.00% | 0.00% | 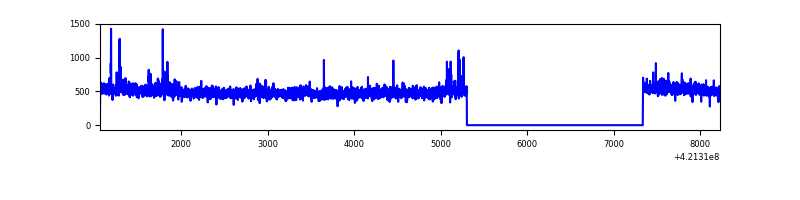 |
| C | 7162 | 5130 | 110 | 110 | 1.54% | 2.14% | 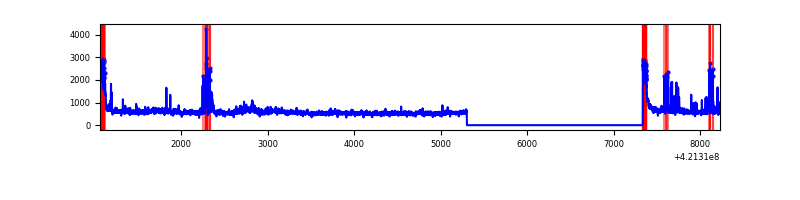 |
| D | 7162 | 5130 | 116 | 116 | 1.62% | 2.26% | 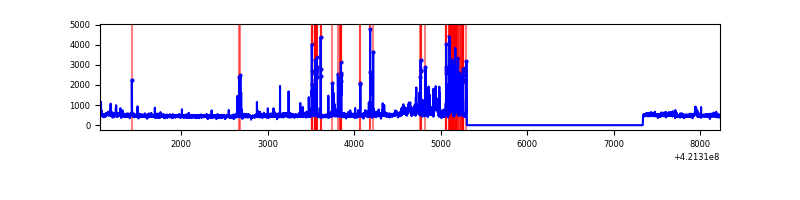 |
Top three noisy pixels from each quadrant. If the there are fewer than three noisy pixels in the level2.evt file, extra rows are filled as -1
| Pixel properties | Quadrant properties | ||||||
|---|---|---|---|---|---|---|---|
| Quadrant | DetID | PixID | Counts | Sigma | Mean | Median | Sigma |
| A | 10 | 83 | 499471 | 3865.46 | 635 | 622 | 129.1 |
| A | 2 | 79 | 30292 | 229.91 | 635 | 622 | 129.1 |
| A | 13 | 254 | 7918 | 56.53 | 635 | 622 | 129.1 |
| B | 0 | 245 | 50253 | 407.9 | 628 | 614 | 121.7 |
| B | 0 | 190 | 30273 | 243.72 | 628 | 614 | 121.7 |
| B | 12 | 111 | 15006 | 118.26 | 628 | 614 | 121.7 |
| C | 9 | 54 | 409963 | 2928.24 | 600 | 604 | 139.8 |
| C | 0 | 10 | 238027 | 1698.34 | 600 | 604 | 139.8 |
| C | 15 | 214 | 224033 | 1598.24 | 600 | 604 | 139.8 |
| D | 13 | 249 | 396211 | 2666.17 | 603 | 586 | 148.4 |
| D | 2 | 16 | 104018 | 697.04 | 603 | 586 | 148.4 |
| D | 9 | 19 | 100612 | 674.09 | 603 | 586 | 148.4 |
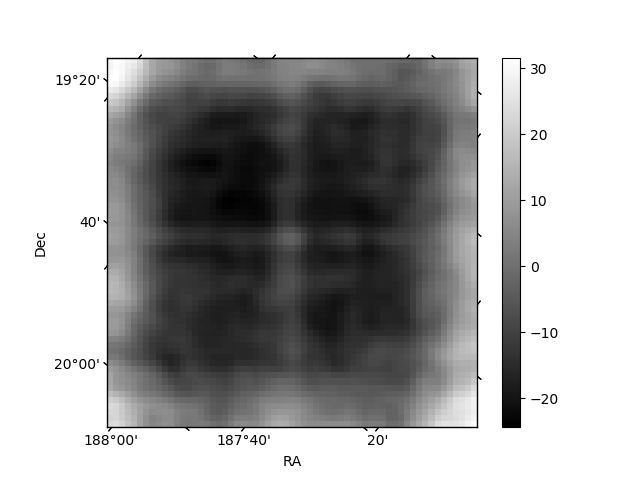
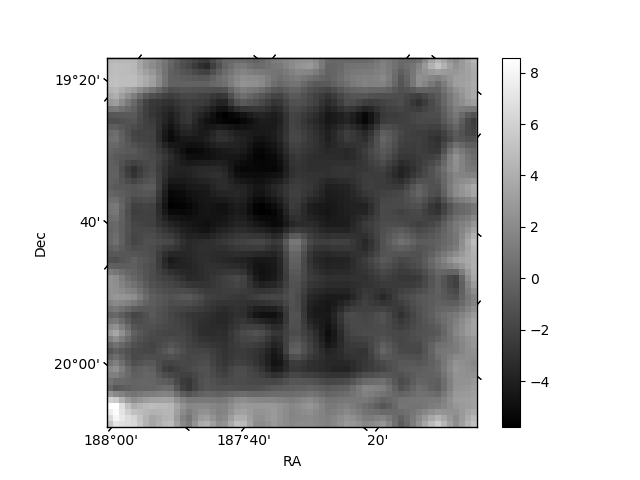
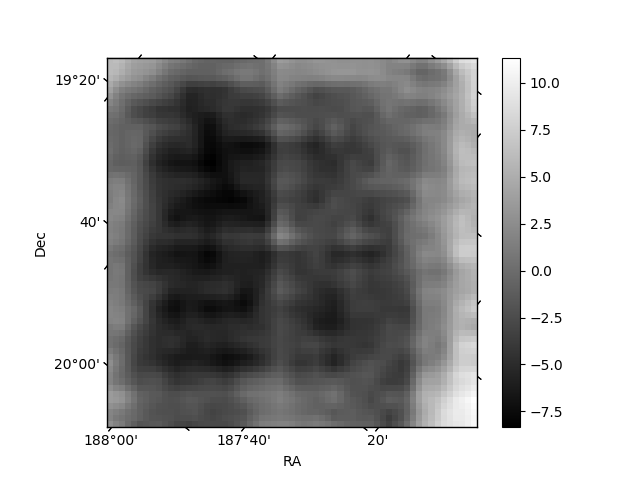
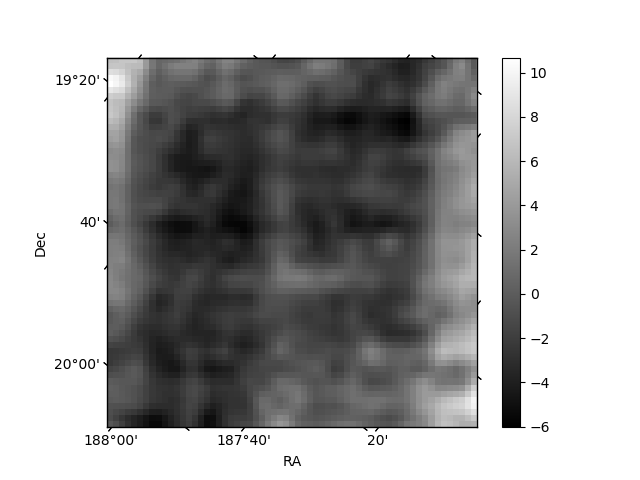
Histogram calculated using DETX and DETY for each event in the final _common_clean file
| Quadrant A | 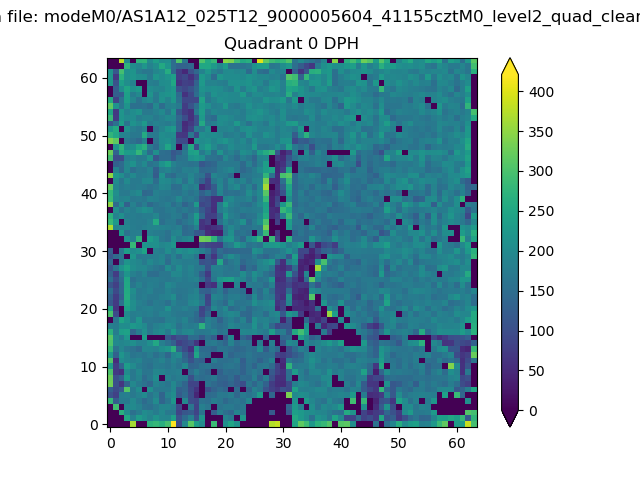 |
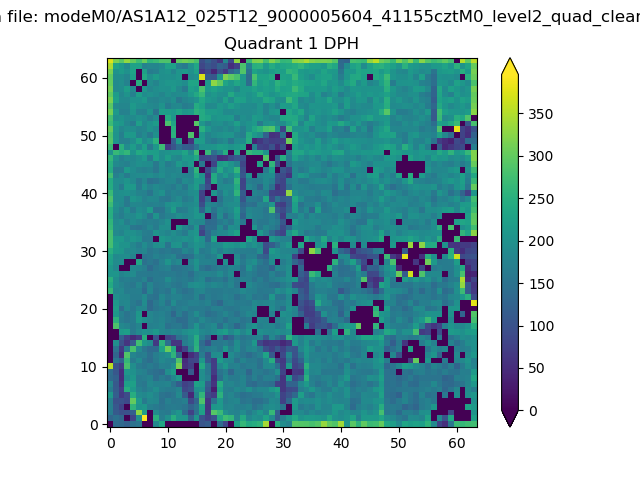 |
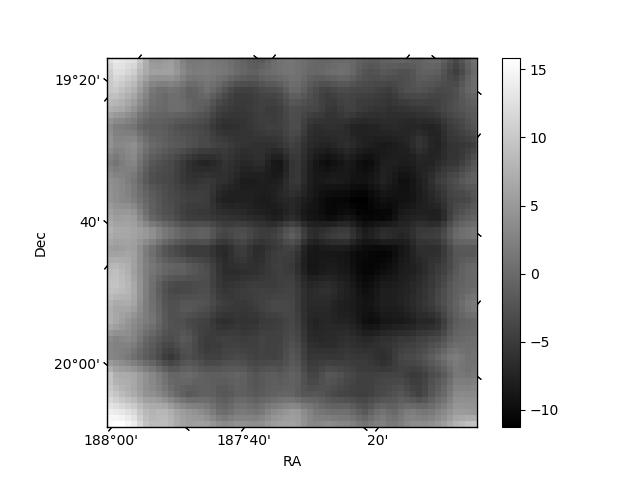
Quadrant B |
|---|---|---|---|
| Quadrant D | 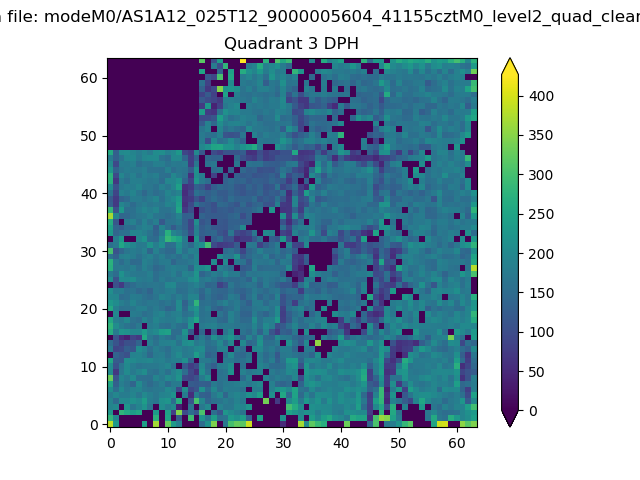 |
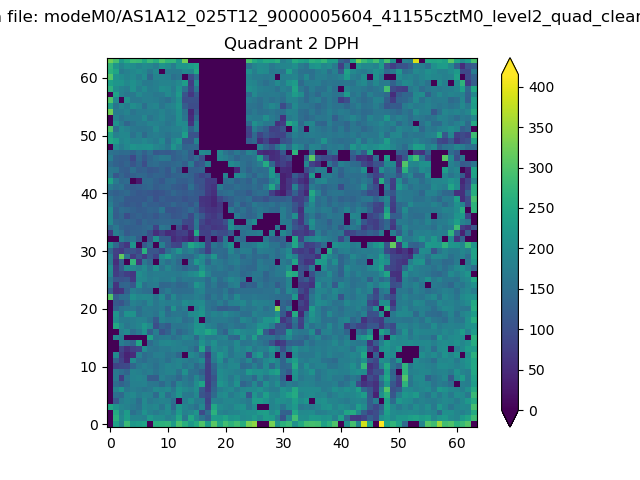 |
Quadrant C |
| Plot type | Count rate plots | Images |
|---|---|---|
| Comparison with Poisson distribution Blue bars denote a histogram of data divided into 1 sec bins. Red curve is a Poisson curve with rate = median count rate of data. |
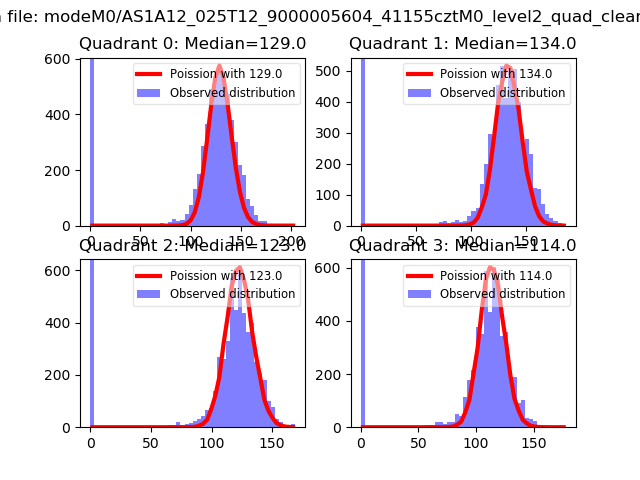 |
 |
| Quadrant-wise count rates Data is divided into 100 sec bins |
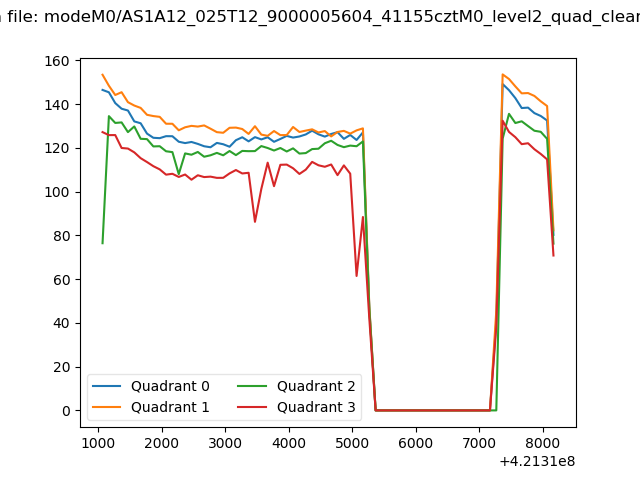 |
|
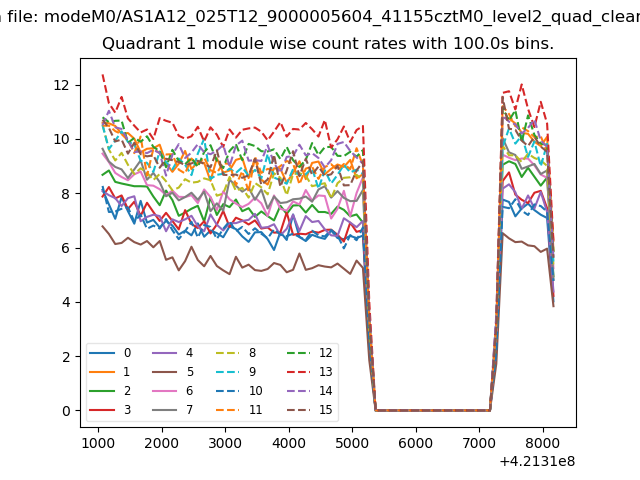
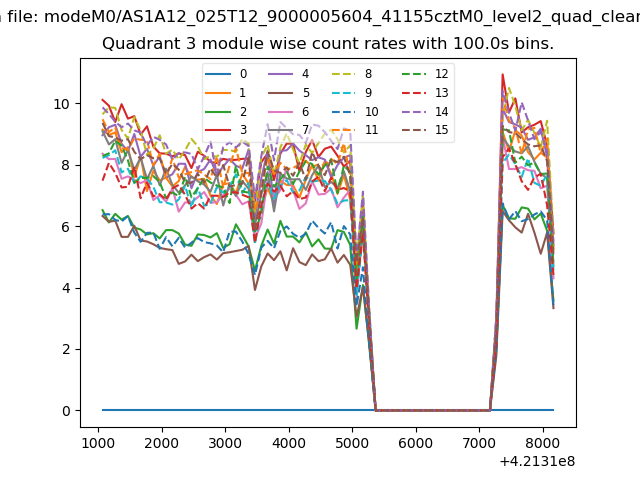
| Module-wise count rates for Quadrant A Data is divided into 100 sec bins |
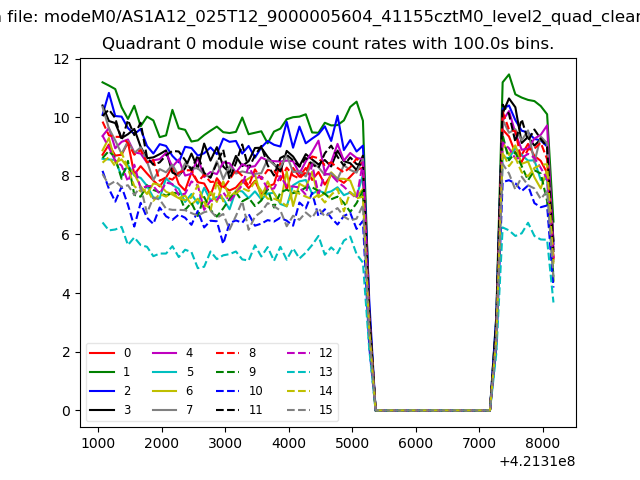 |
 |
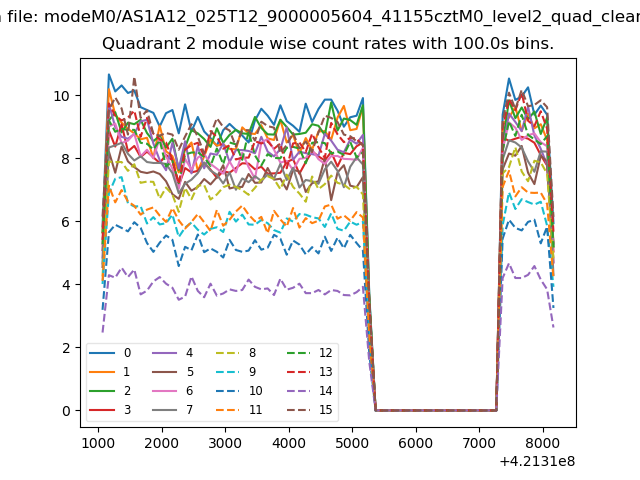
| Module-wise count rates for Quadrant B Data is divided into 100 sec bins |
 |
 |
| Module-wise count rates for Quadrant C Data is divided into 100 sec bins |
 |
 |
| Module-wise count rates for Quadrant D Data is divided into 100 sec bins |
 |
 |
| Parameter | Plot |
|---|---|
| CZT HV Monitor | 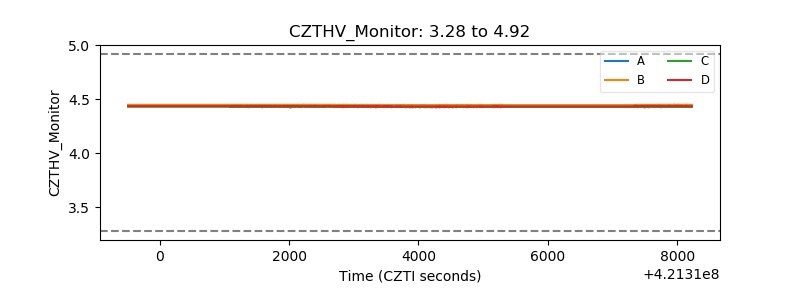 |
| D_VDD | 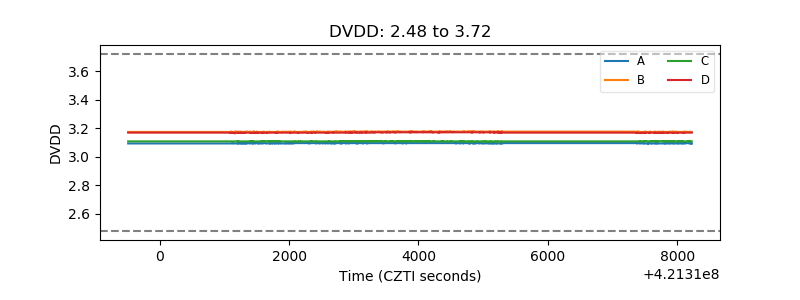 |
| Temperature 1 | 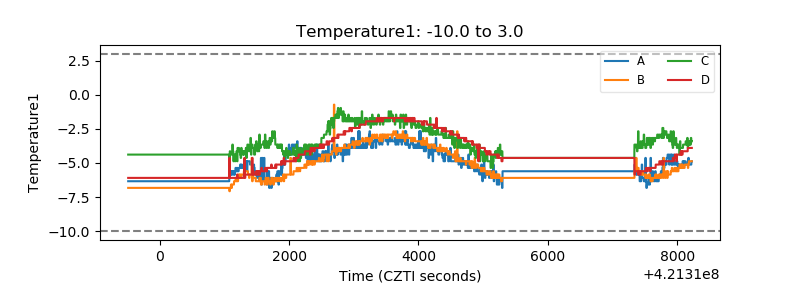 |
| Veto HV Monitor | 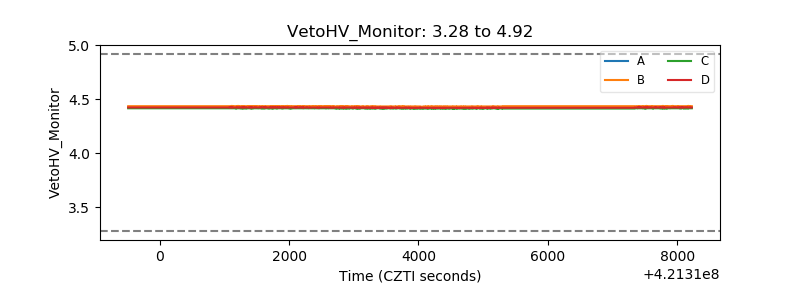 |
| Veto LLD | 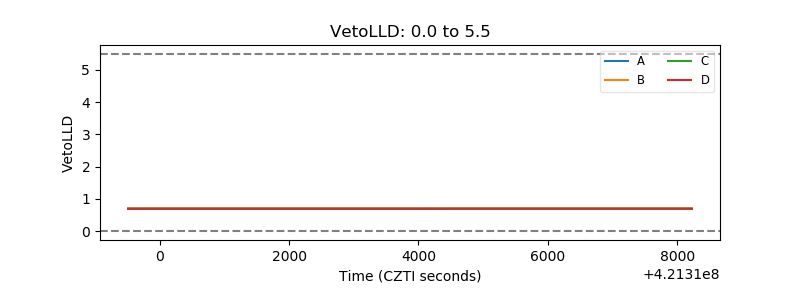 |
| Alpha Counter |  |
| _CPM_Rate | 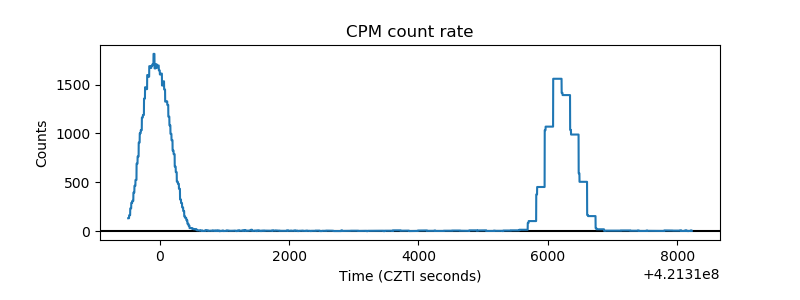 |
| CZT Counter | 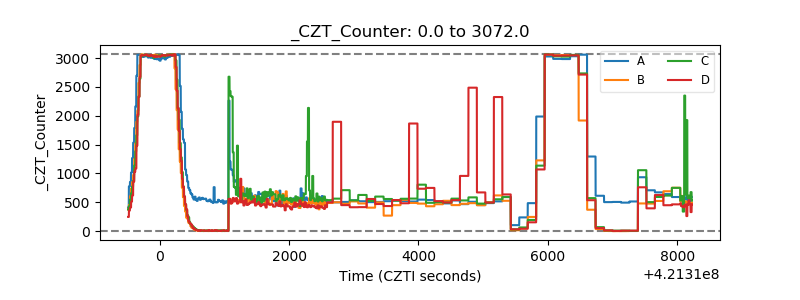 |
| +2.5 Volts monitor | 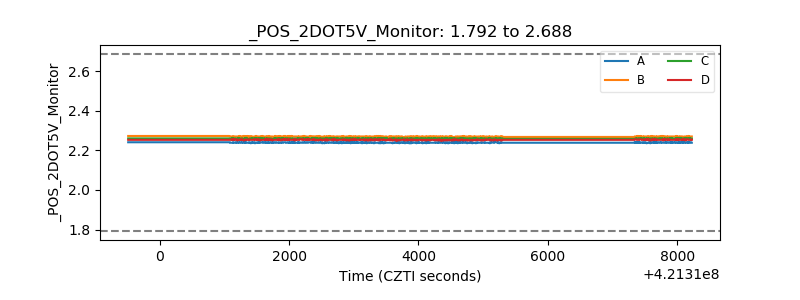 |
| +5 Volts monitor | 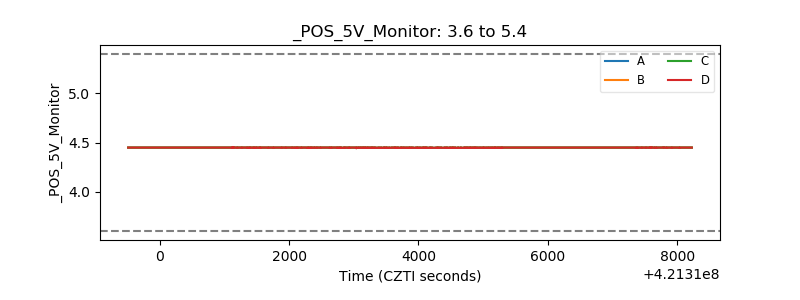 |
| _ROLL_ROT | 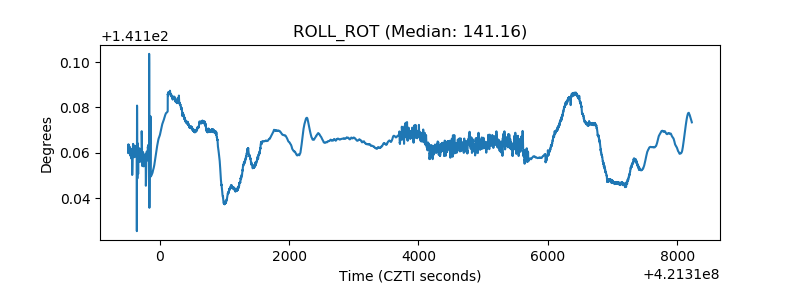 |
| _Roll_DEC | 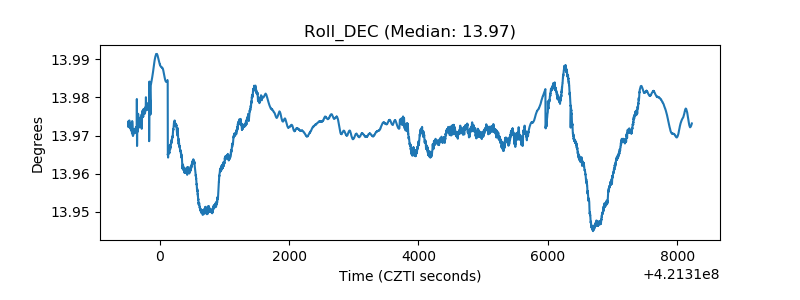 |
| _Roll_RA | 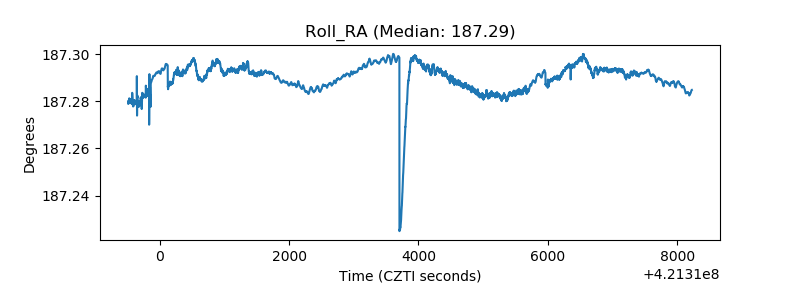 |
| Veto Counter | 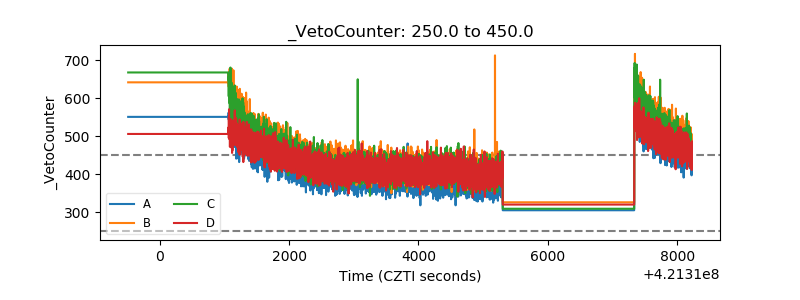 |