| Param | Original file | Final file |
|---|---|---|
| Filename | modeM0/AS1A12_025T12_9000005604_41156cztM0_level2.fits | modeM0/AS1A12_025T12_9000005604_41156cztM0_level2_quad_clean.evt |
| Size (bytes) | 186,246,720 | 54,362,880 |
| Size | 177.6 MB | 51.8 MB |
| Events in quadrant A | 1,647,929 | 376,252 |
| Events in quadrant B | 1,484,085 | 388,655 |
| Events in quadrant C | 1,838,831 | 350,848 |
| Events in quadrant D | 1,698,080 | 326,117 |
| Mode M9 | |||
|---|---|---|---|
| Quadrant | BADHDUFLAG | Total packets | Discarded packets |
| A | 0 | 12 | 0 |
| B | 0 | 12 | 0 |
| C | 0 | 12 | 0 |
| D | 0 | 13 | 0 |
| Mode SS | |||
|---|---|---|---|
| Quadrant | BADHDUFLAG | Total packets | Discarded packets |
| A | 0 | 56 | 0 |
| B | 0 | 56 | 0 |
| C | 0 | 56 | 0 |
| D | 0 | 56 | 0 |
| Mode M0 | |||
|---|---|---|---|
| Quadrant | BADHDUFLAG | Total packets | Discarded packets |
| A | 0 | 6499 | 1 |
| B | 0 | 6045 | 1 |
| C | 0 | 7161 | 1 |
| D | 0 | 6808 | 1 |
| Quadrant | Total seconds | Saturated seconds | Saturation percentage |
|---|---|---|---|
| A | 2871 | 5 | 0.174155% |
| B | 2871 | 10 | 0.348311% |
| C | 2871 | 58 | 2.020202% |
| D | 2871 | 75 | 2.612330% |
Noise dominated data is calculated using 1-second bins in cleaned event files. If a bin has >2000 counts, and if more than 50% of those come from <1% of pixels, then it is considered to be noise-dominated and hence unusable.
| Quadrant | # 1 sec bins | Bins with >0 counts | Bins with >2000 counts | High rate bins dominated by noise | Noise dominated (total time) | Noise dominated (detector-on time) | Marked lightcurve |
|---|---|---|---|---|---|---|---|
| A | 2871 | 2871 | 1 | 1 | 0.03% | 0.03% | 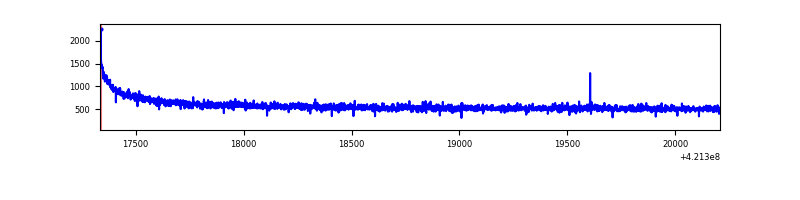 |
| B | 2871 | 2871 | 5 | 5 | 0.17% | 0.17% | 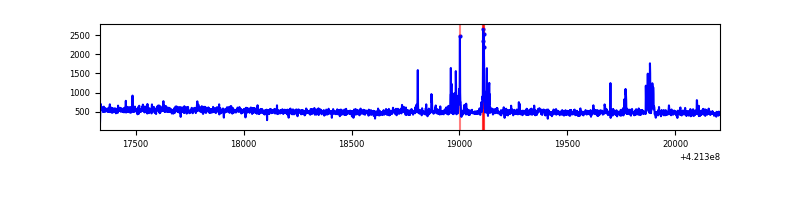 |
| C | 2871 | 2871 | 56 | 56 | 1.95% | 1.95% | 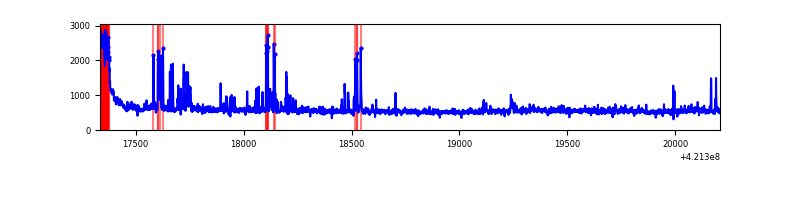 |
| D | 2871 | 2871 | 64 | 64 | 2.23% | 2.23% | 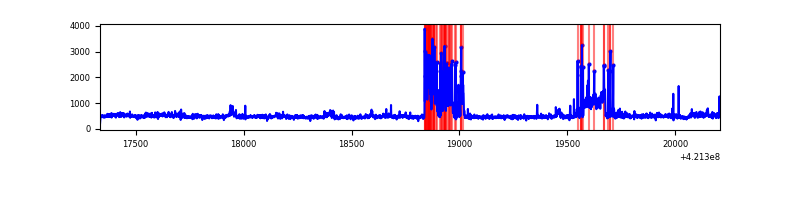 |
Top three noisy pixels from each quadrant. If the there are fewer than three noisy pixels in the level2.evt file, extra rows are filled as -1
| Pixel properties | Quadrant properties | ||||||
|---|---|---|---|---|---|---|---|
| Quadrant | DetID | PixID | Counts | Sigma | Mean | Median | Sigma |
| A | 10 | 83 | 263800 | 3590.87 | 357 | 352 | 73.4 |
| A | 13 | 254 | 4673 | 58.9 | 357 | 352 | 73.4 |
| A | 3 | 137 | 3840 | 47.54 | 357 | 352 | 73.4 |
| B | 0 | 245 | 45724 | 665.3 | 350 | 343 | 68.2 |
| B | 5 | 255 | 30988 | 449.26 | 350 | 343 | 68.2 |
| B | 0 | 190 | 28389 | 411.16 | 350 | 343 | 68.2 |
| C | 9 | 54 | 276768 | 3529.56 | 338 | 341 | 78.3 |
| C | 15 | 214 | 123731 | 1575.5 | 338 | 341 | 78.3 |
| C | 0 | 10 | 111695 | 1421.82 | 338 | 341 | 78.3 |
| D | 2 | 249 | 236447 | 2800.11 | 343 | 334 | 84.3 |
| D | 2 | 16 | 116000 | 1371.7 | 343 | 334 | 84.3 |
| D | 13 | 249 | 38480 | 452.38 | 343 | 334 | 84.3 |
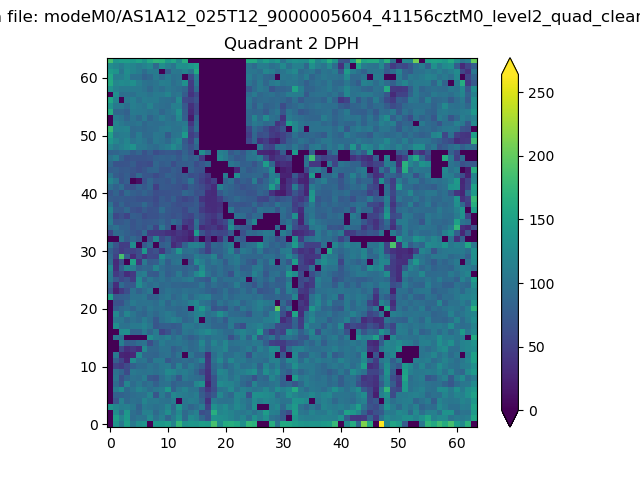
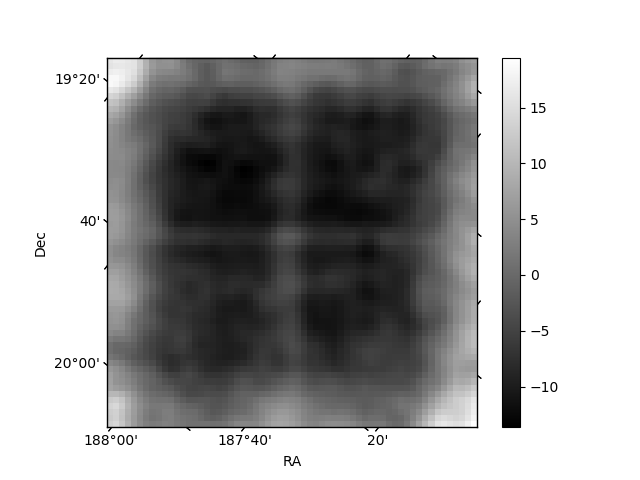
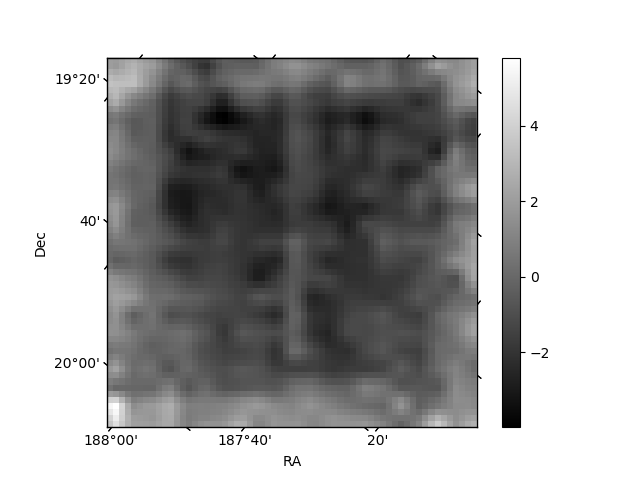
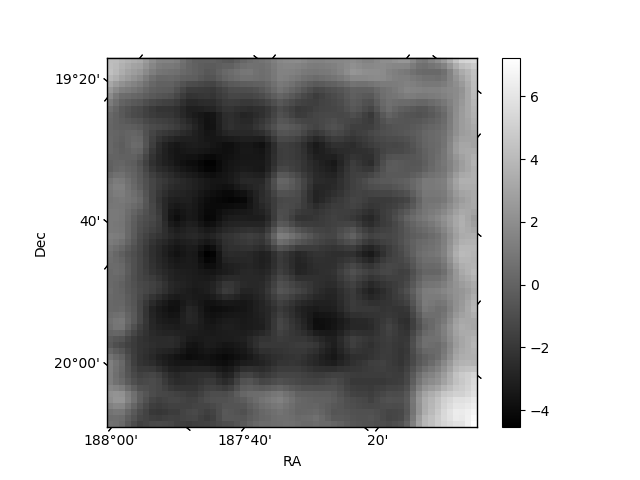
Histogram calculated using DETX and DETY for each event in the final _common_clean file
| Quadrant A | 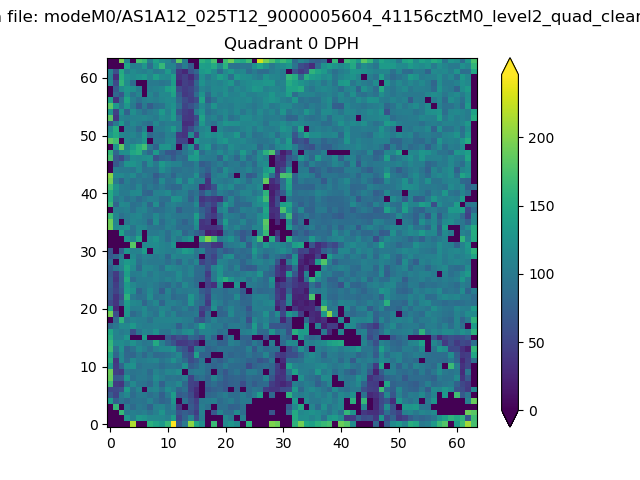 |
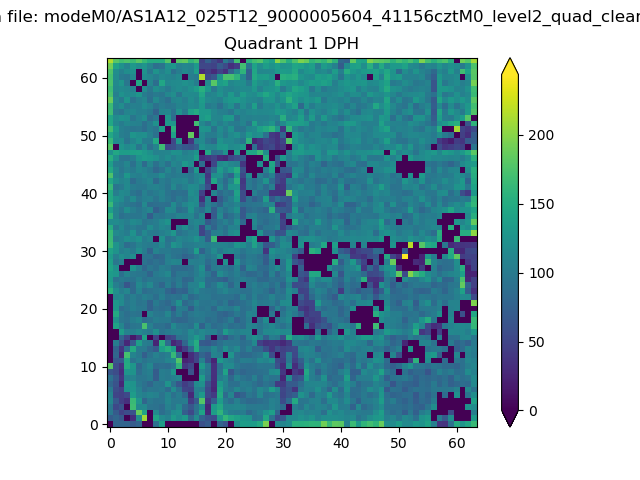 |
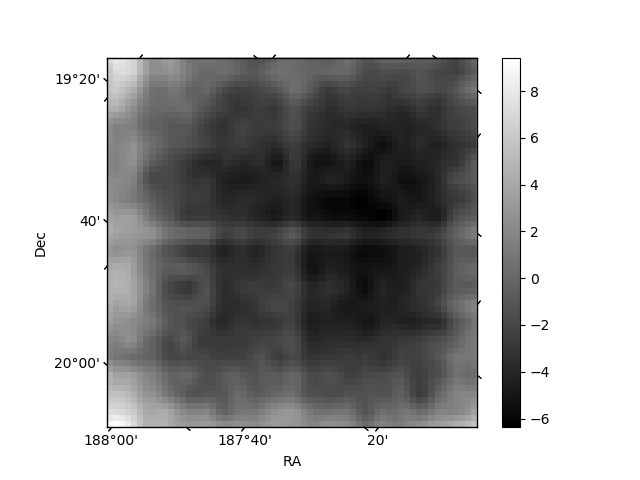
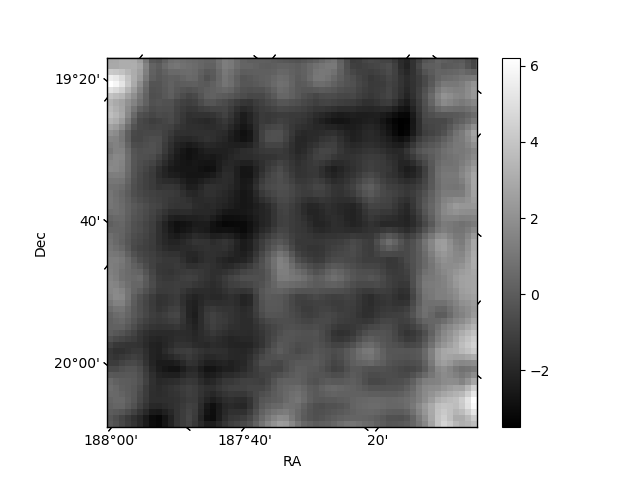
Quadrant B |
|---|---|---|---|
| Quadrant D | 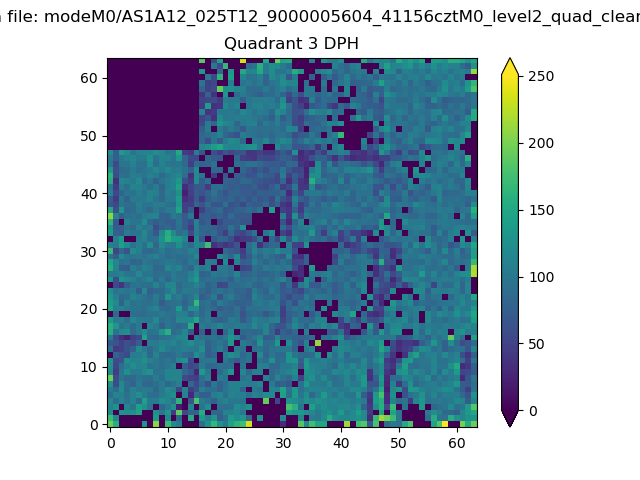 |
 |
Quadrant C |
| Plot type | Count rate plots | Images |
|---|---|---|
| Comparison with Poisson distribution Blue bars denote a histogram of data divided into 1 sec bins. Red curve is a Poisson curve with rate = median count rate of data. |
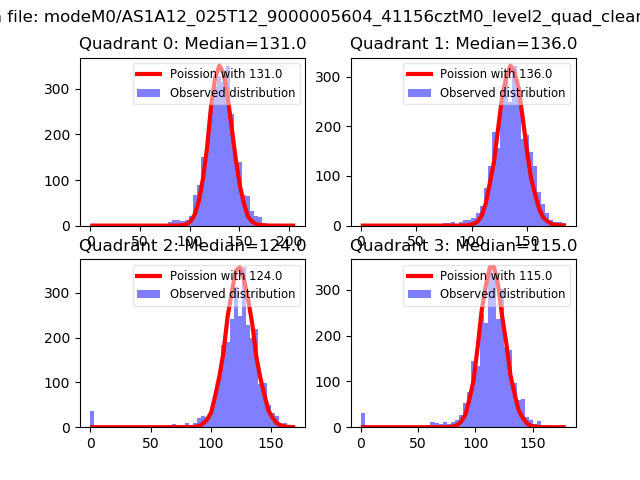 |
 |
| Quadrant-wise count rates Data is divided into 100 sec bins |
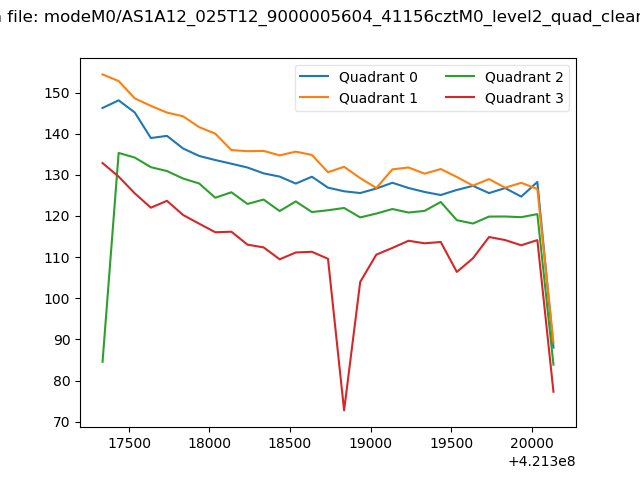 |
|
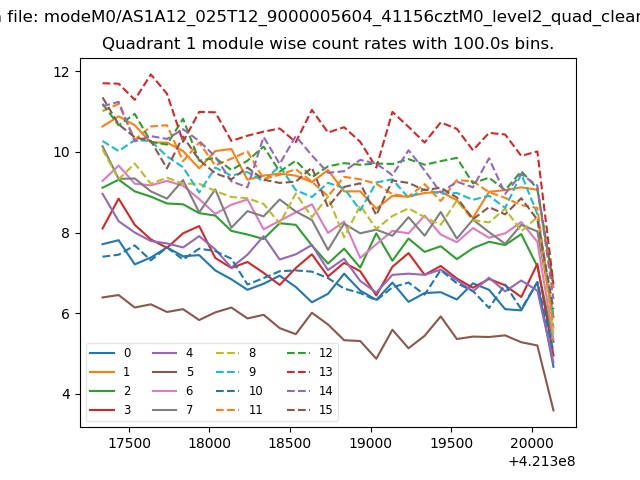
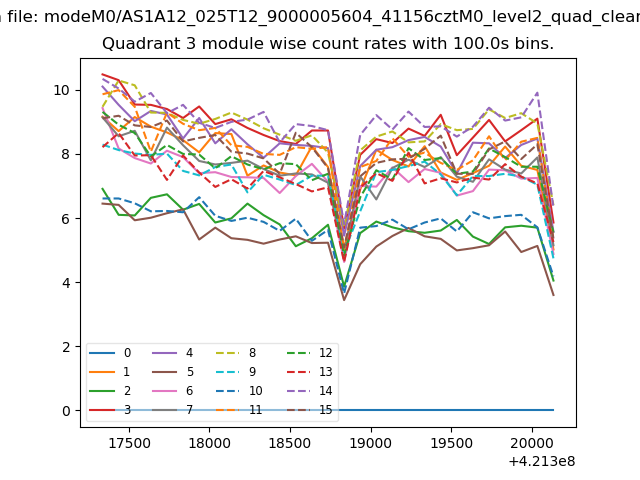
| Module-wise count rates for Quadrant A Data is divided into 100 sec bins |
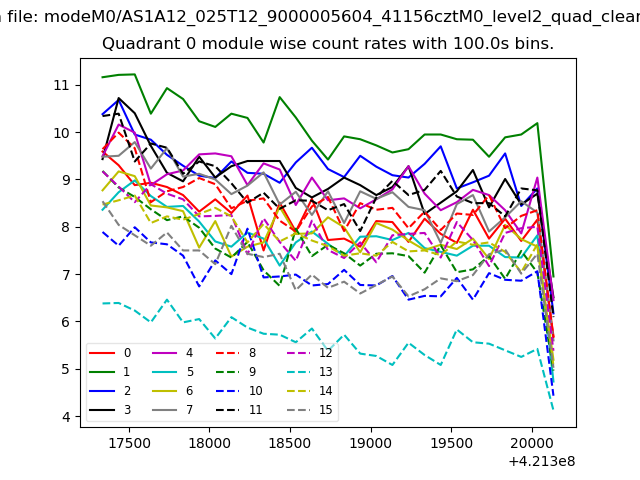 |
 |
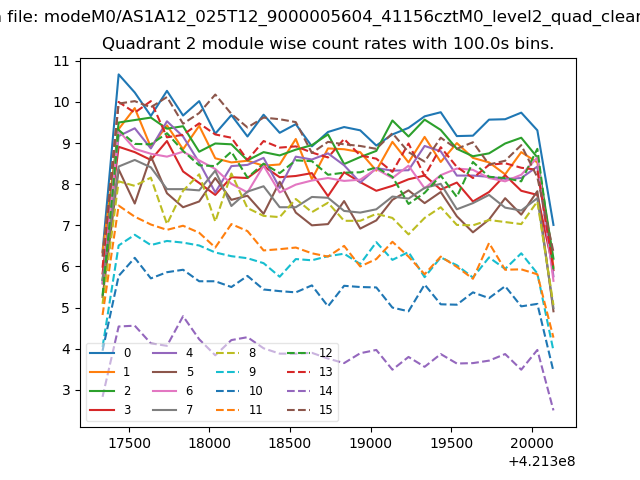
| Module-wise count rates for Quadrant B Data is divided into 100 sec bins |
 |
 |
| Module-wise count rates for Quadrant C Data is divided into 100 sec bins |
 |
 |
| Module-wise count rates for Quadrant D Data is divided into 100 sec bins |
 |
 |
| Parameter | Plot |
|---|---|
| CZT HV Monitor | 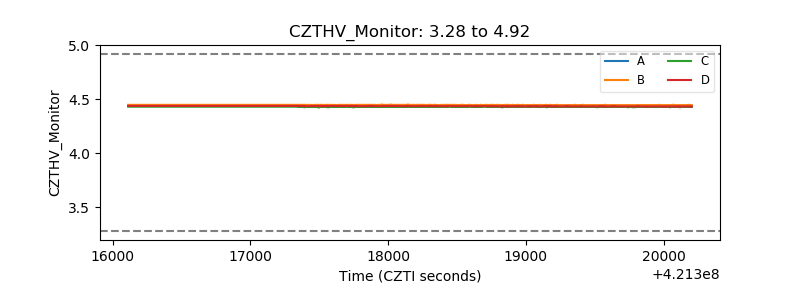 |
| D_VDD | 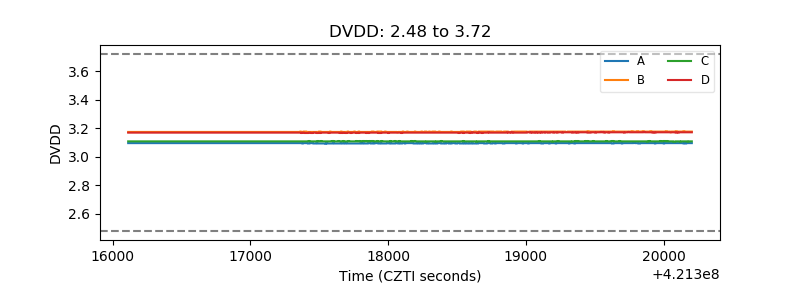 |
| Temperature 1 | 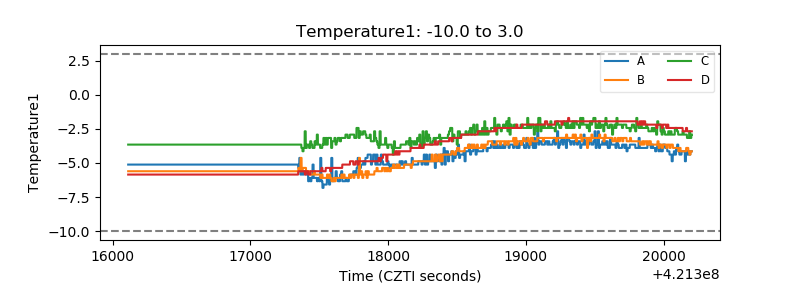 |
| Veto HV Monitor | 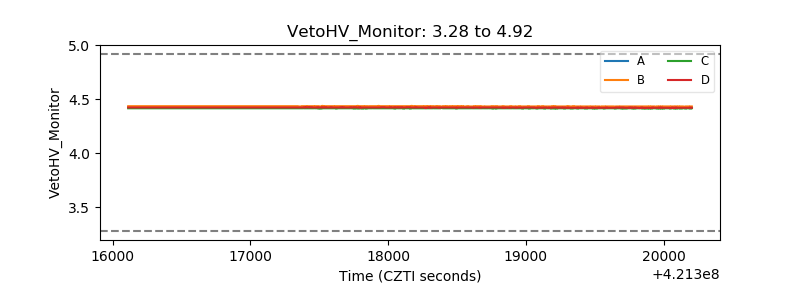 |
| Veto LLD | 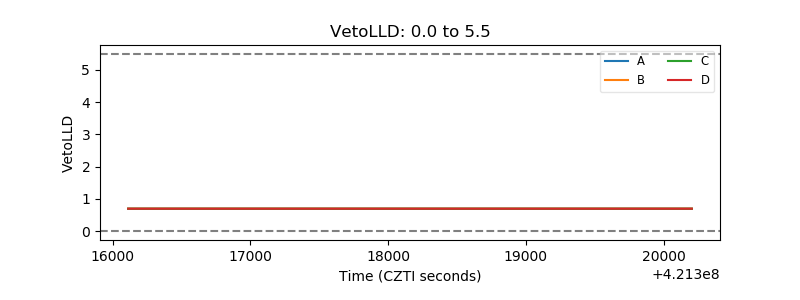 |
| Alpha Counter | 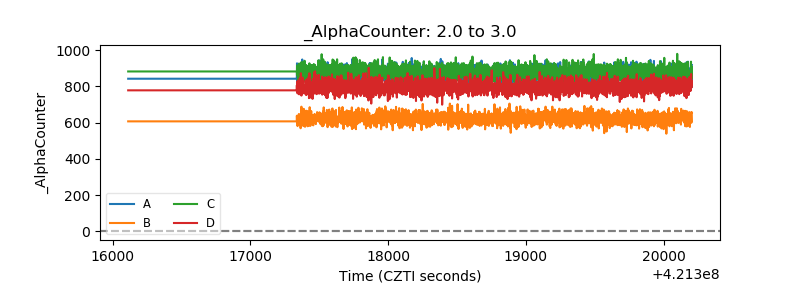 |
| _CPM_Rate | 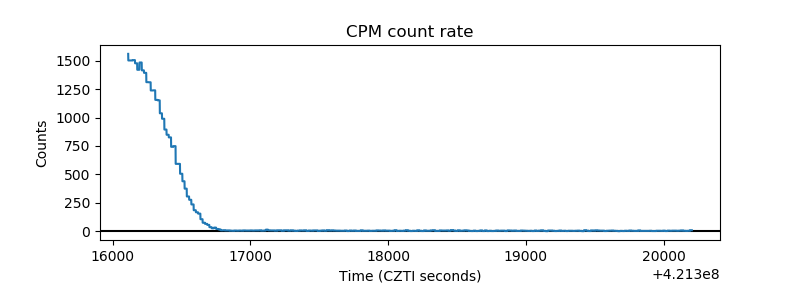 |
| CZT Counter | 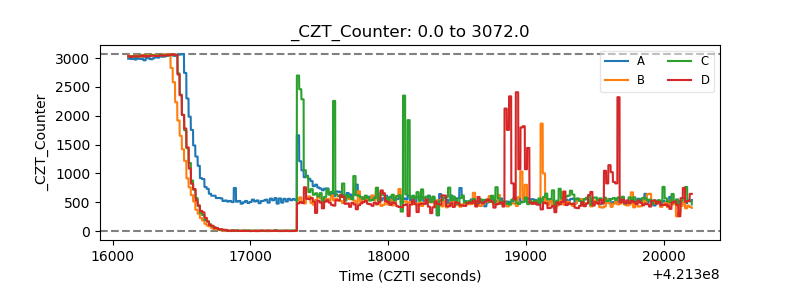 |
| +2.5 Volts monitor | 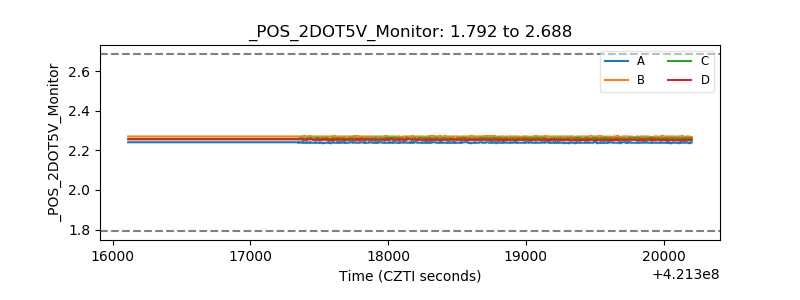 |
| +5 Volts monitor | 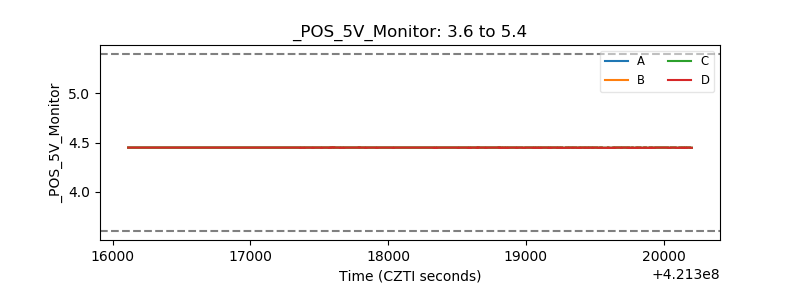 |
| _ROLL_ROT | 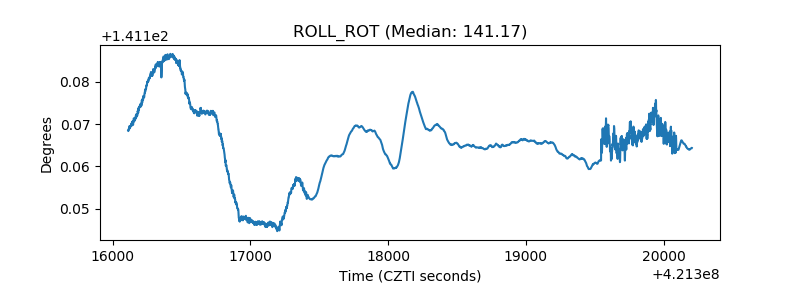 |
| _Roll_DEC | 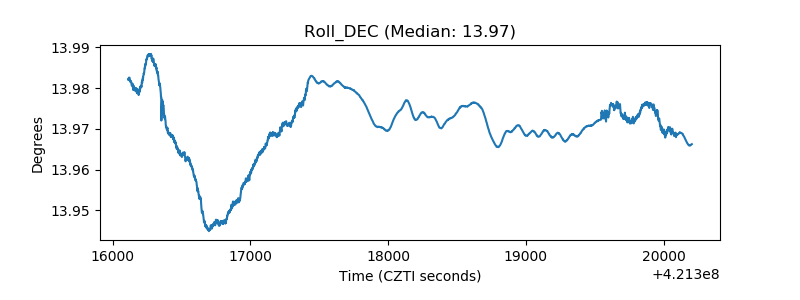 |
| _Roll_RA | 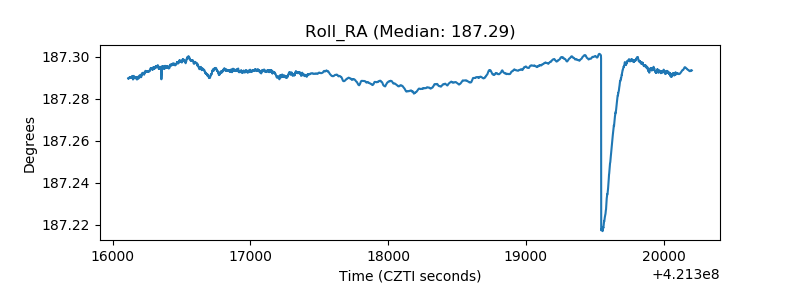 |
| Veto Counter | 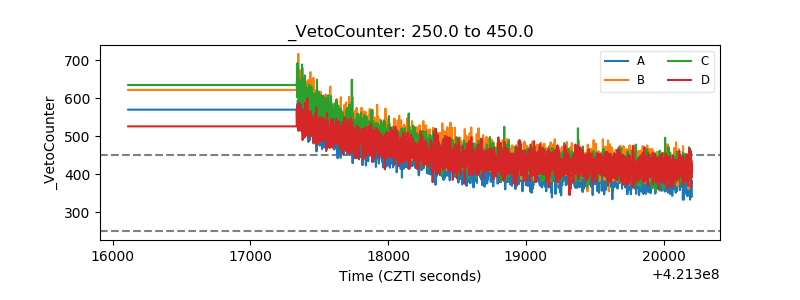 |