| Param | Original file | Final file |
|---|---|---|
| Filename | modeM0/AS1A12_025T14_9000005606_41156cztM0_level2.fits | modeM0/AS1A12_025T14_9000005606_41156cztM0_level2_quad_clean.evt |
| Size (bytes) | 107,565,120 | 32,083,200 |
| Size | 102.6 MB | 30.6 MB |
| Events in quadrant A | 1,015,510 | 220,373 |
| Events in quadrant B | 850,883 | 226,771 |
| Events in quadrant C | 1,046,000 | 205,459 |
| Events in quadrant D | 934,149 | 194,197 |
| Mode M0 | |||
|---|---|---|---|
| Quadrant | BADHDUFLAG | Total packets | Discarded packets |
| A | 0 | 4101 | 2 |
| B | 0 | 3480 | 1 |
| C | 0 | 4115 | 1 |
| D | 0 | 3777 | 1 |
| Mode SS | |||
|---|---|---|---|
| Quadrant | BADHDUFLAG | Total packets | Discarded packets |
| A | 0 | 36 | 0 |
| B | 0 | 36 | 0 |
| C | 0 | 36 | 0 |
| D | 0 | 36 | 0 |
| Mode M9 | |||
|---|---|---|---|
| Quadrant | BADHDUFLAG | Total packets | Discarded packets |
| A | 0 | 21 | 0 |
| B | 0 | 21 | 0 |
| C | 0 | 21 | 0 |
| D | 0 | 21 | 0 |
| Quadrant | Total seconds | Saturated seconds | Saturation percentage |
|---|---|---|---|
| A | 1701 | 6 | 0.352734% |
| B | 1701 | 1 | 0.058789% |
| C | 1701 | 38 | 2.233980% |
| D | 1701 | 17 | 0.999412% |
Noise dominated data is calculated using 1-second bins in cleaned event files. If a bin has >2000 counts, and if more than 50% of those come from <1% of pixels, then it is considered to be noise-dominated and hence unusable.
| Quadrant | # 1 sec bins | Bins with >0 counts | Bins with >2000 counts | High rate bins dominated by noise | Noise dominated (total time) | Noise dominated (detector-on time) | Marked lightcurve |
|---|---|---|---|---|---|---|---|
| A | 3824 | 1702 | 1 | 1 | 0.03% | 0.06% | 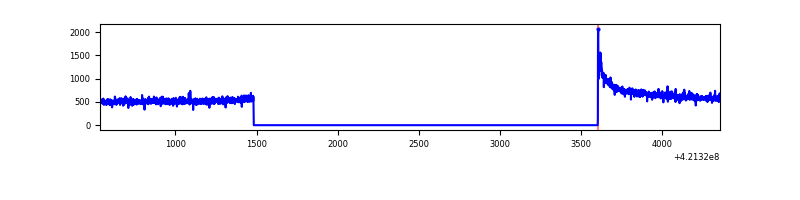 |
| B | 3824 | 1702 | 0 | 0 | 0.00% | 0.00% | 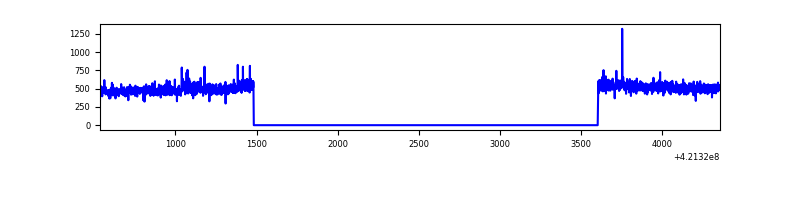 |
| C | 3824 | 1702 | 35 | 35 | 0.92% | 2.06% | 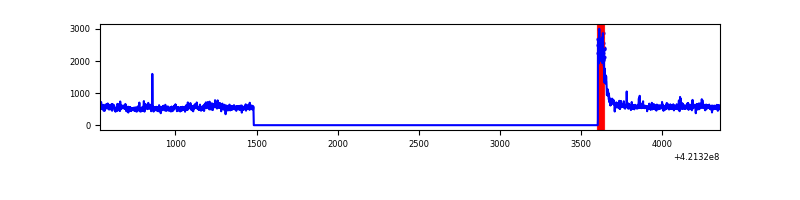 |
| D | 3824 | 1702 | 10 | 10 | 0.26% | 0.59% | 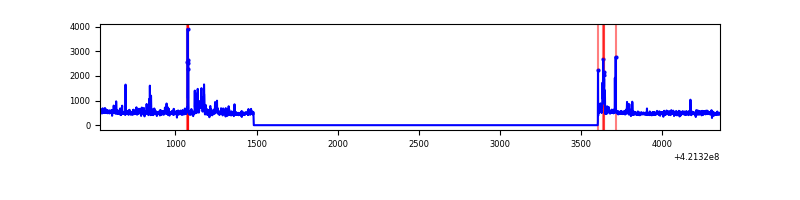 |
Top three noisy pixels from each quadrant. If the there are fewer than three noisy pixels in the level2.evt file, extra rows are filled as -1
| Pixel properties | Quadrant properties | ||||||
|---|---|---|---|---|---|---|---|
| Quadrant | DetID | PixID | Counts | Sigma | Mean | Median | Sigma |
| A | 10 | 83 | 192188 | 4276.18 | 211 | 207 | 44.9 |
| A | 13 | 254 | 3042 | 63.15 | 211 | 207 | 44.9 |
| A | 15 | 254 | 2352 | 47.78 | 211 | 207 | 44.9 |
| B | 0 | 190 | 14709 | 340.38 | 209 | 204 | 42.6 |
| B | 0 | 245 | 10359 | 238.3 | 209 | 204 | 42.6 |
| B | 12 | 111 | 4987 | 112.24 | 209 | 204 | 42.6 |
| C | 0 | 10 | 93755 | 1952.64 | 201 | 202 | 47.9 |
| C | 9 | 54 | 87916 | 1830.77 | 201 | 202 | 47.9 |
| C | 15 | 214 | 76718 | 1597.04 | 201 | 202 | 47.9 |
| D | 2 | 16 | 65441 | 1277.65 | 202 | 196 | 51.1 |
| D | 2 | 153 | 28283 | 550.01 | 202 | 196 | 51.1 |
| D | 2 | 249 | 20846 | 404.37 | 202 | 196 | 51.1 |
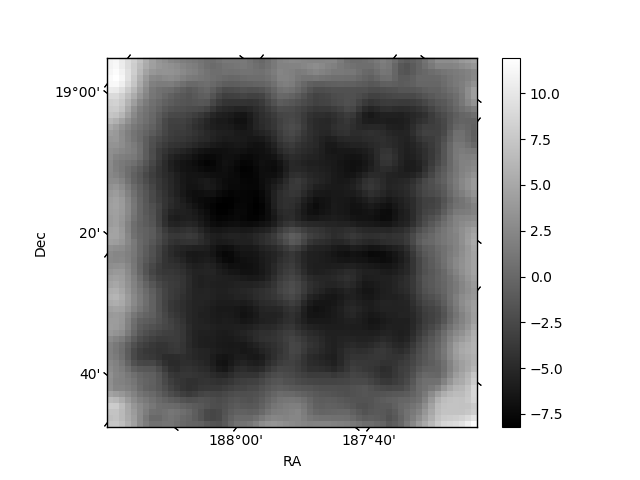
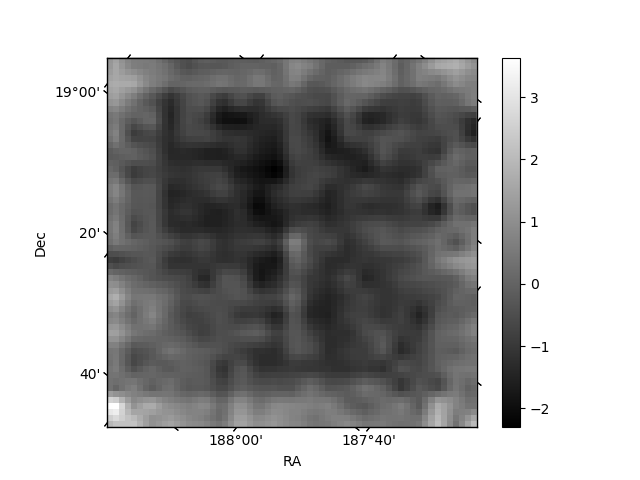
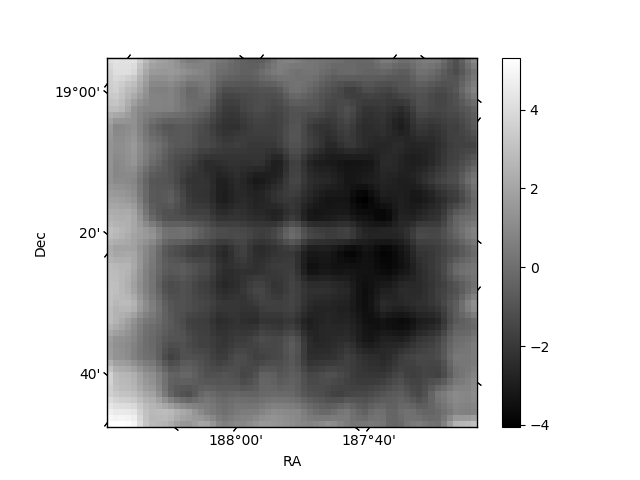
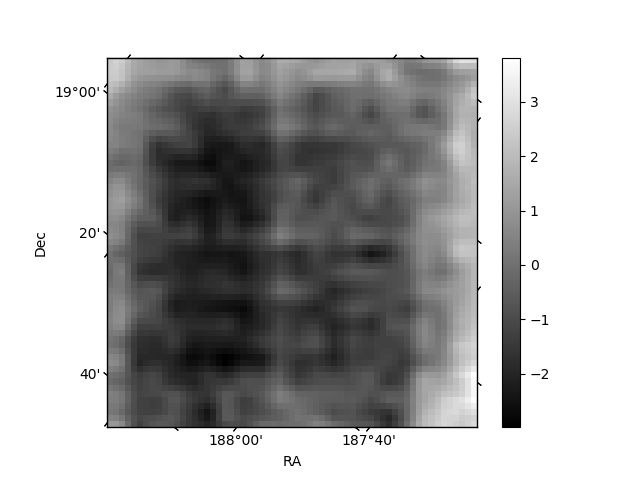
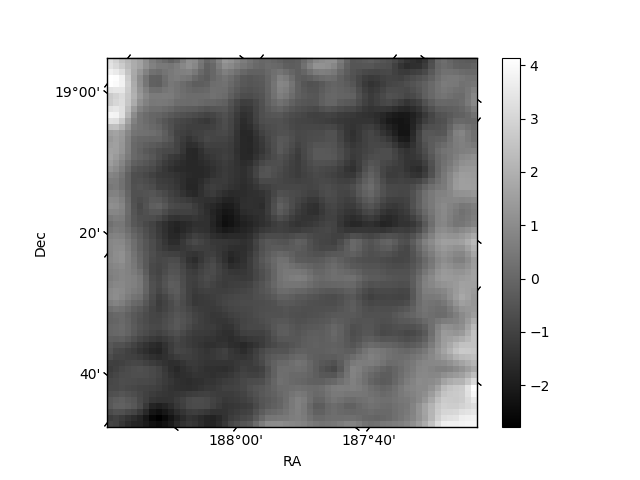
Histogram calculated using DETX and DETY for each event in the final _common_clean file
| Quadrant A | 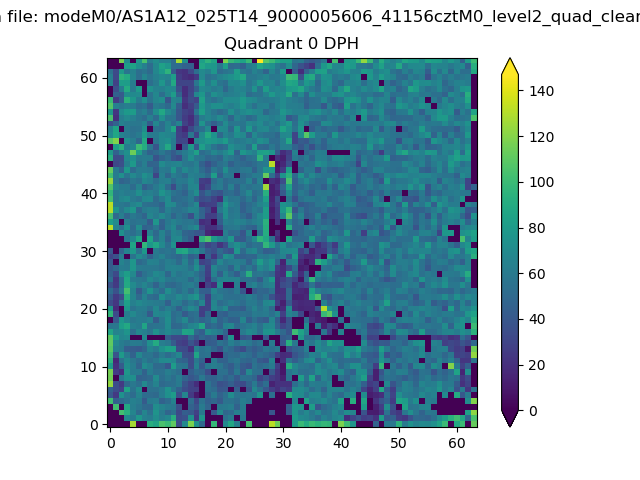 |
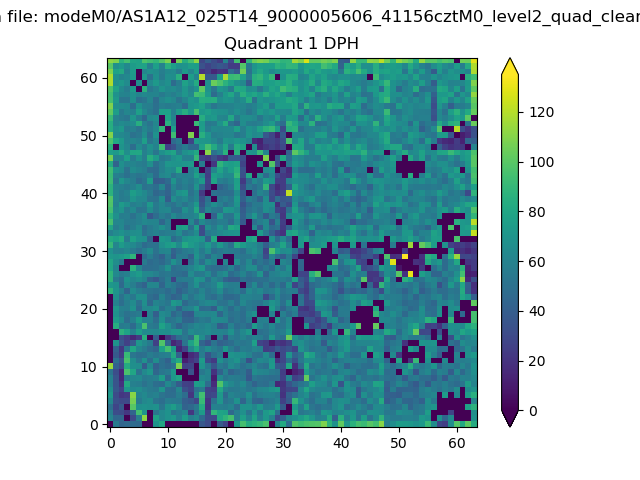 |
Quadrant B |
|---|---|---|---|
| Quadrant D | 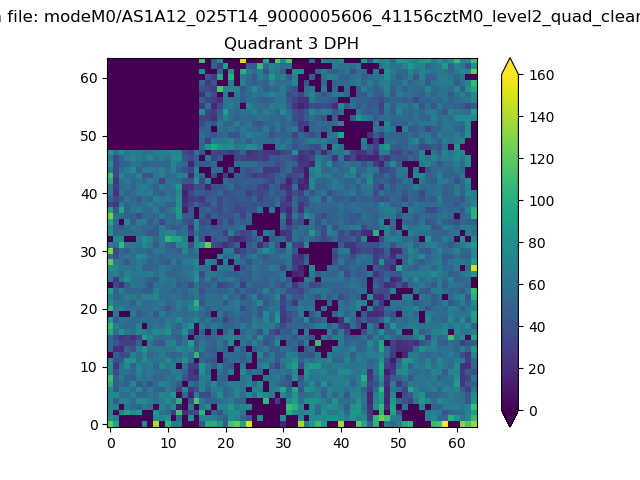 |
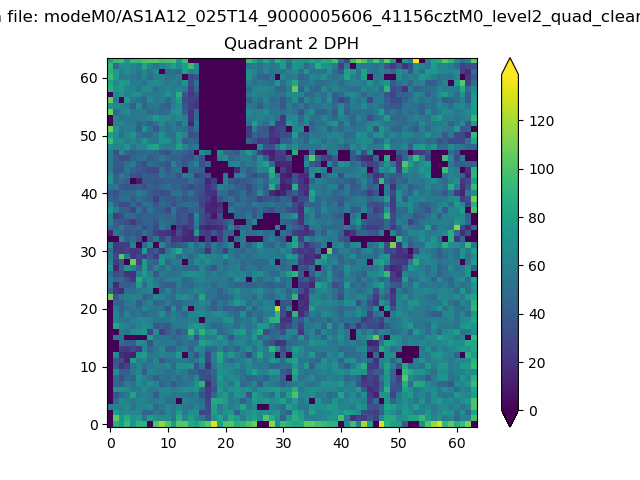 |
Quadrant C |
| Plot type | Count rate plots | Images |
|---|---|---|
| Comparison with Poisson distribution Blue bars denote a histogram of data divided into 1 sec bins. Red curve is a Poisson curve with rate = median count rate of data. |
 |
 |
| Quadrant-wise count rates Data is divided into 100 sec bins |
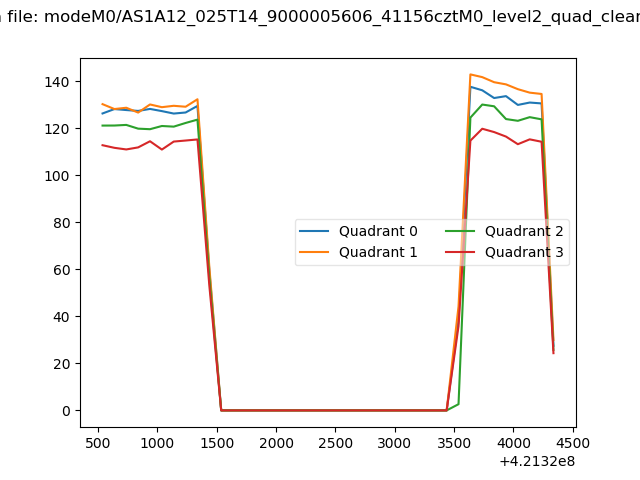 |
|
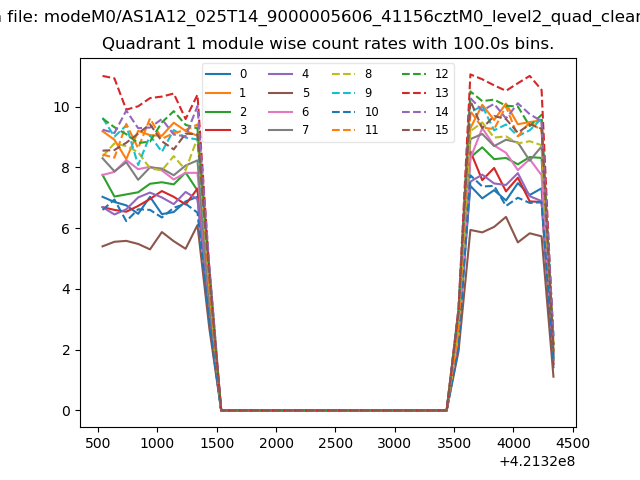
| Module-wise count rates for Quadrant A Data is divided into 100 sec bins |
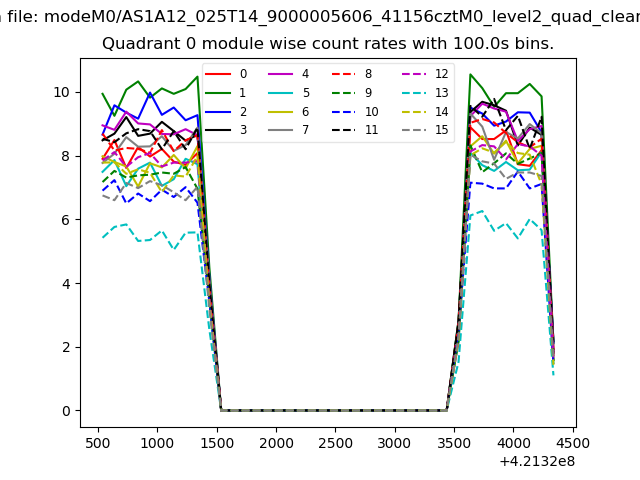 |
 |
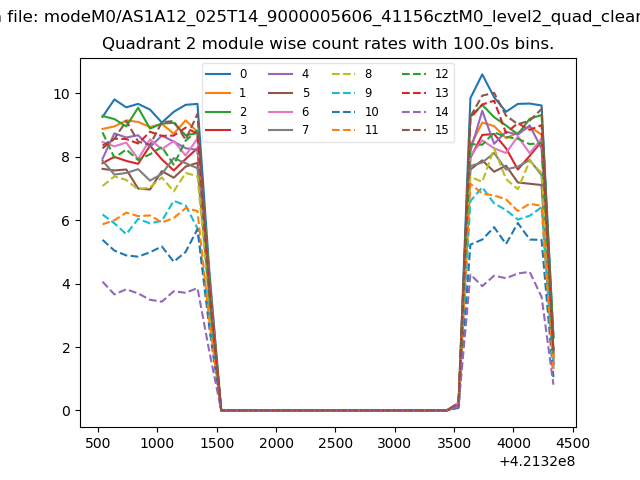
| Module-wise count rates for Quadrant B Data is divided into 100 sec bins |
 |
 |
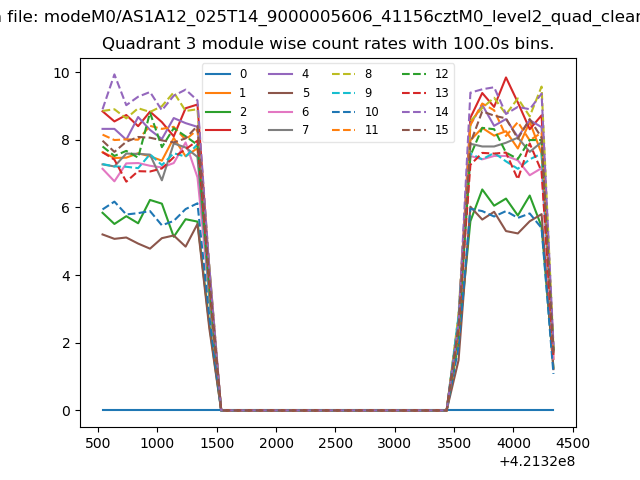
| Module-wise count rates for Quadrant C Data is divided into 100 sec bins |
 |
 |
| Module-wise count rates for Quadrant D Data is divided into 100 sec bins |
 |
 |
| Parameter | Plot |
|---|---|
| CZT HV Monitor | 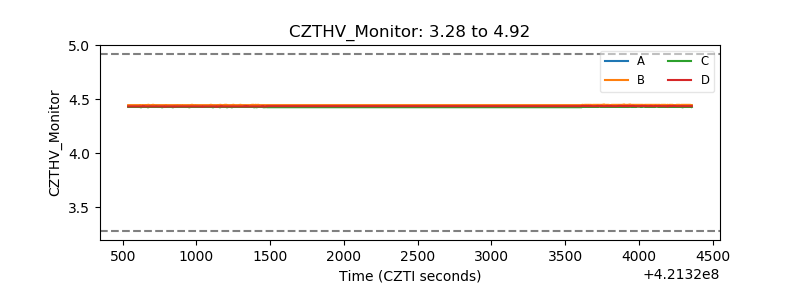 |
| D_VDD | 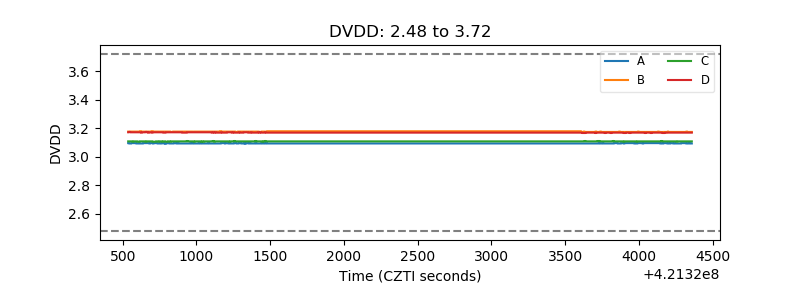 |
| Temperature 1 | 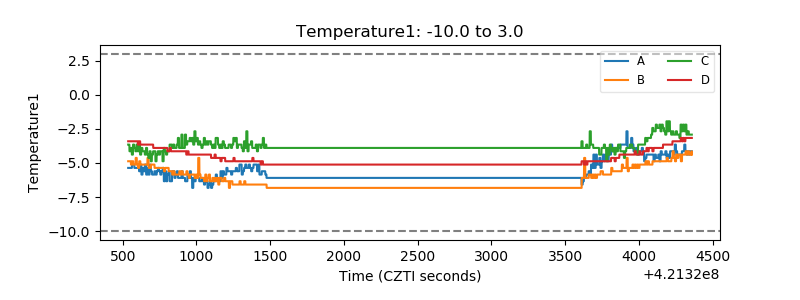 |
| Veto HV Monitor | 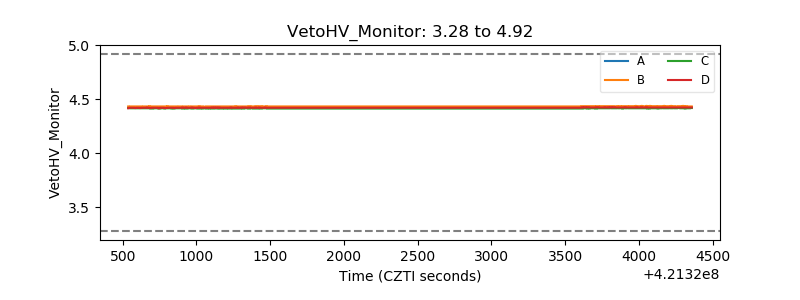 |
| Veto LLD | 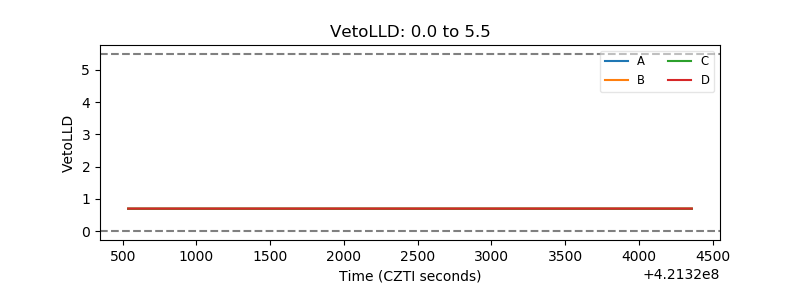 |
| Alpha Counter | 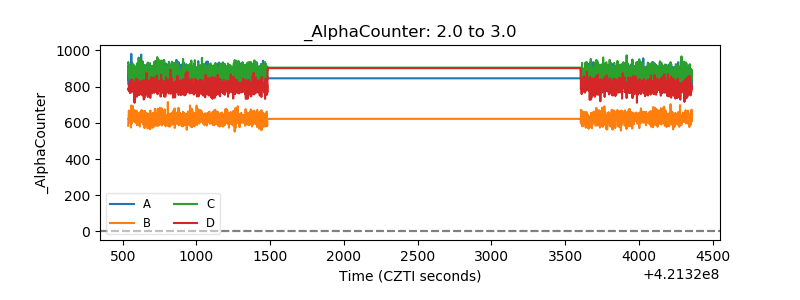 |
| _CPM_Rate | 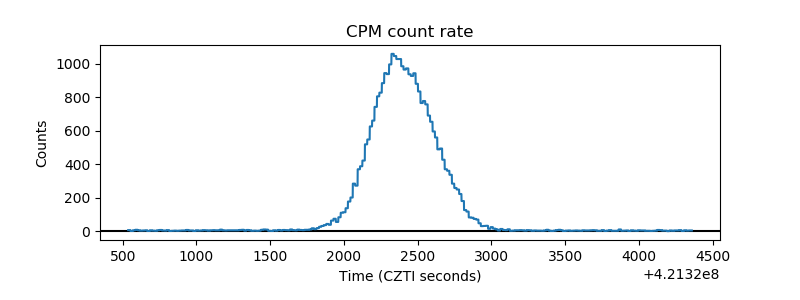 |
| CZT Counter | 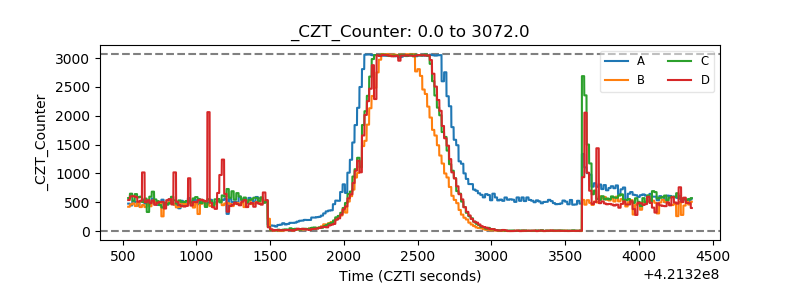 |
| +2.5 Volts monitor | 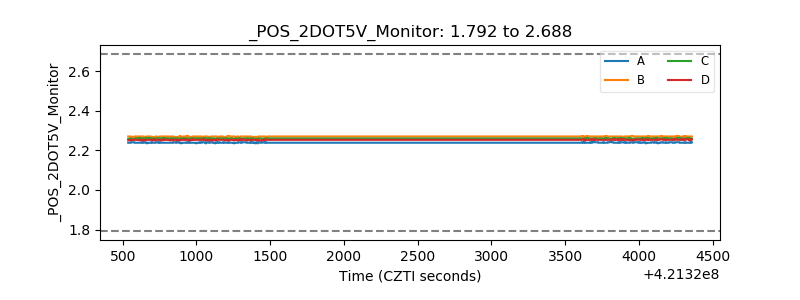 |
| +5 Volts monitor | 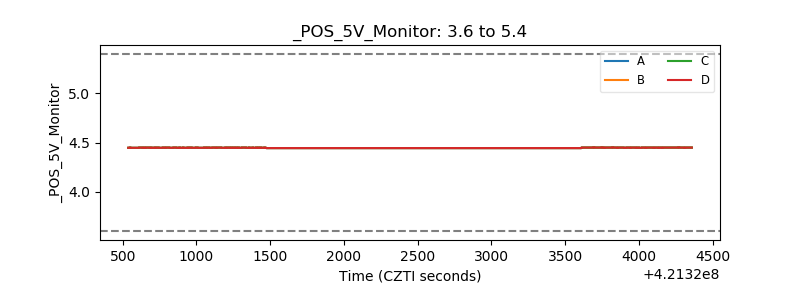 |
| _ROLL_ROT | 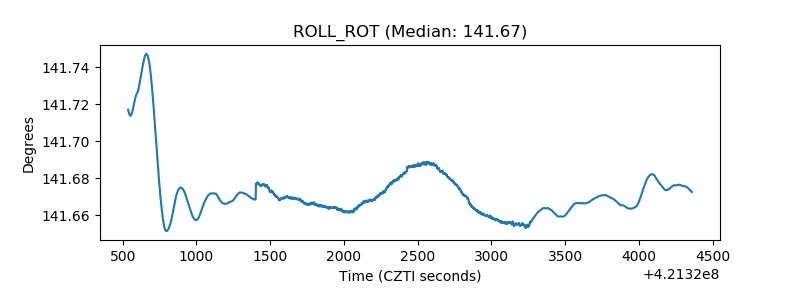 |
| _Roll_DEC | 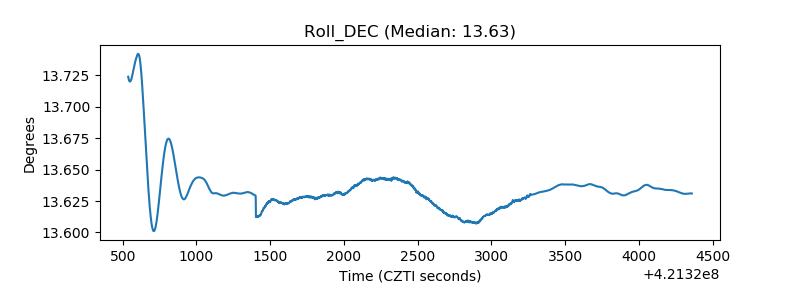 |
| _Roll_RA | 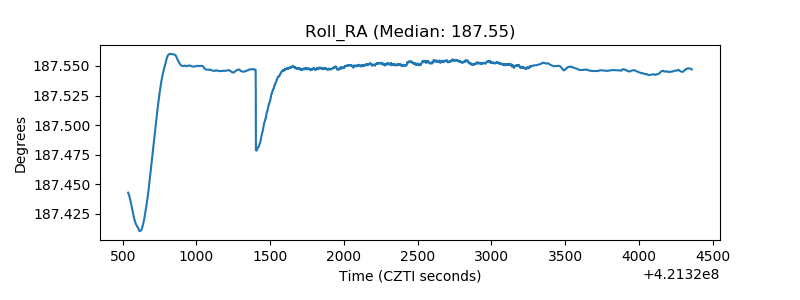 |
| Veto Counter | 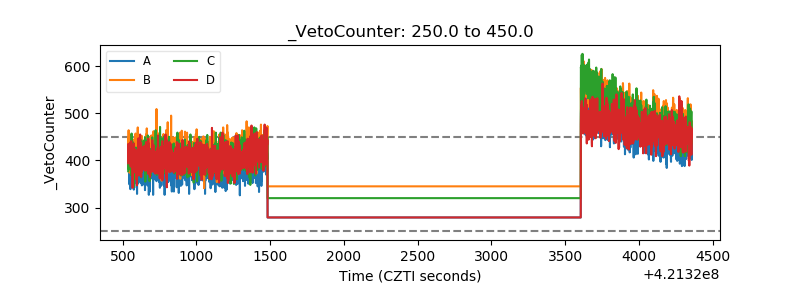 |