| Param | Original file | Final file |
|---|---|---|
| Filename | modeM0/AS1A12_025T14_9000005606_41157cztM0_level2.fits | modeM0/AS1A12_025T14_9000005606_41157cztM0_level2_quad_clean.evt |
| Size (bytes) | 315,296,640 | 90,192,960 |
| Size | 300.7 MB | 86.0 MB |
| Events in quadrant A | 2,803,497 | 621,167 |
| Events in quadrant B | 2,392,551 | 634,676 |
| Events in quadrant C | 2,838,573 | 582,974 |
| Events in quadrant D | 3,251,905 | 545,281 |
| Mode M0 | |||
|---|---|---|---|
| Quadrant | BADHDUFLAG | Total packets | Discarded packets |
| A | 0 | 11248 | 3 |
| B | 0 | 10047 | 2 |
| C | 0 | 11341 | 2 |
| D | 0 | 12918 | 2 |
| Mode SS | |||
|---|---|---|---|
| Quadrant | BADHDUFLAG | Total packets | Discarded packets |
| A | 0 | 106 | 0 |
| B | 0 | 106 | 0 |
| C | 0 | 106 | 0 |
| D | 0 | 106 | 0 |
| Mode M9 | |||
|---|---|---|---|
| Quadrant | BADHDUFLAG | Total packets | Discarded packets |
| A | 0 | 42 | 0 |
| B | 0 | 42 | 0 |
| C | 0 | 42 | 0 |
| D | 0 | 42 | 0 |
| Quadrant | Total seconds | Saturated seconds | Saturation percentage |
|---|---|---|---|
| A | 4940 | 10 | 0.202429% |
| B | 4940 | 10 | 0.202429% |
| C | 4940 | 82 | 1.659919% |
| D | 4940 | 43 | 0.870445% |
Noise dominated data is calculated using 1-second bins in cleaned event files. If a bin has >2000 counts, and if more than 50% of those come from <1% of pixels, then it is considered to be noise-dominated and hence unusable.
| Quadrant | # 1 sec bins | Bins with >0 counts | Bins with >2000 counts | High rate bins dominated by noise | Noise dominated (total time) | Noise dominated (detector-on time) | Marked lightcurve |
|---|---|---|---|---|---|---|---|
| A | 9216 | 4942 | 2 | 2 | 0.02% | 0.04% | 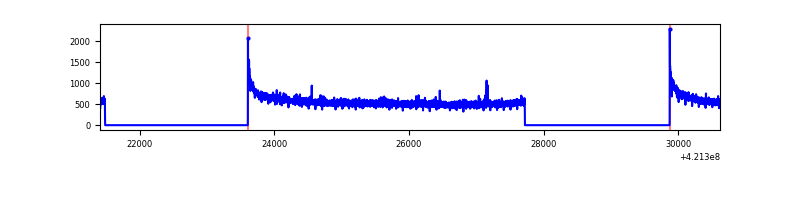 |
| B | 9216 | 4942 | 5 | 5 | 0.05% | 0.10% | 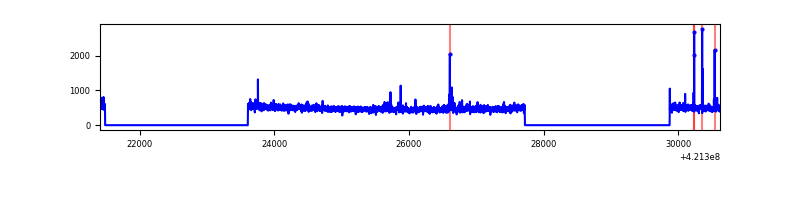 |
| C | 9216 | 4942 | 70 | 70 | 0.76% | 1.42% | 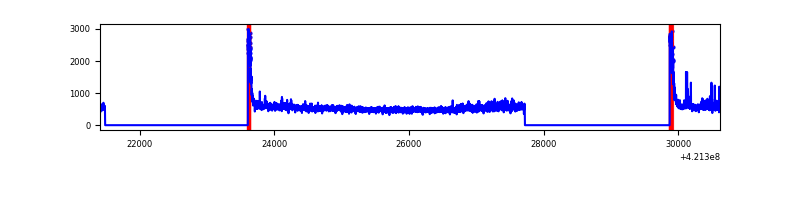 |
| D | 9216 | 4942 | 24 | 24 | 0.26% | 0.49% | 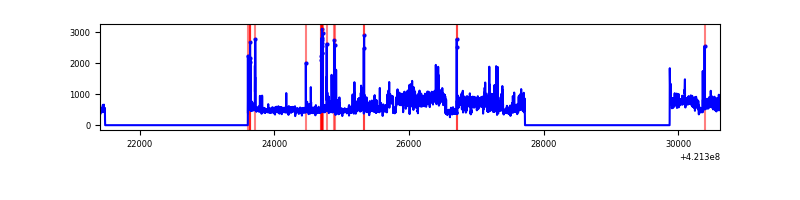 |
Top three noisy pixels from each quadrant. If the there are fewer than three noisy pixels in the level2.evt file, extra rows are filled as -1
| Pixel properties | Quadrant properties | ||||||
|---|---|---|---|---|---|---|---|
| Quadrant | DetID | PixID | Counts | Sigma | Mean | Median | Sigma |
| A | 10 | 83 | 487900 | 4026.92 | 593 | 582 | 121.0 |
| A | 13 | 254 | 8736 | 67.38 | 593 | 582 | 121.0 |
| A | 12 | 189 | 7893 | 60.41 | 593 | 582 | 121.0 |
| B | 0 | 245 | 73749 | 647.51 | 583 | 568 | 113.0 |
| B | 7 | 202 | 14258 | 121.13 | 583 | 568 | 113.0 |
| B | 12 | 111 | 14122 | 119.93 | 583 | 568 | 113.0 |
| C | 0 | 10 | 220928 | 1663.98 | 568 | 572 | 132.4 |
| C | 15 | 214 | 216527 | 1630.75 | 568 | 572 | 132.4 |
| C | 9 | 54 | 181171 | 1363.77 | 568 | 572 | 132.4 |
| D | 2 | 16 | 820401 | 5838.73 | 572 | 556 | 140.4 |
| D | 2 | 249 | 119397 | 846.36 | 572 | 556 | 140.4 |
| D | 13 | 249 | 57281 | 403.98 | 572 | 556 | 140.4 |
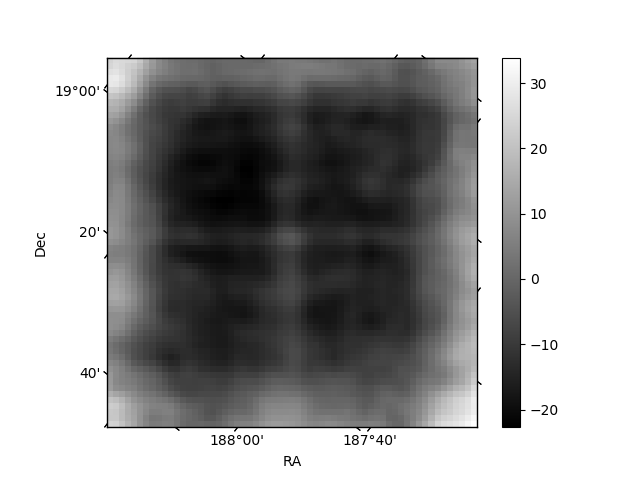
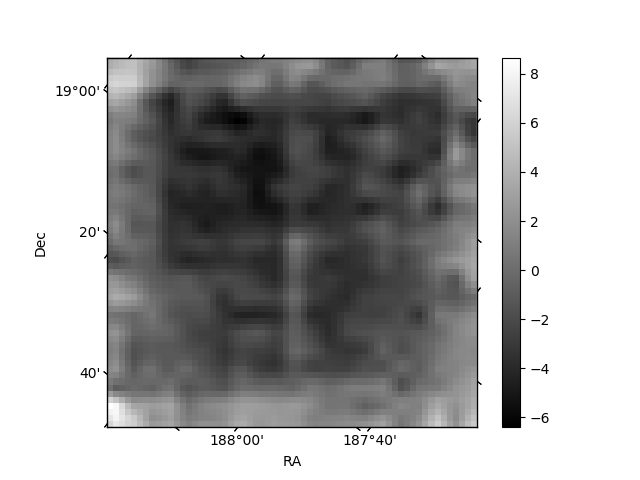
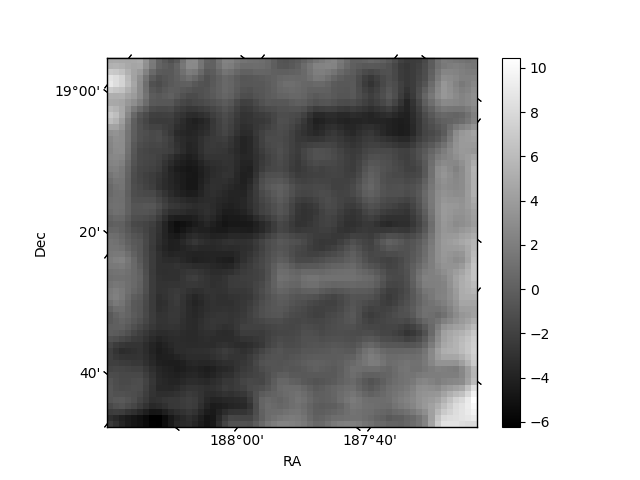
Histogram calculated using DETX and DETY for each event in the final _common_clean file
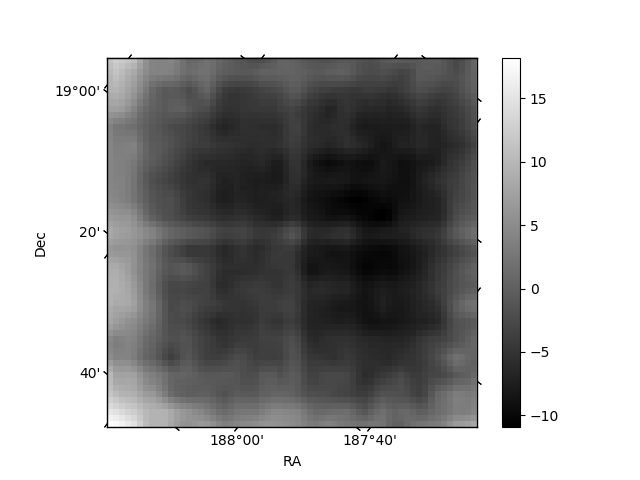
| Quadrant A | 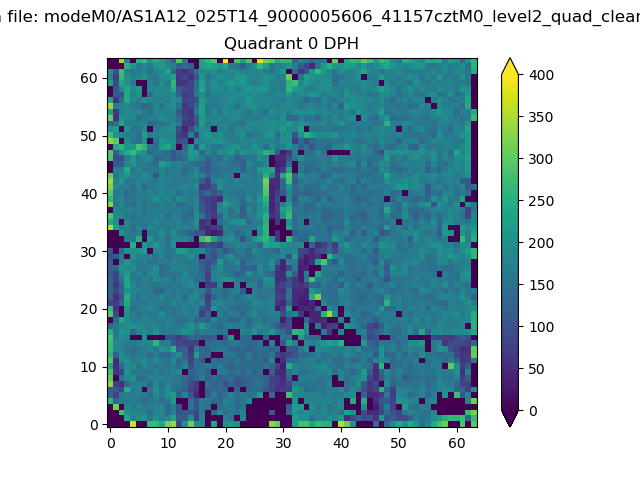 |
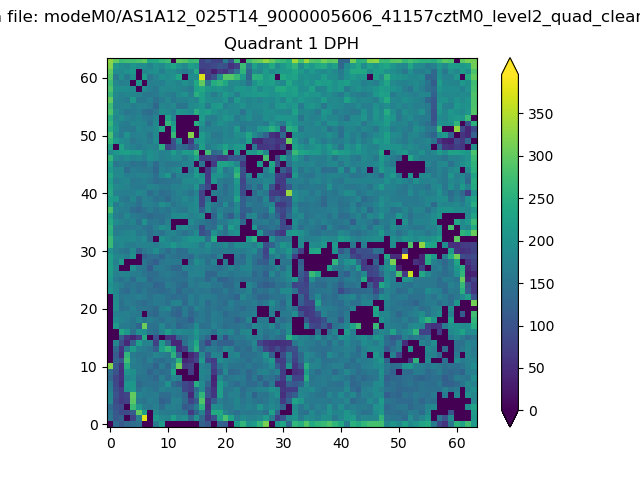 |
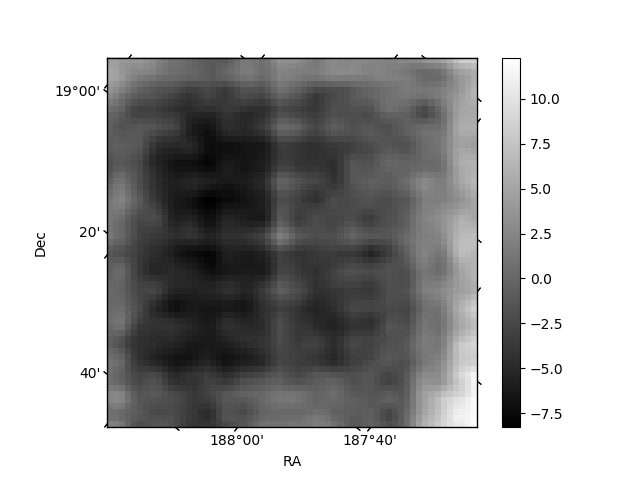
Quadrant B |
|---|---|---|---|
| Quadrant D | 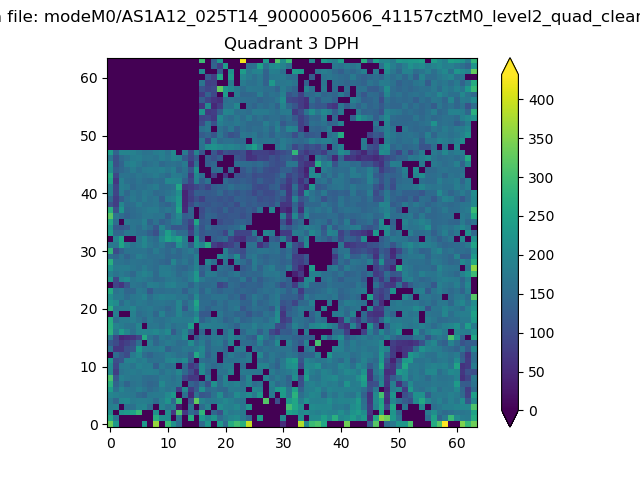 |
 |
Quadrant C |
| Plot type | Count rate plots | Images |
|---|---|---|
| Comparison with Poisson distribution Blue bars denote a histogram of data divided into 1 sec bins. Red curve is a Poisson curve with rate = median count rate of data. |
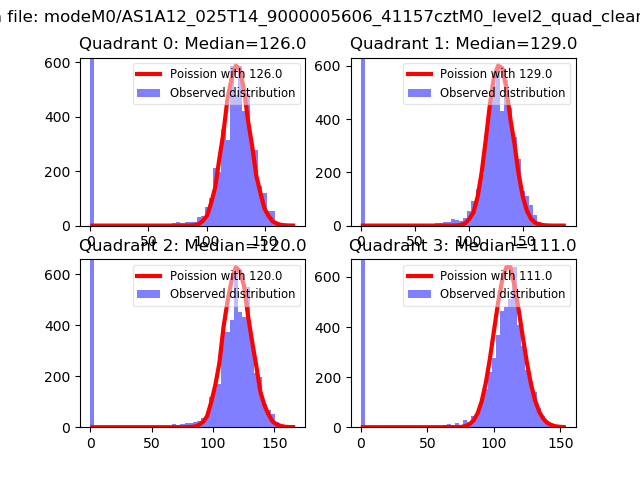 |
 |
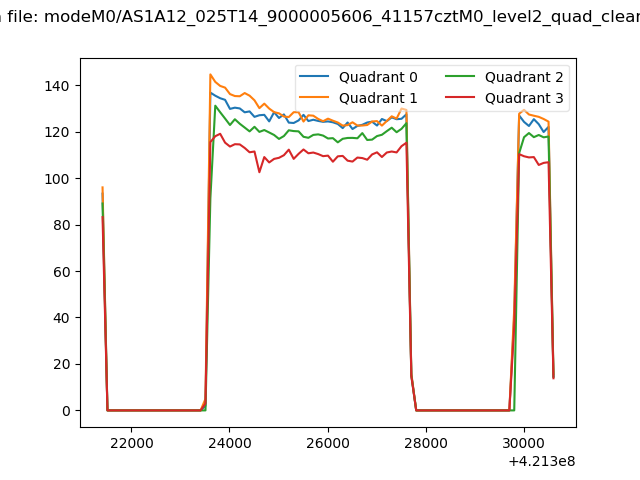
| Quadrant-wise count rates Data is divided into 100 sec bins |
 |
|
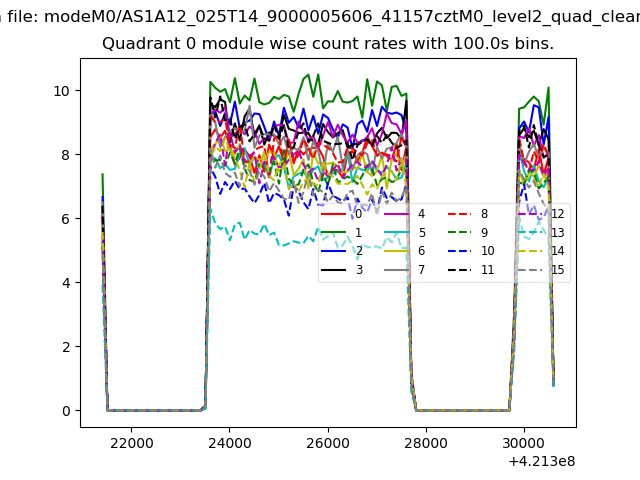
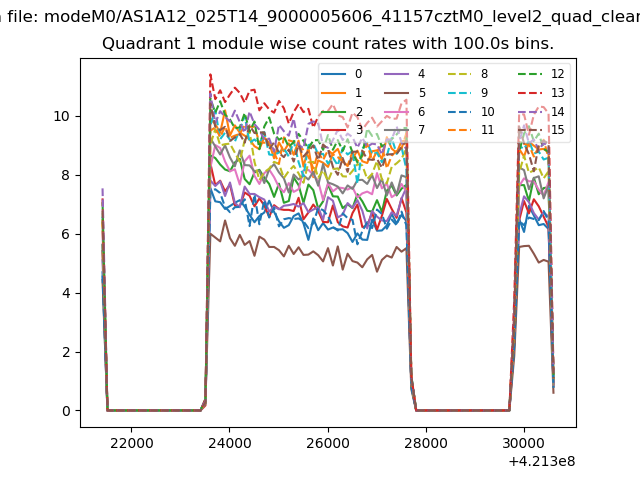
| Module-wise count rates for Quadrant A Data is divided into 100 sec bins |
 |
 |
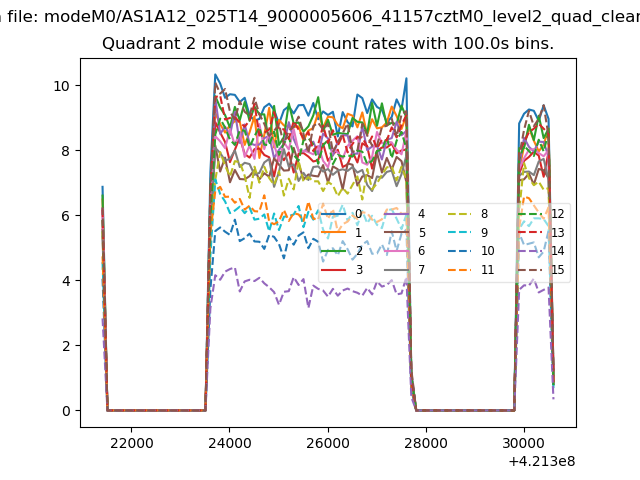
| Module-wise count rates for Quadrant B Data is divided into 100 sec bins |
 |
 |
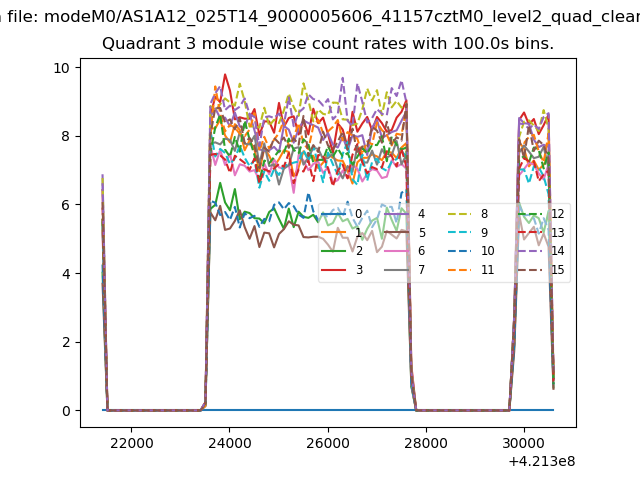
| Module-wise count rates for Quadrant C Data is divided into 100 sec bins |
 |
 |
| Module-wise count rates for Quadrant D Data is divided into 100 sec bins |
 |
 |
| Parameter | Plot |
|---|---|
| CZT HV Monitor | 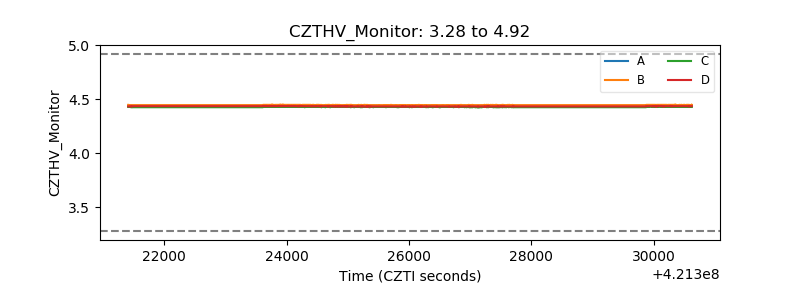 |
| D_VDD | 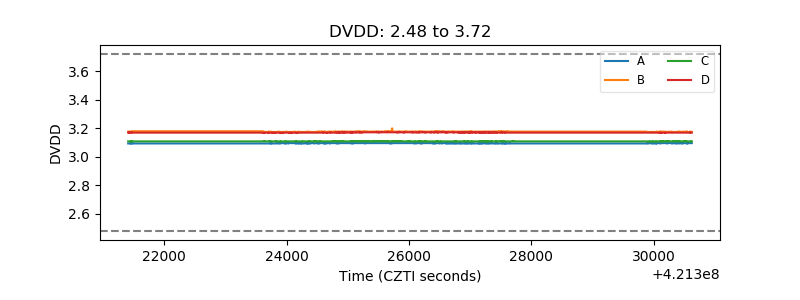 |
| Temperature 1 | 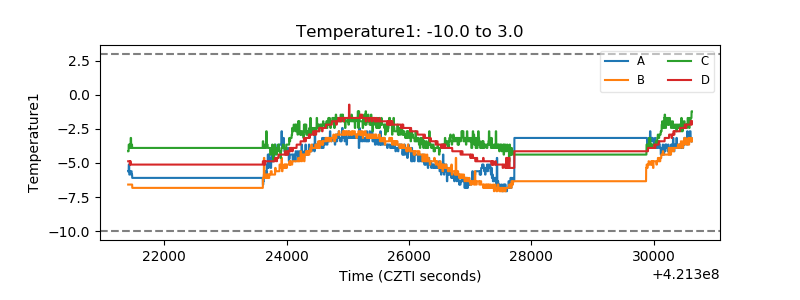 |
| Veto HV Monitor | 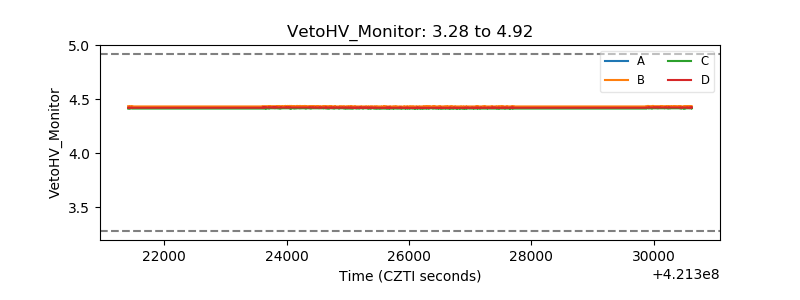 |
| Veto LLD | 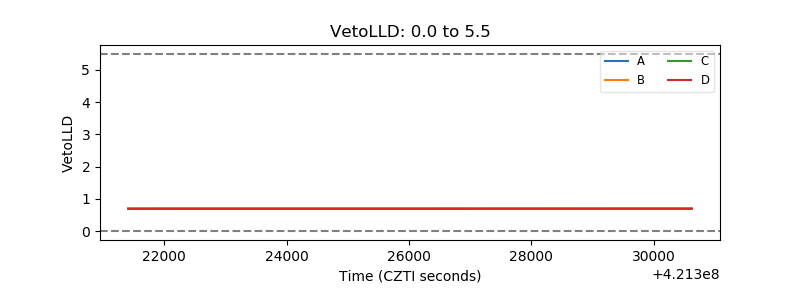 |
| Alpha Counter | 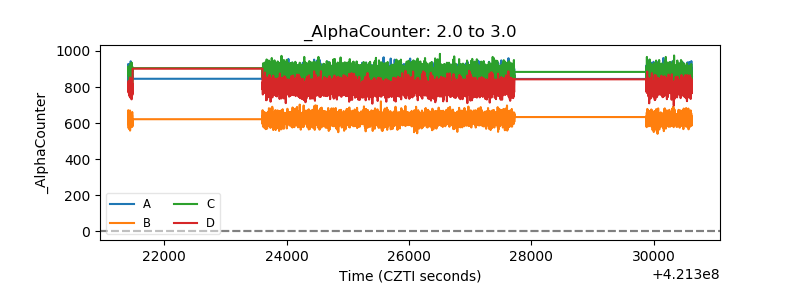 |
| _CPM_Rate | 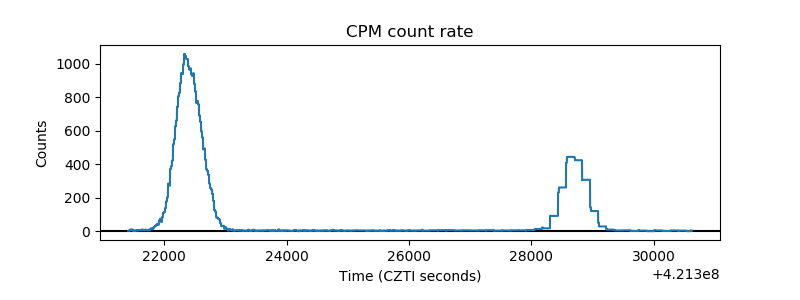 |
| CZT Counter | 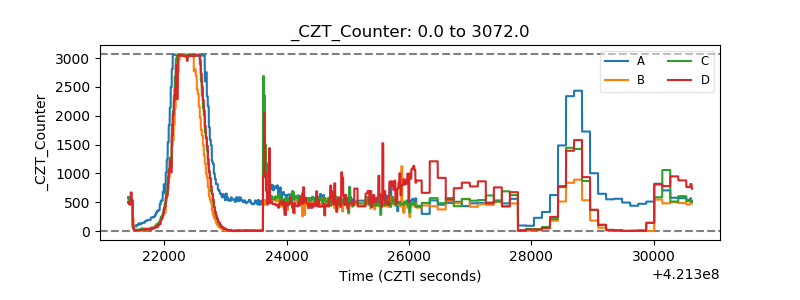 |
| +2.5 Volts monitor | 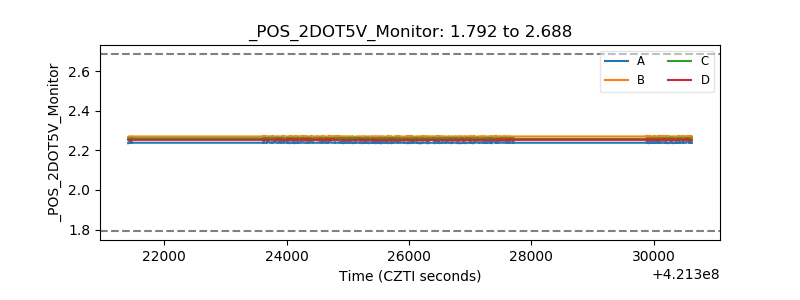 |
| +5 Volts monitor | 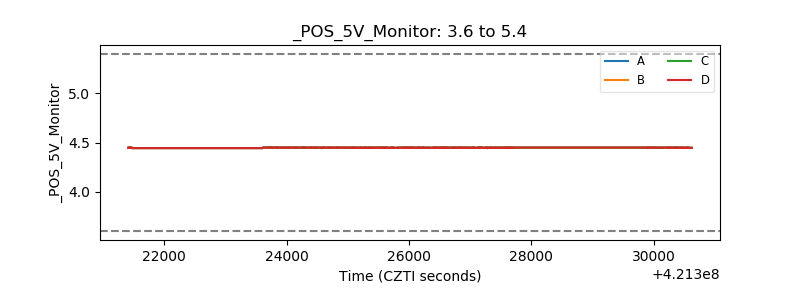 |
| _ROLL_ROT | 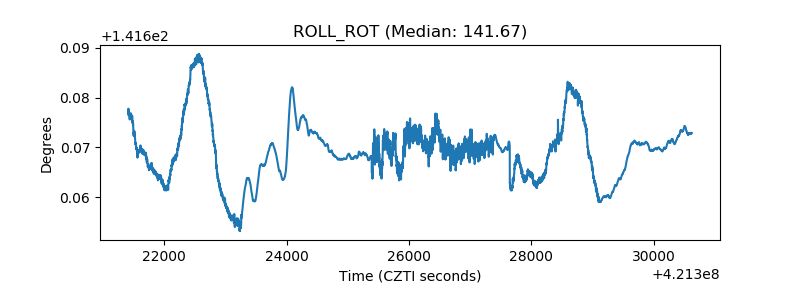 |
| _Roll_DEC | 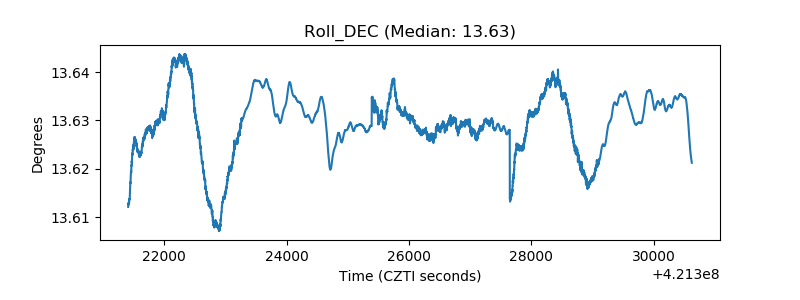 |
| _Roll_RA | 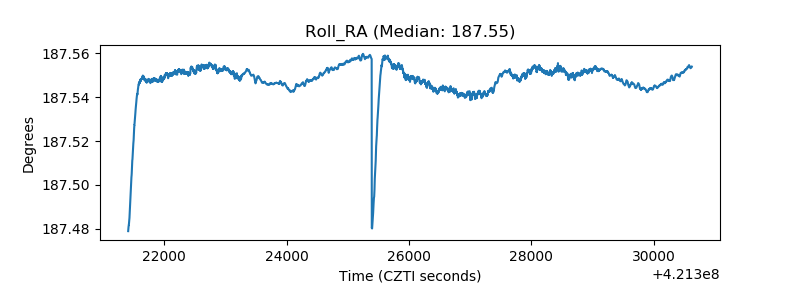 |
| Veto Counter | 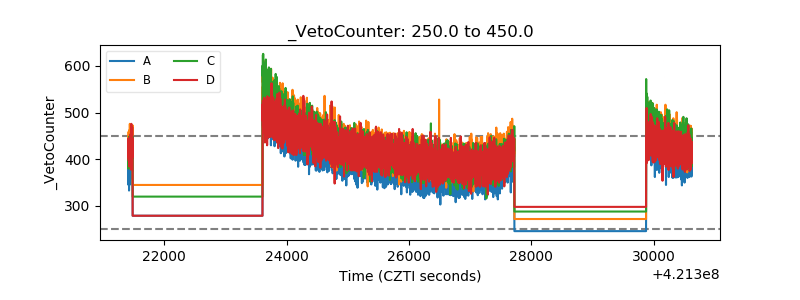 |