| Param | Original file | Final file |
|---|---|---|
| Filename | modeM0/AS1A12_025T14_9000005606_41158cztM0_level2.fits | modeM0/AS1A12_025T14_9000005606_41158cztM0_level2_quad_clean.evt |
| Size (bytes) | 262,990,080 | 63,299,520 |
| Size | 250.8 MB | 60.4 MB |
| Events in quadrant A | 1,921,545 | 432,499 |
| Events in quadrant B | 2,291,902 | 437,456 |
| Events in quadrant C | 2,077,023 | 405,851 |
| Events in quadrant D | 3,160,744 | 383,433 |
| Mode M0 | |||
|---|---|---|---|
| Quadrant | BADHDUFLAG | Total packets | Discarded packets |
| A | 0 | 7856 | 1 |
| B | 0 | 9216 | 1 |
| C | 0 | 8402 | 1 |
| D | 0 | 11908 | 1 |
| Mode SS | |||
|---|---|---|---|
| Quadrant | BADHDUFLAG | Total packets | Discarded packets |
| A | 0 | 74 | 0 |
| B | 0 | 74 | 0 |
| C | 0 | 74 | 0 |
| D | 0 | 74 | 0 |
| Mode M9 | |||
|---|---|---|---|
| Quadrant | BADHDUFLAG | Total packets | Discarded packets |
| A | 0 | 4 | 0 |
| B | 0 | 4 | 0 |
| C | 0 | 4 | 0 |
| D | 0 | 5 | 0 |
| Quadrant | Total seconds | Saturated seconds | Saturation percentage |
|---|---|---|---|
| A | 3637 | 6 | 0.164971% |
| B | 3637 | 61 | 1.677206% |
| C | 3637 | 69 | 1.897168% |
| D | 3637 | 41 | 1.127303% |
Noise dominated data is calculated using 1-second bins in cleaned event files. If a bin has >2000 counts, and if more than 50% of those come from <1% of pixels, then it is considered to be noise-dominated and hence unusable.
| Quadrant | # 1 sec bins | Bins with >0 counts | Bins with >2000 counts | High rate bins dominated by noise | Noise dominated (total time) | Noise dominated (detector-on time) | Marked lightcurve |
|---|---|---|---|---|---|---|---|
| A | 3637 | 3637 | 1 | 1 | 0.03% | 0.03% | 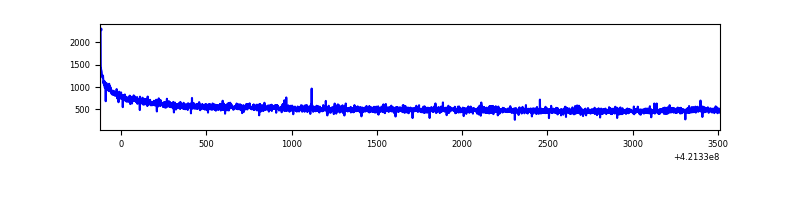 |
| B | 3637 | 3637 | 56 | 56 | 1.54% | 1.54% | 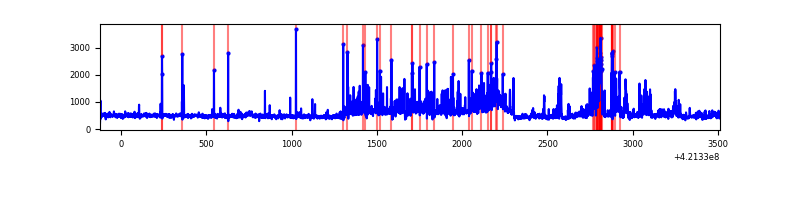 |
| C | 3637 | 3637 | 59 | 59 | 1.62% | 1.62% |  |
| D | 3637 | 3637 | 47 | 47 | 1.29% | 1.29% | 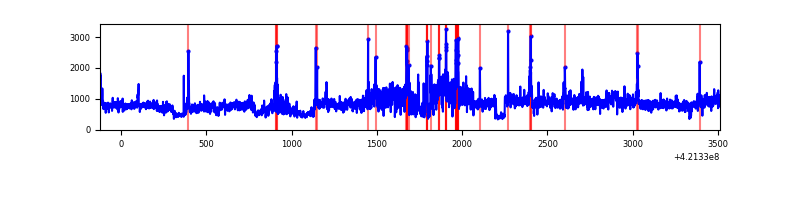 |
Top three noisy pixels from each quadrant. If the there are fewer than three noisy pixels in the level2.evt file, extra rows are filled as -1
| Pixel properties | Quadrant properties | ||||||
|---|---|---|---|---|---|---|---|
| Quadrant | DetID | PixID | Counts | Sigma | Mean | Median | Sigma |
| A | 10 | 83 | 323761 | 3776.54 | 412 | 404 | 85.6 |
| A | 13 | 254 | 6724 | 73.81 | 412 | 404 | 85.6 |
| A | 3 | 137 | 4326 | 45.81 | 412 | 404 | 85.6 |
| B | 0 | 245 | 347890 | 4395.68 | 402 | 390 | 79.1 |
| B | 7 | 202 | 334592 | 4227.47 | 402 | 390 | 79.1 |
| B | 0 | 190 | 15793 | 194.84 | 402 | 390 | 79.1 |
| C | 9 | 54 | 231737 | 2482.79 | 395 | 397 | 93.2 |
| C | 15 | 214 | 154926 | 1658.44 | 395 | 397 | 93.2 |
| C | 0 | 10 | 127190 | 1360.77 | 395 | 397 | 93.2 |
| D | 2 | 16 | 1394280 | 14084.21 | 399 | 388 | 99.0 |
| D | 5 | 32 | 71533 | 718.87 | 399 | 388 | 99.0 |
| D | 13 | 249 | 52882 | 530.41 | 399 | 388 | 99.0 |
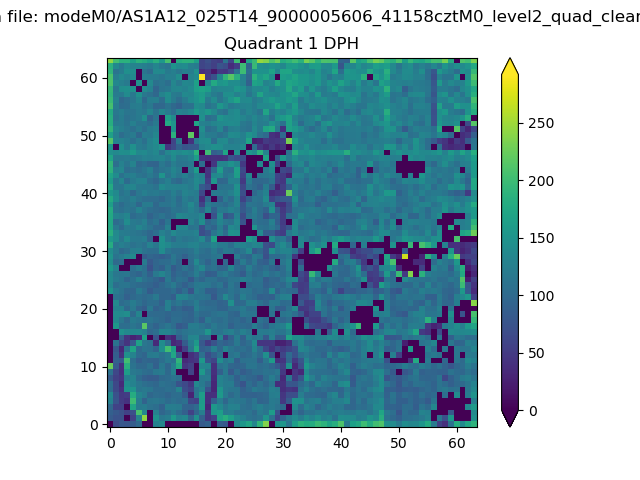
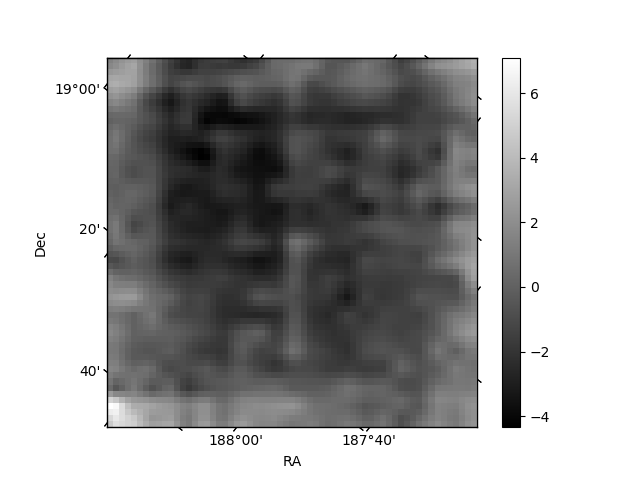
Histogram calculated using DETX and DETY for each event in the final _common_clean file
| Quadrant A | 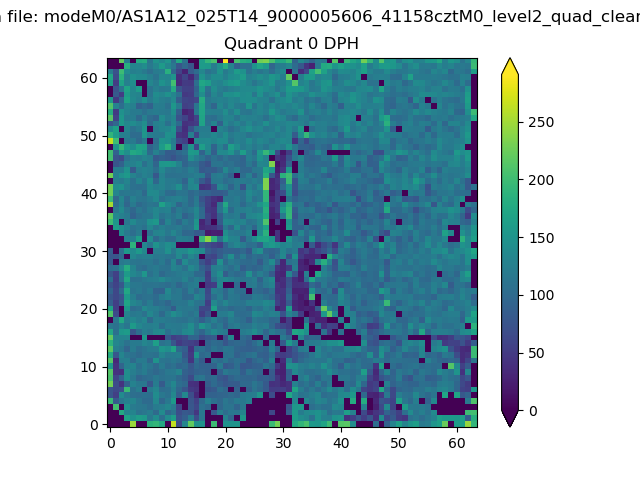 |
 |
Quadrant B |
|---|---|---|---|
| Quadrant D | 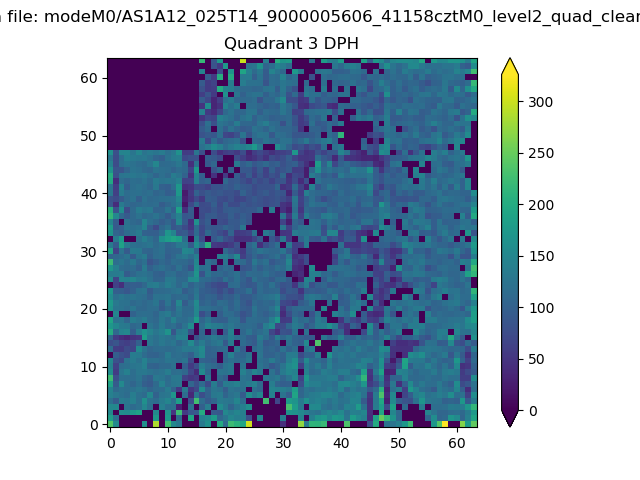 |
 |
Quadrant C |
| Plot type | Count rate plots | Images |
|---|---|---|
| Comparison with Poisson distribution Blue bars denote a histogram of data divided into 1 sec bins. Red curve is a Poisson curve with rate = median count rate of data. |
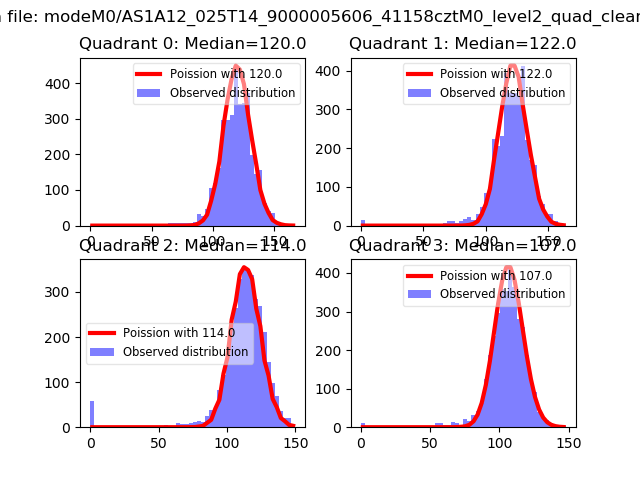 |
 |
| Quadrant-wise count rates Data is divided into 100 sec bins |
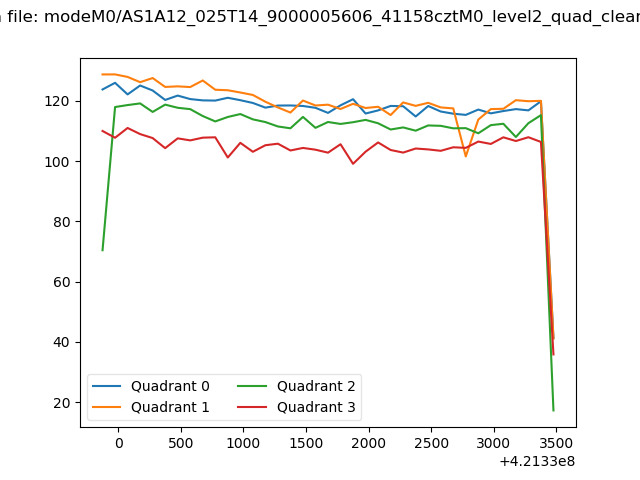 |
|
| Module-wise count rates for Quadrant A Data is divided into 100 sec bins |
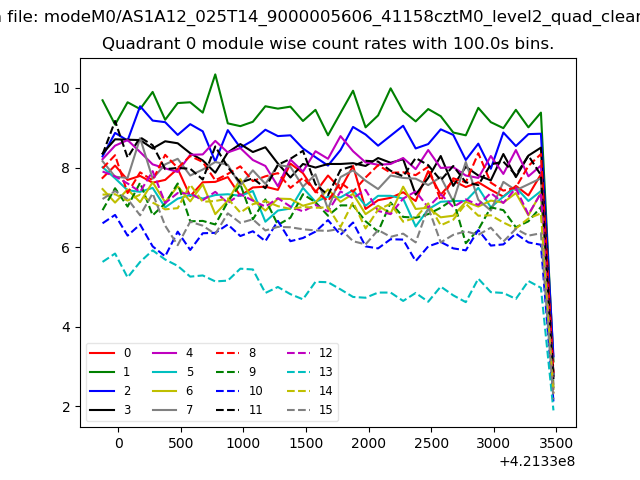 |
 |
| Module-wise count rates for Quadrant B Data is divided into 100 sec bins |
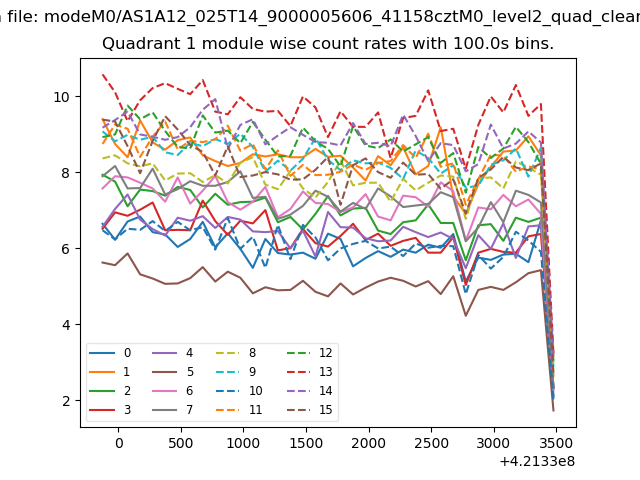 |
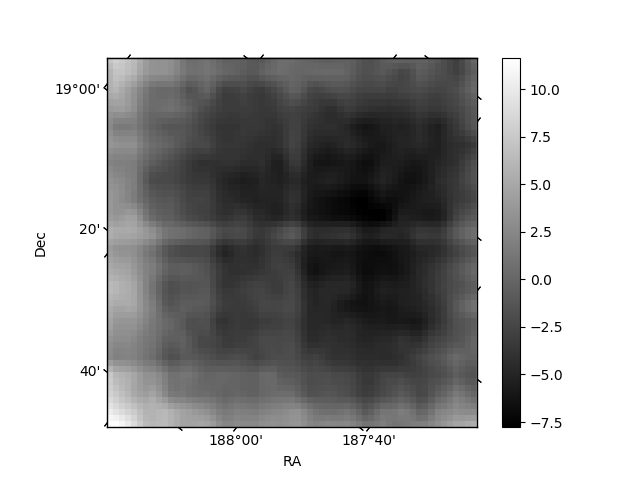 |
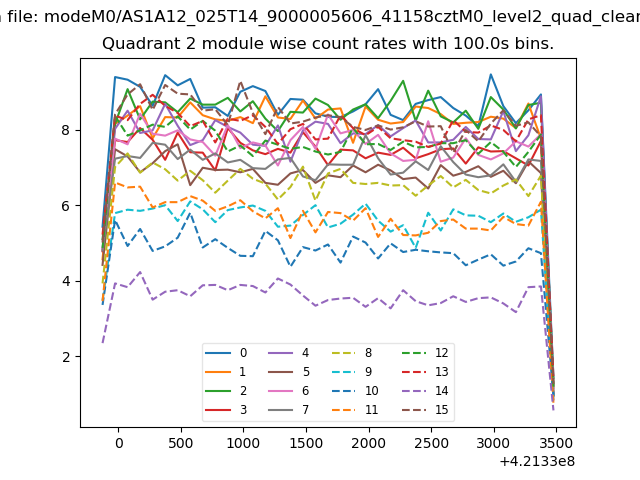
| Module-wise count rates for Quadrant C Data is divided into 100 sec bins |
 |
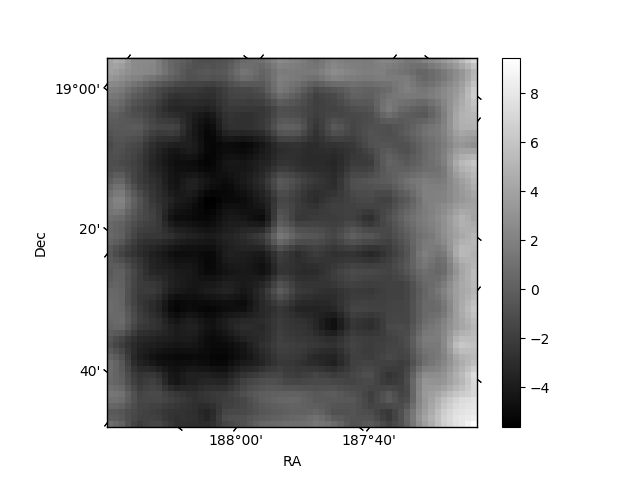 |
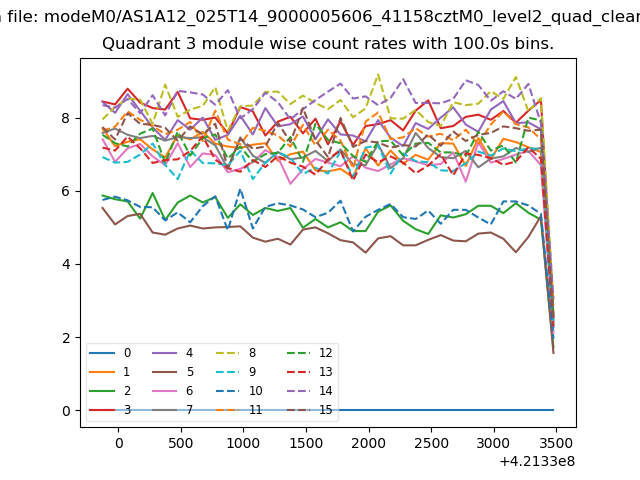
| Module-wise count rates for Quadrant D Data is divided into 100 sec bins |
 |
 |
| Parameter | Plot |
|---|---|
| CZT HV Monitor | 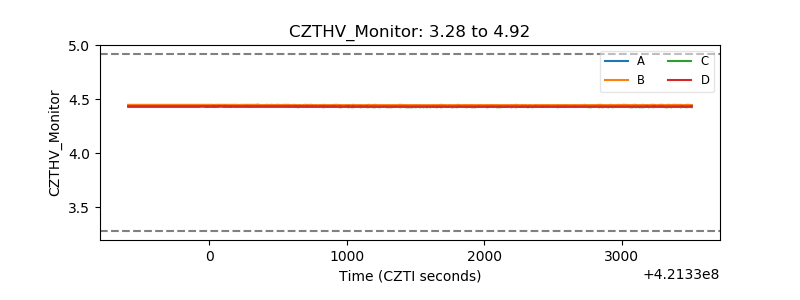 |
| D_VDD |  |
| Temperature 1 | 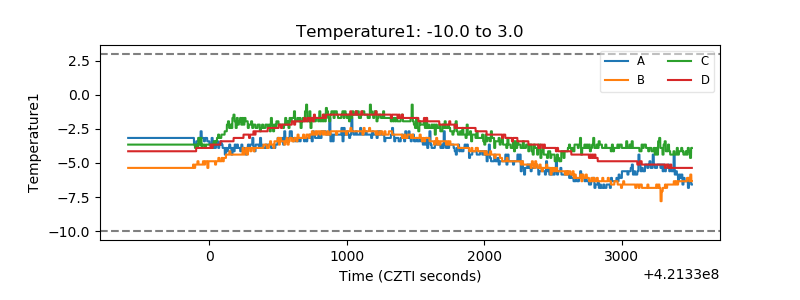 |
| Veto HV Monitor |  |
| Veto LLD | 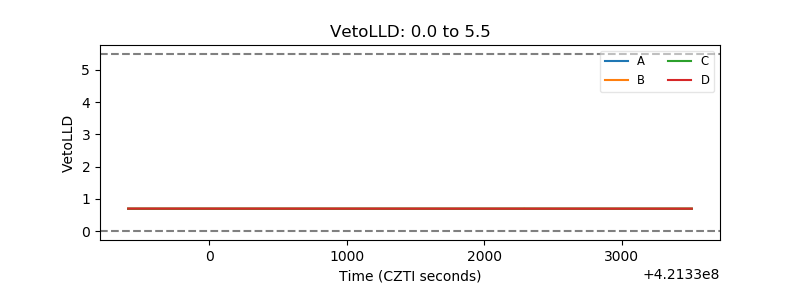 |
| Alpha Counter | 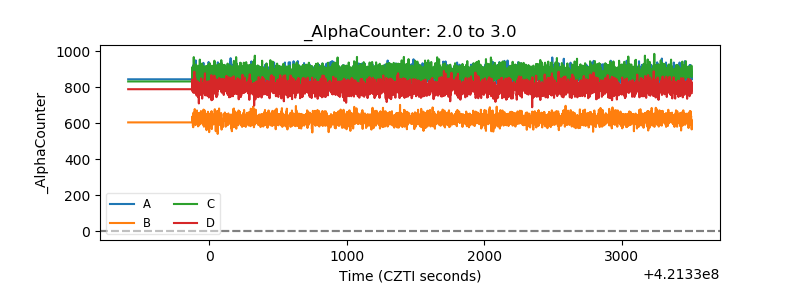 |
| _CPM_Rate | 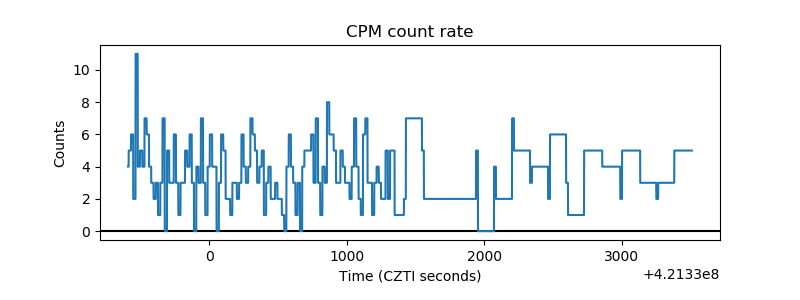 |
| CZT Counter | 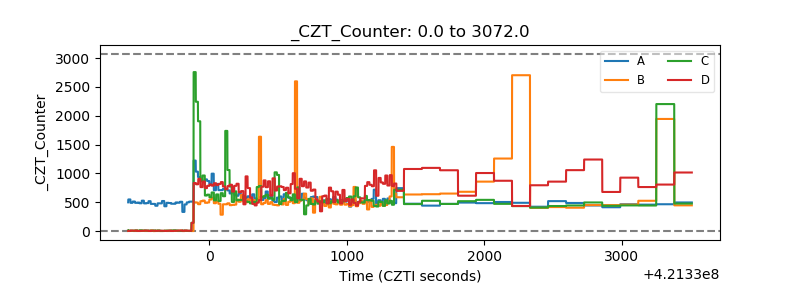 |
| +2.5 Volts monitor | 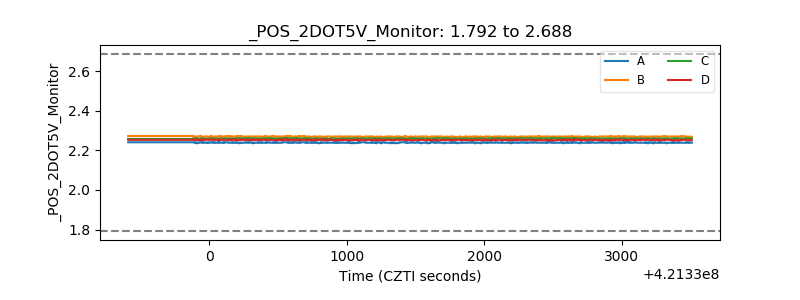 |
| +5 Volts monitor | 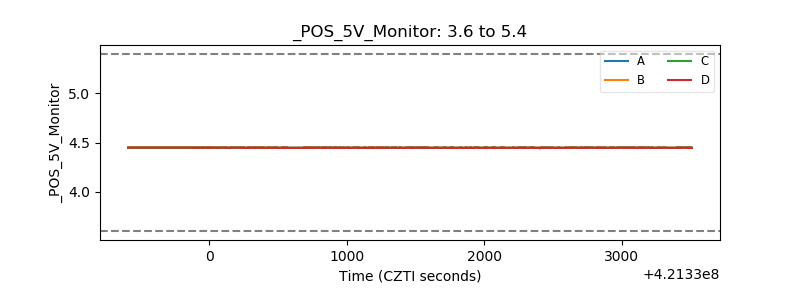 |
| _ROLL_ROT | 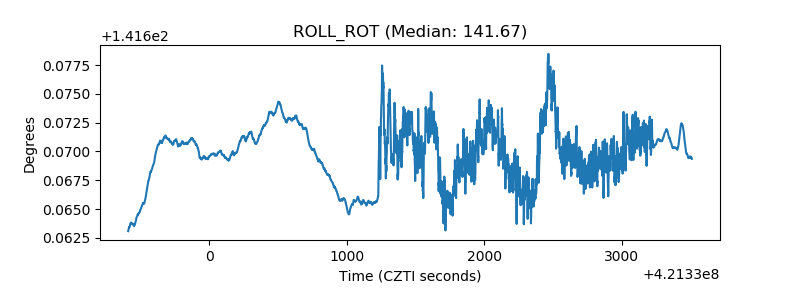 |
| _Roll_DEC | 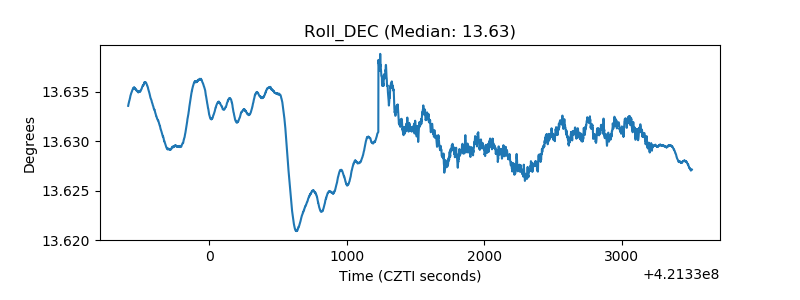 |
| _Roll_RA | 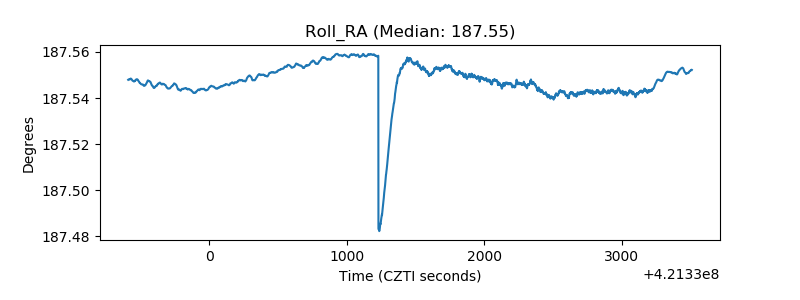 |
| Veto Counter | 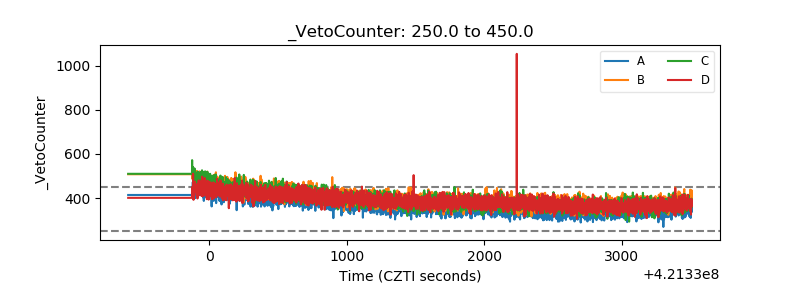 |