| Param | Original file | Final file |
|---|---|---|
| Filename | modeM0/AS1A12_037T01_9000005608_41158cztM0_level2.fits | modeM0/AS1A12_037T01_9000005608_41158cztM0_level2_quad_clean.evt |
| Size (bytes) | 110,491,200 | 19,753,920 |
| Size | 105.4 MB | 18.8 MB |
| Events in quadrant A | 725,684 | 139,076 |
| Events in quadrant B | 821,174 | 141,956 |
| Events in quadrant C | 1,427,192 | 102,269 |
| Events in quadrant D | 1,020,367 | 124,902 |
| Mode SS | |||
|---|---|---|---|
| Quadrant | BADHDUFLAG | Total packets | Discarded packets |
| A | 0 | 26 | 0 |
| B | 0 | 26 | 0 |
| C | 0 | 26 | 0 |
| D | 0 | 26 | 0 |
| Mode M0 | |||
|---|---|---|---|
| Quadrant | BADHDUFLAG | Total packets | Discarded packets |
| A | 0 | 2874 | 2 |
| B | 0 | 3136 | 1 |
| C | 0 | 5014 | 1 |
| D | 0 | 3823 | 1 |
| Mode M9 | |||
|---|---|---|---|
| Quadrant | BADHDUFLAG | Total packets | Discarded packets |
| A | 0 | 21 | 0 |
| B | 0 | 21 | 0 |
| C | 0 | 21 | 0 |
| D | 0 | 21 | 0 |
| Quadrant | Total seconds | Saturated seconds | Saturation percentage |
|---|---|---|---|
| A | 1195 | 4 | 0.334728% |
| B | 1195 | 28 | 2.343096% |
| C | 1195 | 331 | 27.698745% |
| D | 1195 | 2 | 0.167364% |
Noise dominated data is calculated using 1-second bins in cleaned event files. If a bin has >2000 counts, and if more than 50% of those come from <1% of pixels, then it is considered to be noise-dominated and hence unusable.
| Quadrant | # 1 sec bins | Bins with >0 counts | Bins with >2000 counts | High rate bins dominated by noise | Noise dominated (total time) | Noise dominated (detector-on time) | Marked lightcurve |
|---|---|---|---|---|---|---|---|
| A | 3258 | 1196 | 1 | 1 | 0.03% | 0.08% | 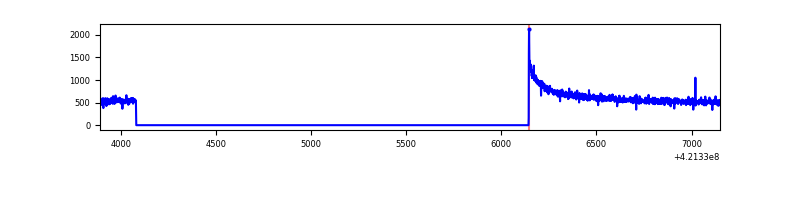 |
| B | 3258 | 1196 | 17 | 17 | 0.52% | 1.42% | 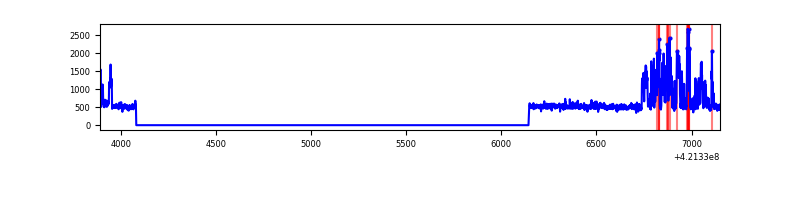 |
| C | 3258 | 1196 | 275 | 275 | 8.44% | 22.99% | 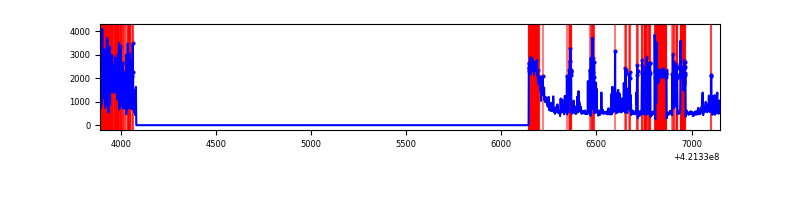 |
| D | 3258 | 1196 | 1 | 1 | 0.03% | 0.08% | 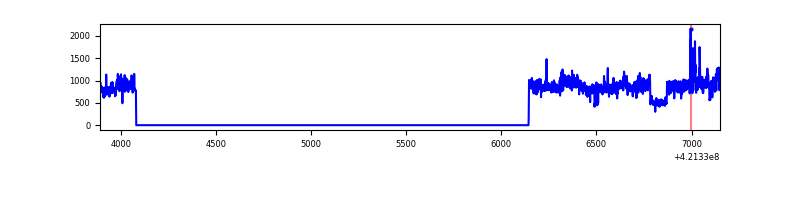 |
Top three noisy pixels from each quadrant. If the there are fewer than three noisy pixels in the level2.evt file, extra rows are filled as -1
| Pixel properties | Quadrant properties | ||||||
|---|---|---|---|---|---|---|---|
| Quadrant | DetID | PixID | Counts | Sigma | Mean | Median | Sigma |
| A | 10 | 83 | 169045 | 5374.27 | 143 | 140 | 31.4 |
| A | 13 | 254 | 1934 | 57.08 | 143 | 140 | 31.4 |
| A | 3 | 137 | 1573 | 45.6 | 143 | 140 | 31.4 |
| B | 0 | 245 | 236470 | 8087.17 | 140 | 136 | 29.2 |
| B | 7 | 202 | 25462 | 866.64 | 140 | 136 | 29.2 |
| B | 12 | 111 | 3504 | 115.25 | 140 | 136 | 29.2 |
| C | 9 | 54 | 718536 | 23754.29 | 120 | 121 | 30.2 |
| C | 0 | 10 | 166533 | 5502.39 | 120 | 121 | 30.2 |
| C | 15 | 214 | 49564 | 1634.83 | 120 | 121 | 30.2 |
| D | 2 | 16 | 459591 | 12955.19 | 138 | 134 | 35.5 |
| D | 13 | 249 | 17313 | 484.39 | 138 | 134 | 35.5 |
| D | 2 | 249 | 7152 | 197.88 | 138 | 134 | 35.5 |
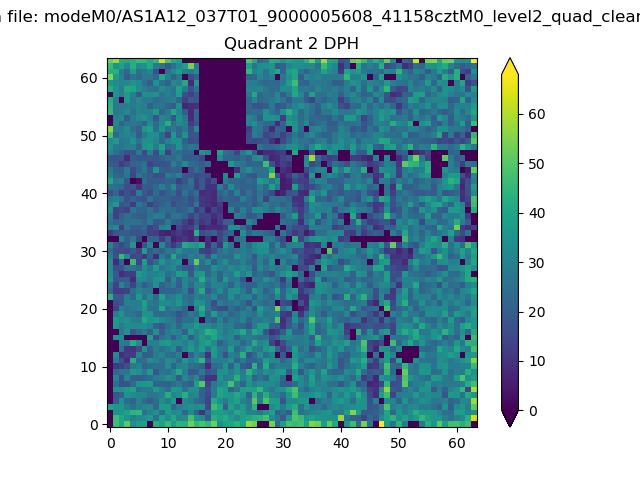
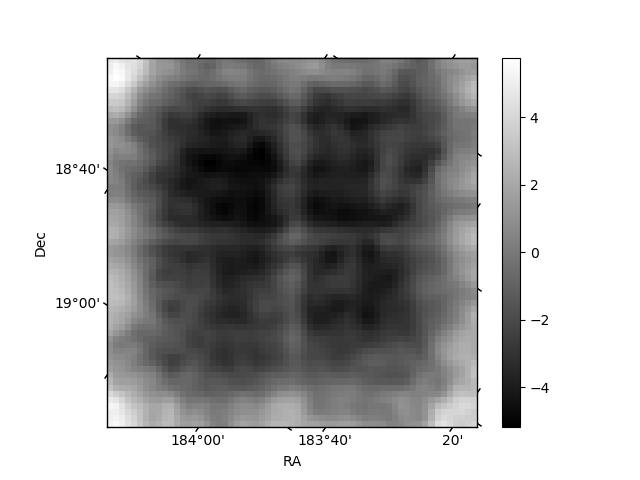
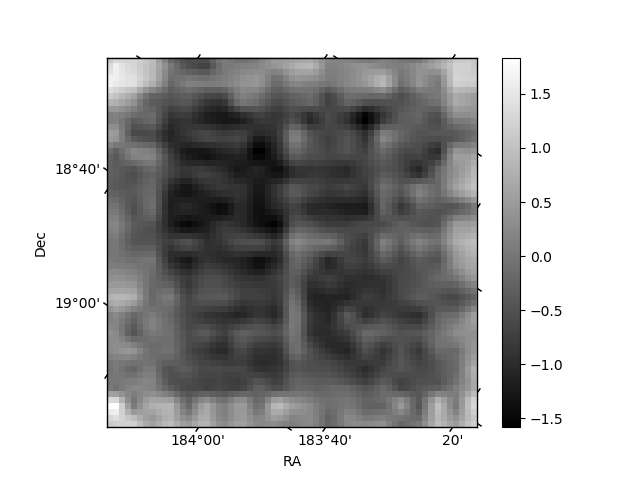
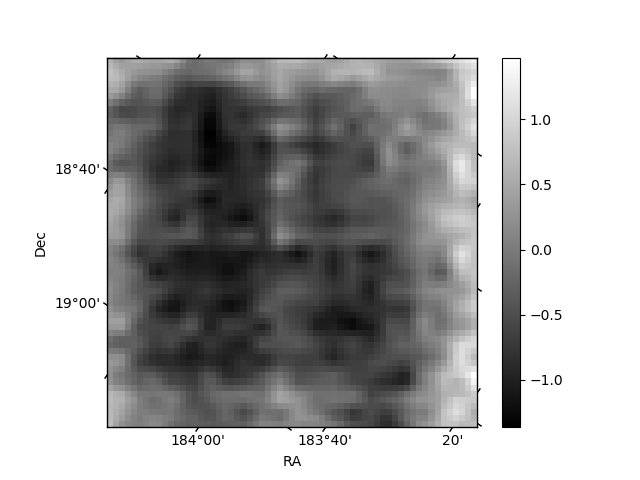
Histogram calculated using DETX and DETY for each event in the final _common_clean file
| Quadrant A | 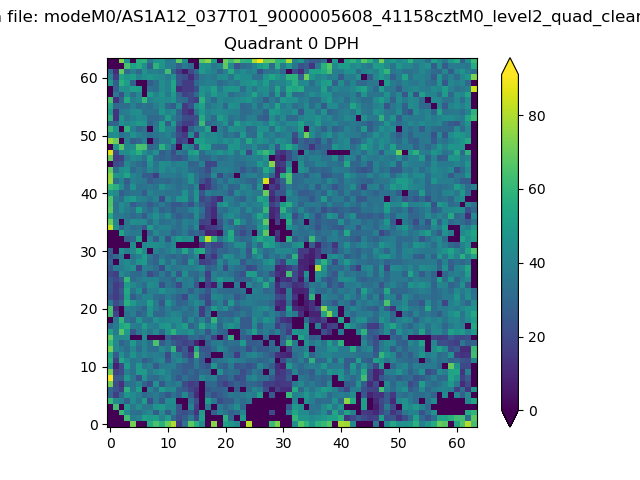 |
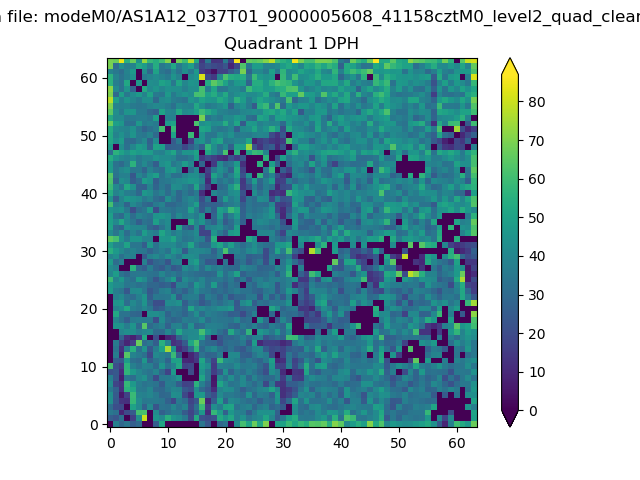 |
Quadrant B |
|---|---|---|---|
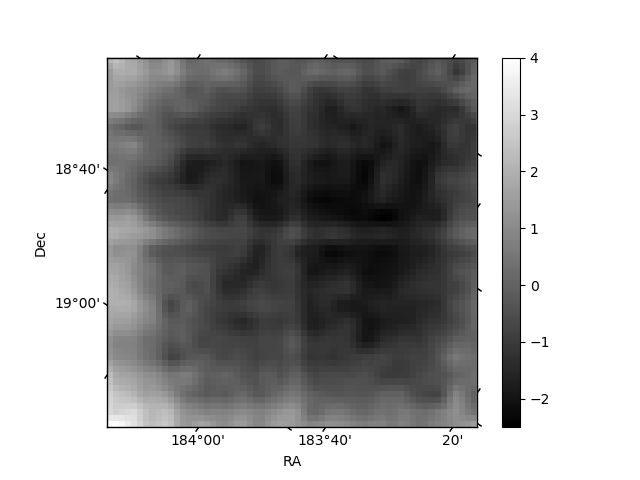
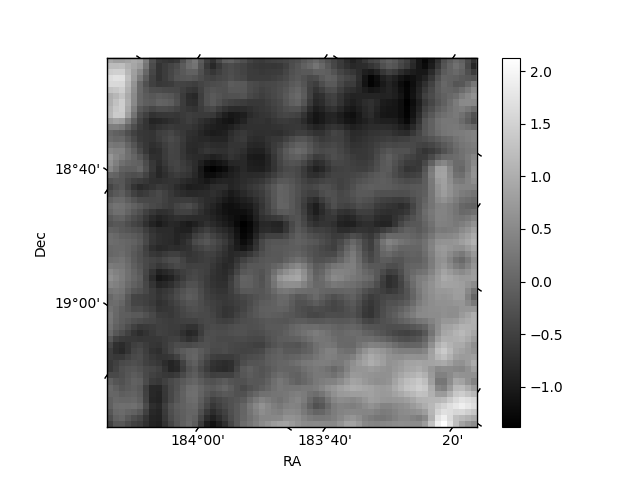
| Quadrant D | 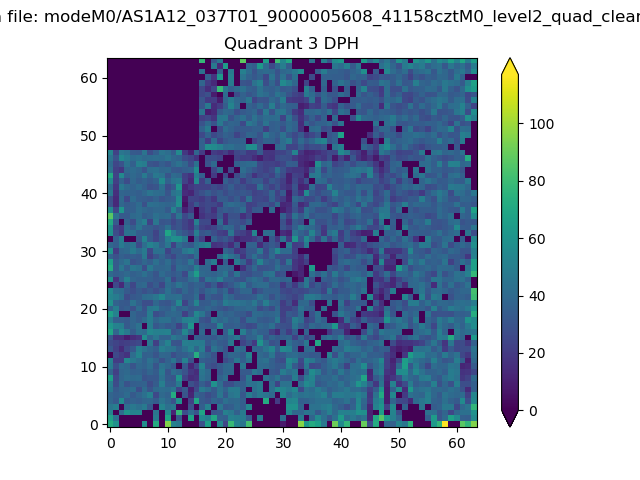 |
 |
Quadrant C |
| Plot type | Count rate plots | Images |
|---|---|---|
| Comparison with Poisson distribution Blue bars denote a histogram of data divided into 1 sec bins. Red curve is a Poisson curve with rate = median count rate of data. |
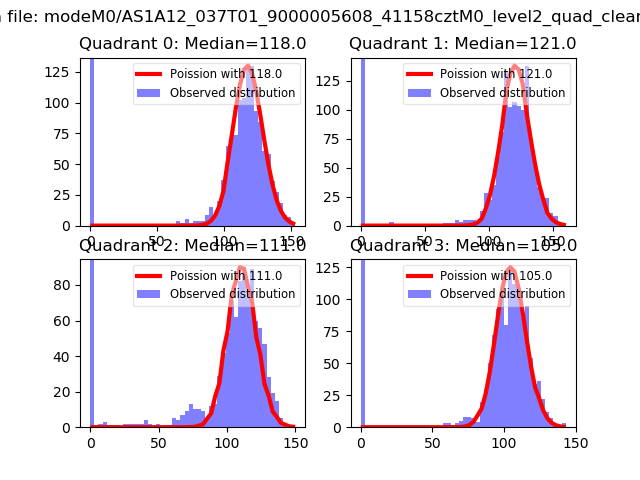 |
 |
| Quadrant-wise count rates Data is divided into 100 sec bins |
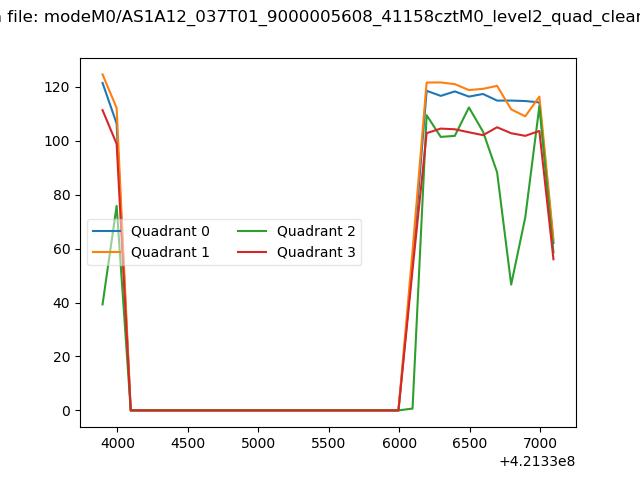 |
|
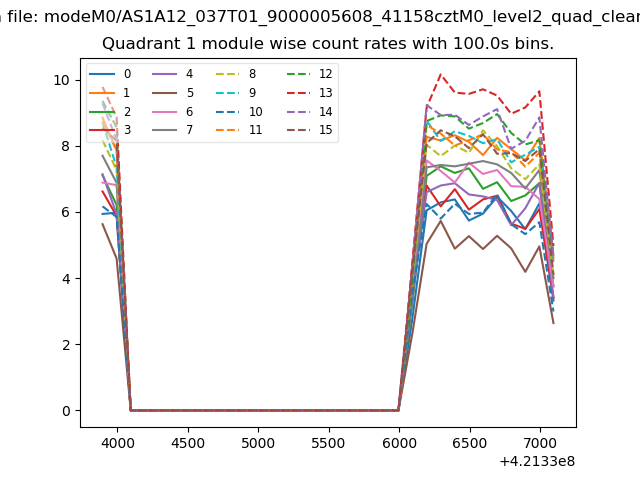
| Module-wise count rates for Quadrant A Data is divided into 100 sec bins |
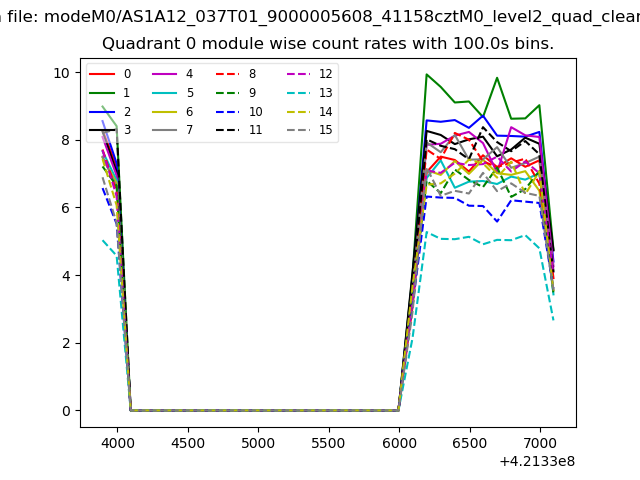 |
 |
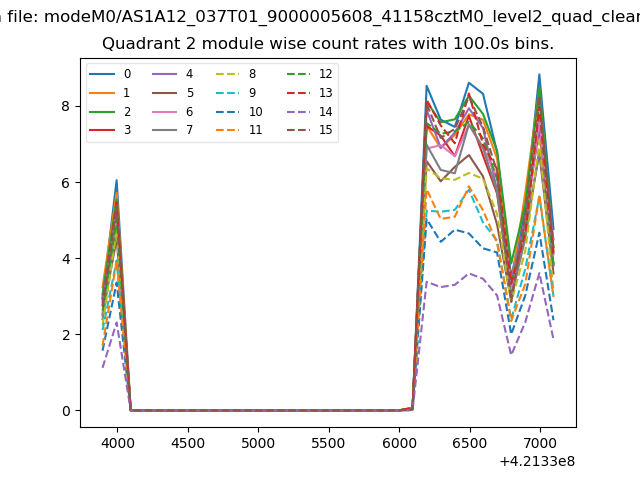
| Module-wise count rates for Quadrant B Data is divided into 100 sec bins |
 |
 |
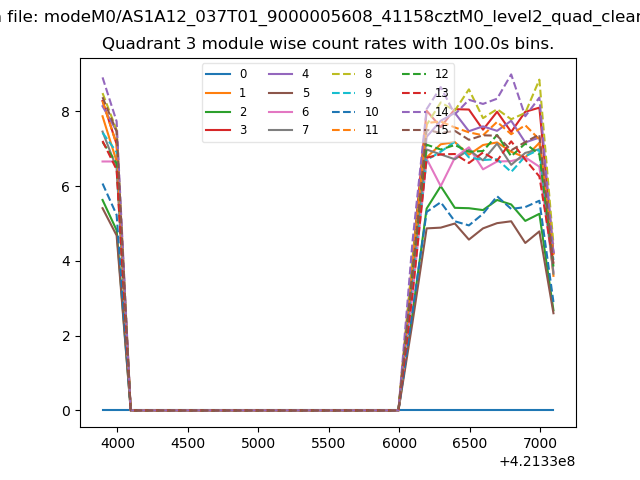
| Module-wise count rates for Quadrant C Data is divided into 100 sec bins |
 |
 |
| Module-wise count rates for Quadrant D Data is divided into 100 sec bins |
 |
 |
| Parameter | Plot |
|---|---|
| CZT HV Monitor | 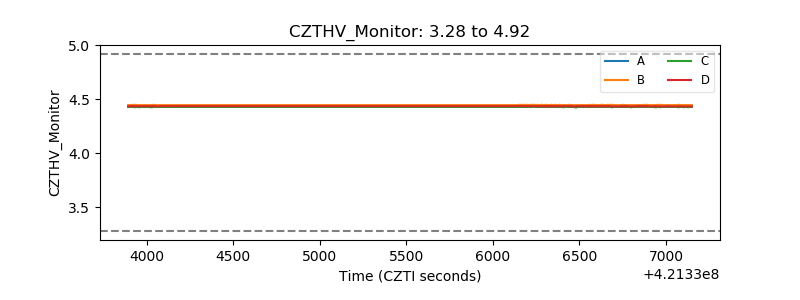 |
| D_VDD | 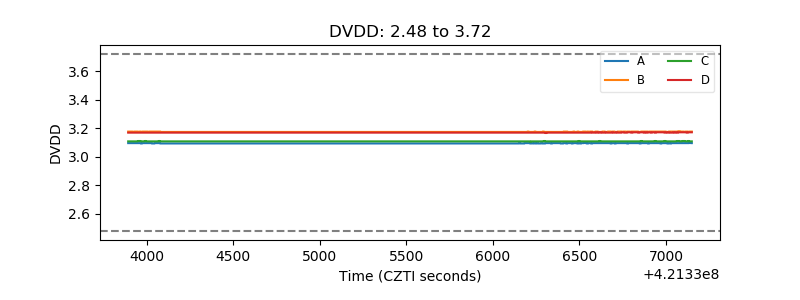 |
| Temperature 1 | 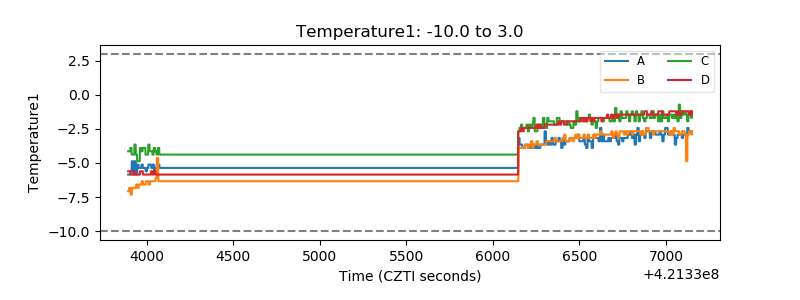 |
| Veto HV Monitor | 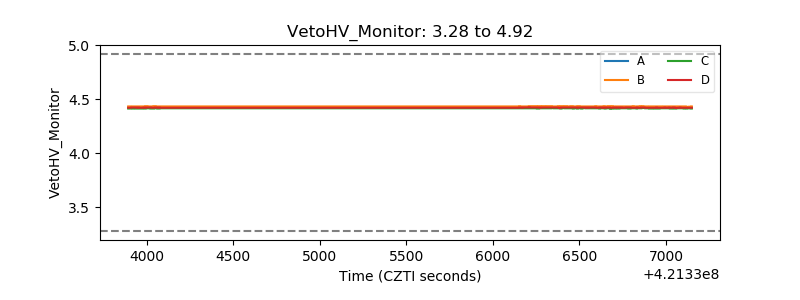 |
| Veto LLD | 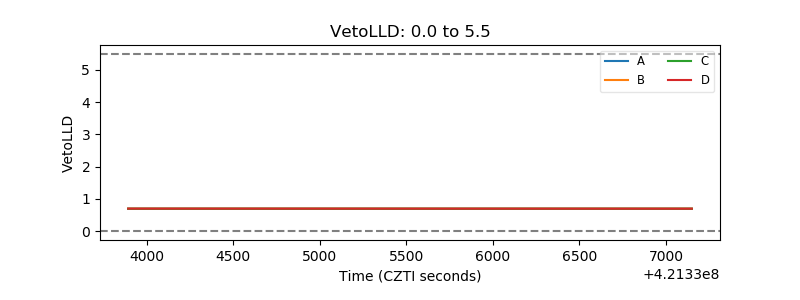 |
| Alpha Counter | 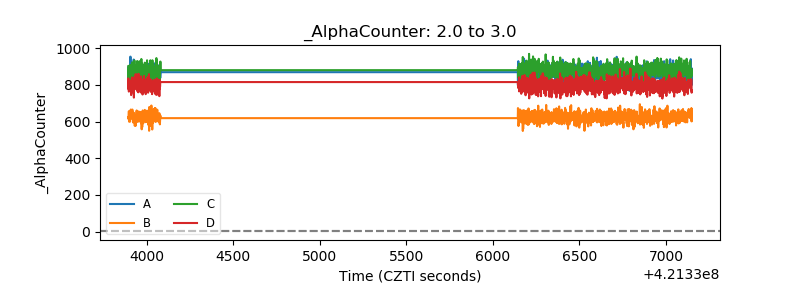 |
| _CPM_Rate | 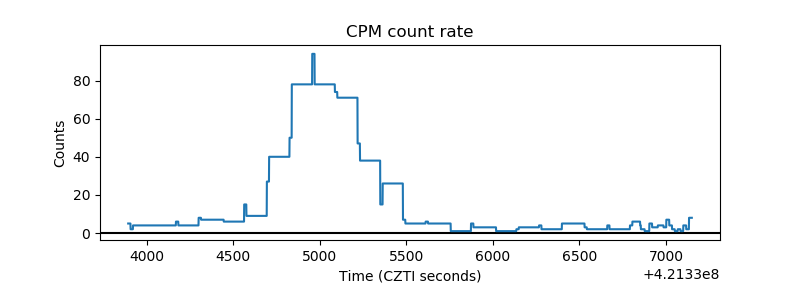 |
| CZT Counter | 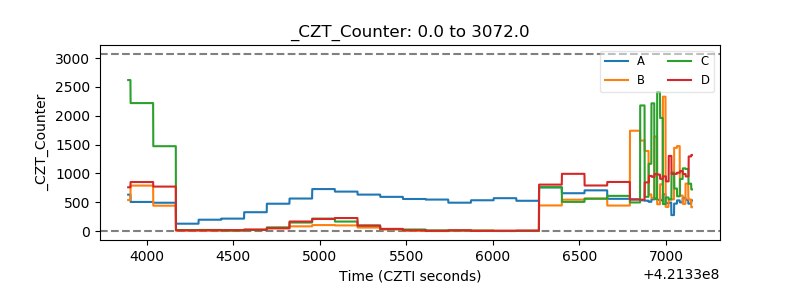 |
| +2.5 Volts monitor | 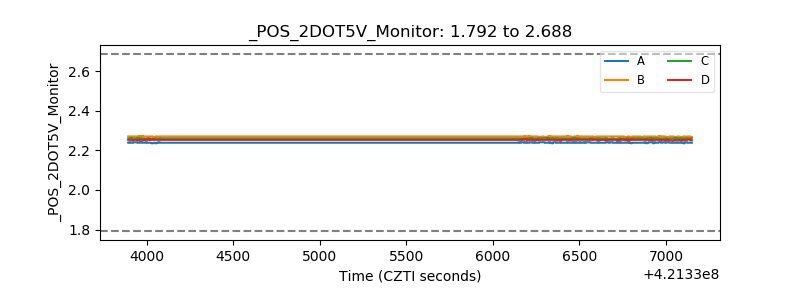 |
| +5 Volts monitor | 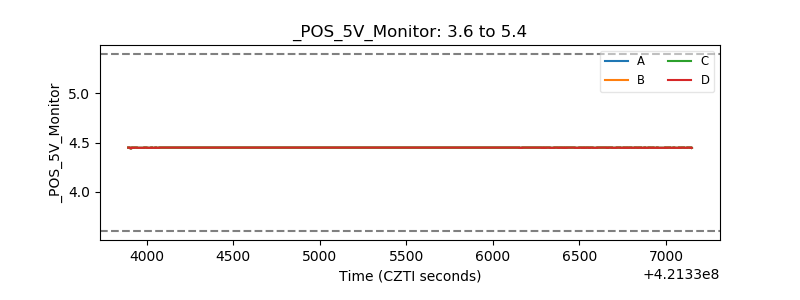 |
| _ROLL_ROT | 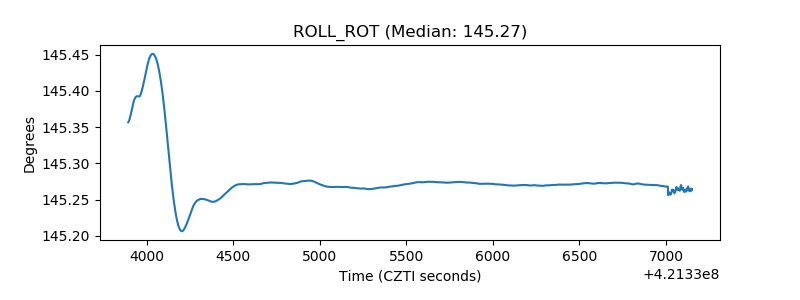 |
| _Roll_DEC | 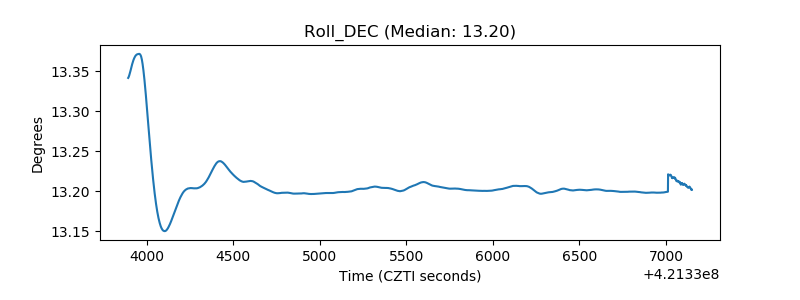 |
| _Roll_RA | 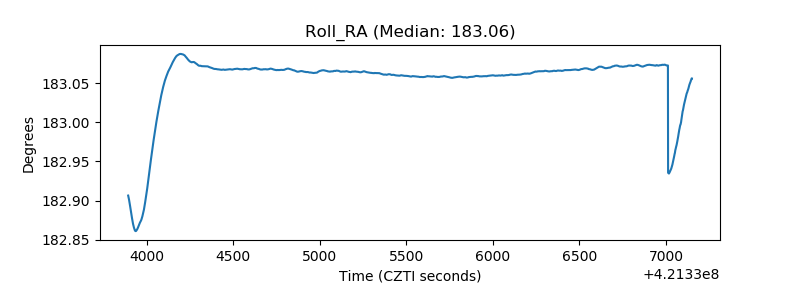 |
| Veto Counter | 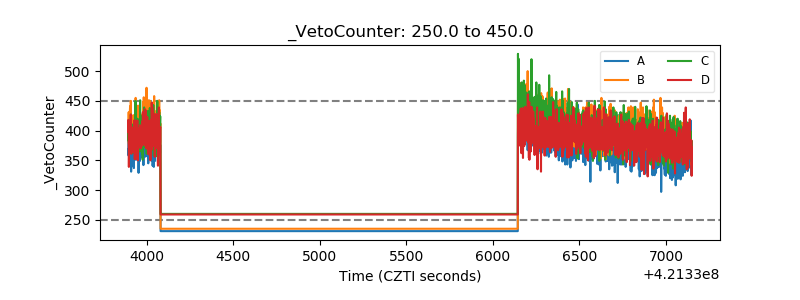 |