| Param | Original file | Final file |
|---|---|---|
| Filename | modeM0/AS1A12_037T01_9000005608_41159cztM0_level2.fits | modeM0/AS1A12_037T01_9000005608_41159cztM0_level2_quad_clean.evt |
| Size (bytes) | 488,044,800 | 82,716,480 |
| Size | 465.4 MB | 78.9 MB |
| Events in quadrant A | 2,733,449 | 601,490 |
| Events in quadrant B | 2,851,243 | 606,810 |
| Events in quadrant C | 7,317,569 | 400,691 |
| Events in quadrant D | 4,752,629 | 524,451 |
| Mode SS | |||
|---|---|---|---|
| Quadrant | BADHDUFLAG | Total packets | Discarded packets |
| A | 0 | 110 | 0 |
| B | 0 | 110 | 0 |
| C | 0 | 110 | 0 |
| D | 0 | 110 | 0 |
| Mode M0 | |||
|---|---|---|---|
| Quadrant | BADHDUFLAG | Total packets | Discarded packets |
| A | 0 | 11309 | 2 |
| B | 0 | 11958 | 1 |
| C | 0 | 25249 | 1 |
| D | 0 | 17857 | 1 |
| Mode M9 | |||
|---|---|---|---|
| Quadrant | BADHDUFLAG | Total packets | Discarded packets |
| A | 0 | 17 | 0 |
| B | 0 | 17 | 0 |
| C | 0 | 17 | 0 |
| D | 0 | 17 | 0 |
| Quadrant | Total seconds | Saturated seconds | Saturation percentage |
|---|---|---|---|
| A | 5290 | 5 | 0.094518% |
| B | 5290 | 51 | 0.964083% |
| C | 5290 | 1835 | 34.688091% |
| D | 5290 | 170 | 3.213611% |
Noise dominated data is calculated using 1-second bins in cleaned event files. If a bin has >2000 counts, and if more than 50% of those come from <1% of pixels, then it is considered to be noise-dominated and hence unusable.
| Quadrant | # 1 sec bins | Bins with >0 counts | Bins with >2000 counts | High rate bins dominated by noise | Noise dominated (total time) | Noise dominated (detector-on time) | Marked lightcurve |
|---|---|---|---|---|---|---|---|
| A | 7053 | 5291 | 1 | 1 | 0.01% | 0.02% | 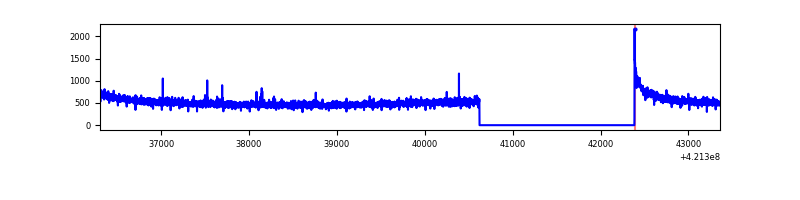 |
| B | 7053 | 5291 | 38 | 38 | 0.54% | 0.72% | 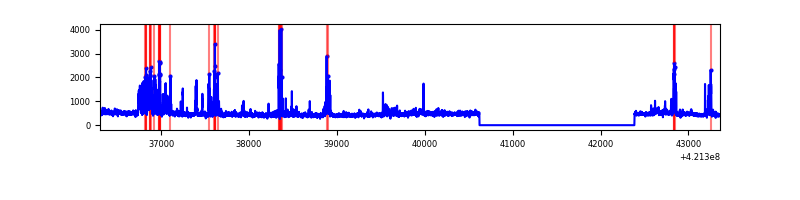 |
| C | 7053 | 5291 | 1577 | 1577 | 22.36% | 29.81% | 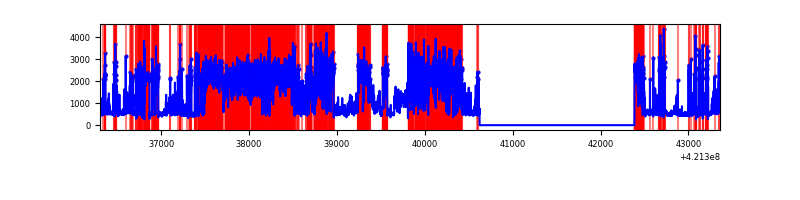 |
| D | 7053 | 5291 | 143 | 143 | 2.03% | 2.70% | 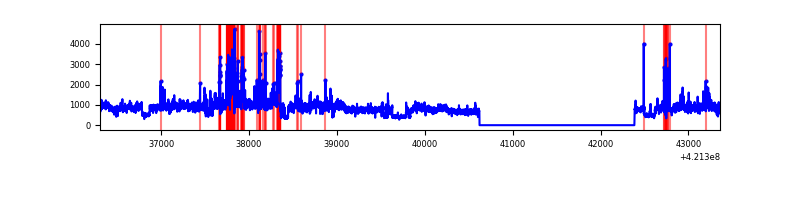 |
Top three noisy pixels from each quadrant. If the there are fewer than three noisy pixels in the level2.evt file, extra rows are filled as -1
| Pixel properties | Quadrant properties | ||||||
|---|---|---|---|---|---|---|---|
| Quadrant | DetID | PixID | Counts | Sigma | Mean | Median | Sigma |
| A | 10 | 83 | 455760 | 3743.04 | 587 | 574 | 121.6 |
| A | 13 | 254 | 8816 | 67.77 | 587 | 574 | 121.6 |
| A | 3 | 137 | 6567 | 49.28 | 587 | 574 | 121.6 |
| B | 0 | 245 | 497127 | 4425.96 | 577 | 560 | 112.2 |
| B | 7 | 202 | 55909 | 493.33 | 577 | 560 | 112.2 |
| B | 12 | 111 | 13919 | 119.07 | 577 | 560 | 112.2 |
| C | 9 | 54 | 5014469 | 43539.81 | 493 | 496 | 115.2 |
| C | 15 | 214 | 198002 | 1715.08 | 493 | 496 | 115.2 |
| C | 0 | 10 | 86261 | 744.76 | 493 | 496 | 115.2 |
| D | 2 | 16 | 1998204 | 14372.59 | 563 | 546 | 139.0 |
| D | 13 | 249 | 418585 | 3007.67 | 563 | 546 | 139.0 |
| D | 5 | 32 | 84744 | 605.78 | 563 | 546 | 139.0 |
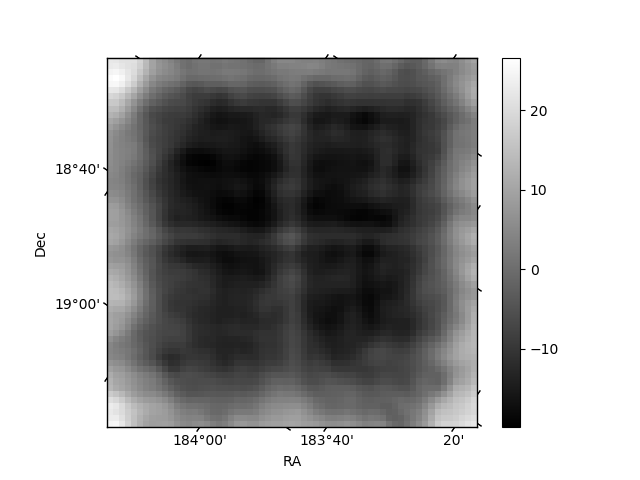
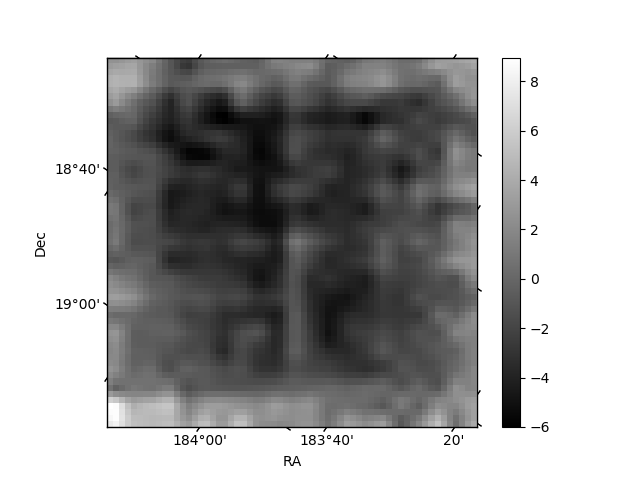
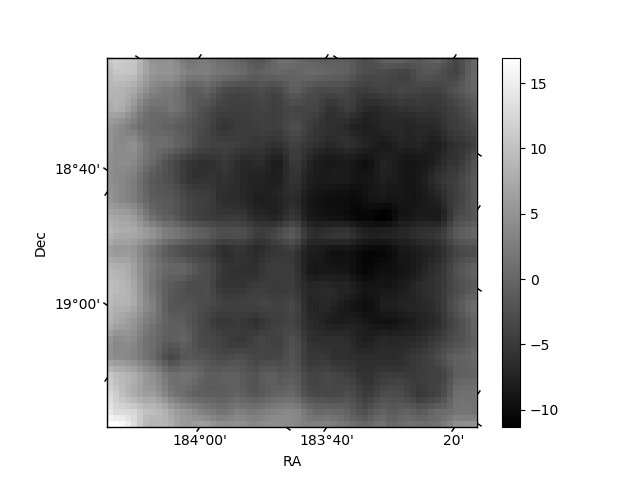
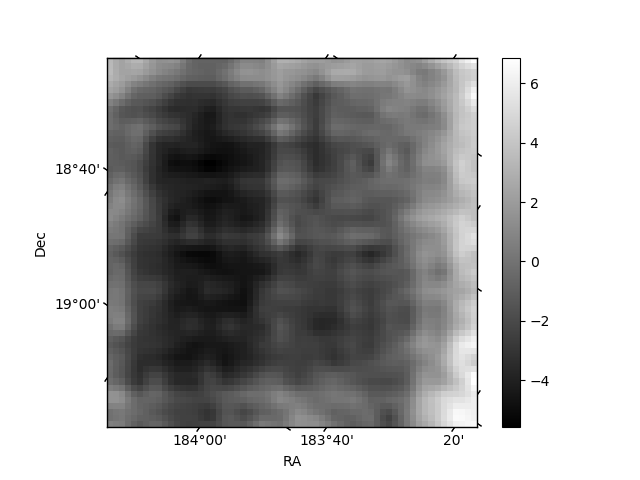
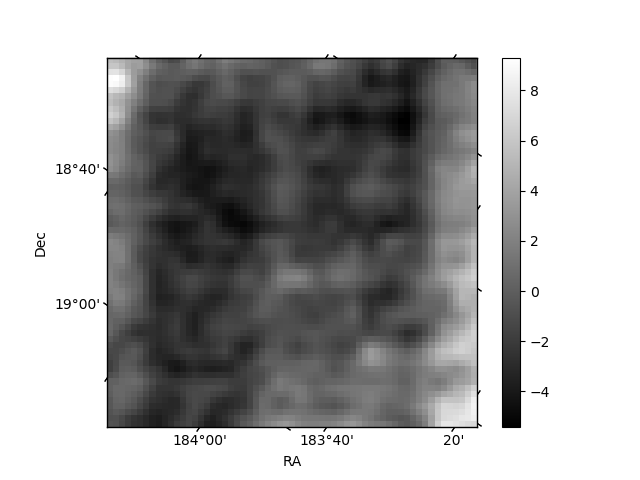
Histogram calculated using DETX and DETY for each event in the final _common_clean file
| Quadrant A | 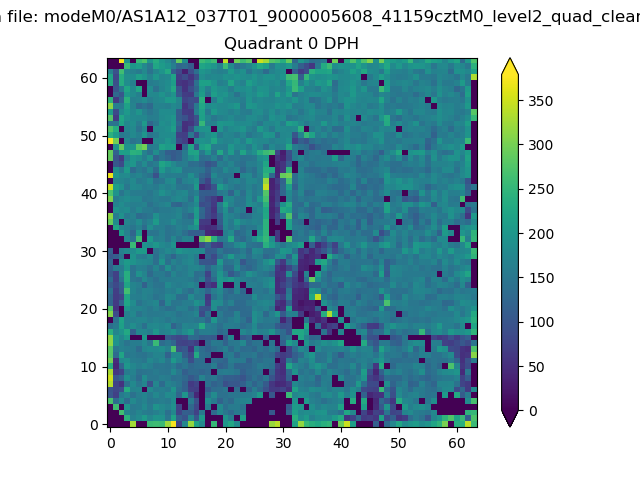 |
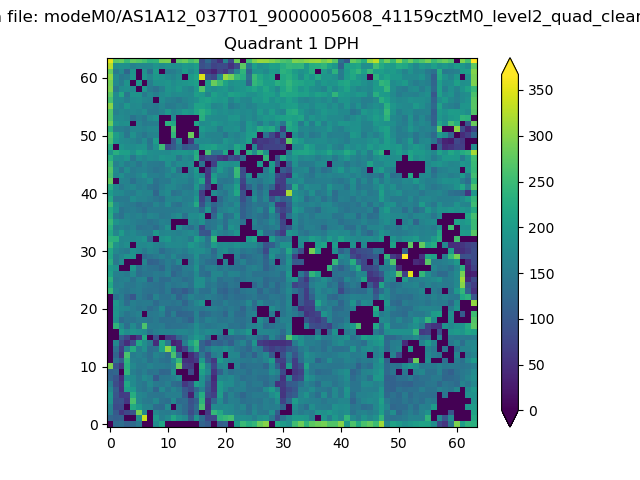 |
Quadrant B |
|---|---|---|---|
| Quadrant D |  |
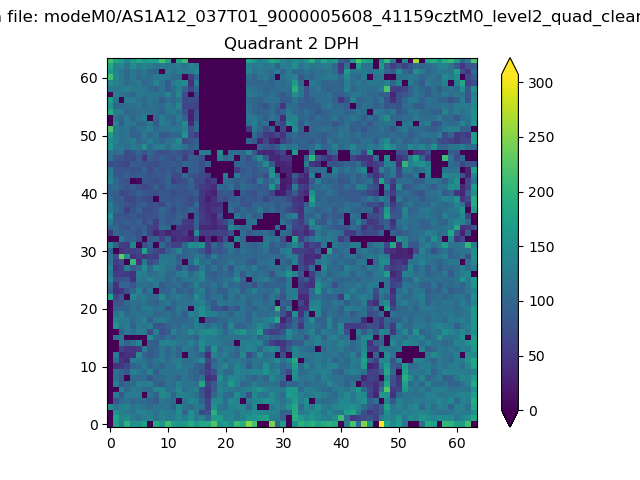 |
Quadrant C |
| Plot type | Count rate plots | Images |
|---|---|---|
| Comparison with Poisson distribution Blue bars denote a histogram of data divided into 1 sec bins. Red curve is a Poisson curve with rate = median count rate of data. |
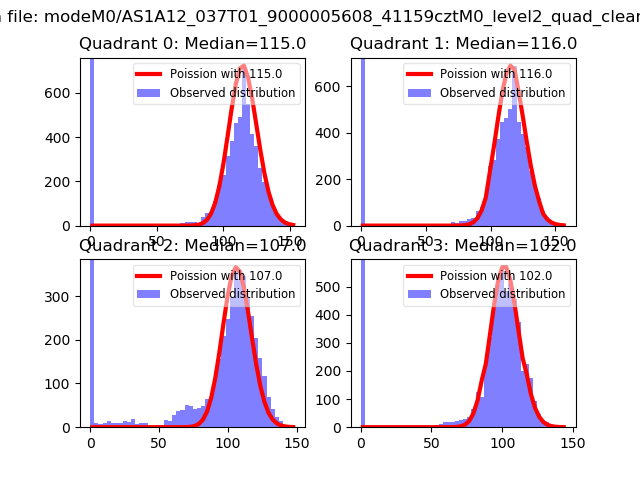 |
 |
| Quadrant-wise count rates Data is divided into 100 sec bins |
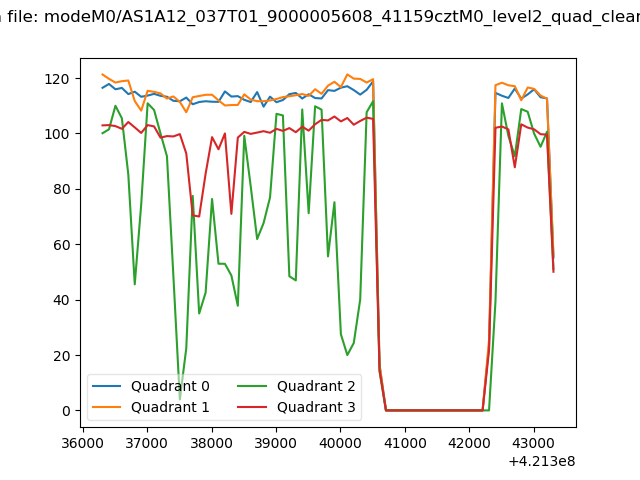 |
|
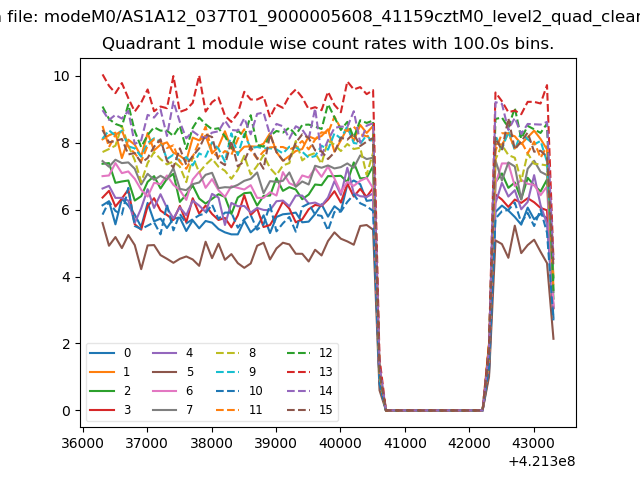
| Module-wise count rates for Quadrant A Data is divided into 100 sec bins |
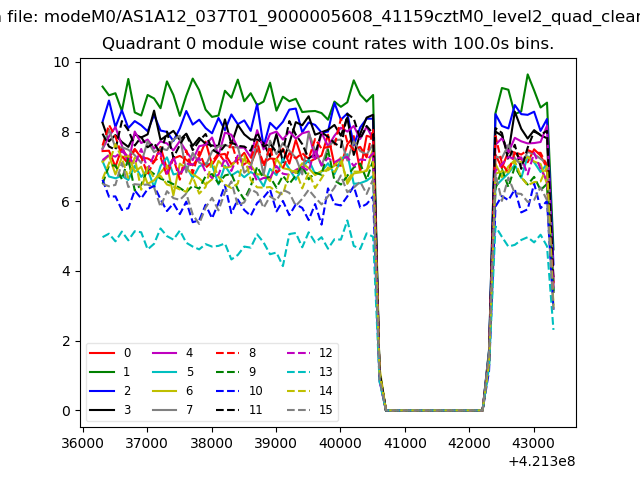 |
 |
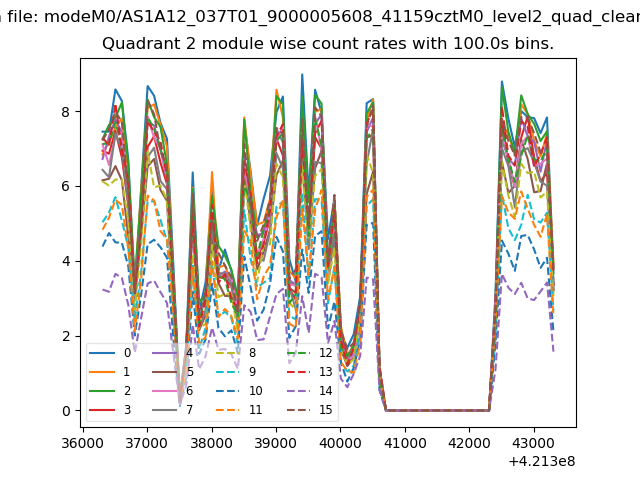
| Module-wise count rates for Quadrant B Data is divided into 100 sec bins |
 |
 |
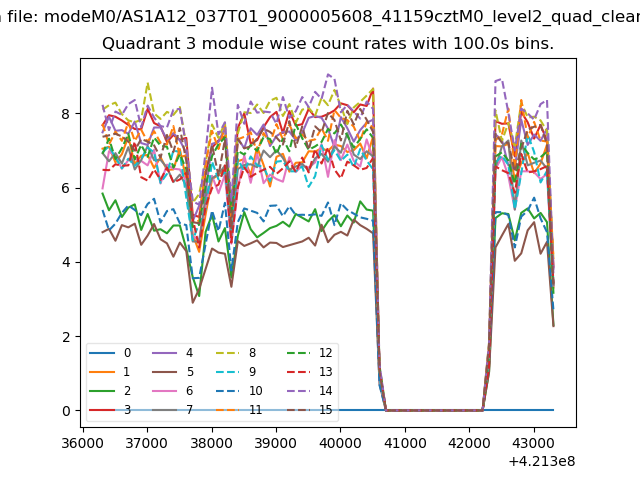
| Module-wise count rates for Quadrant C Data is divided into 100 sec bins |
 |
 |
| Module-wise count rates for Quadrant D Data is divided into 100 sec bins |
 |
 |
| Parameter | Plot |
|---|---|
| CZT HV Monitor | 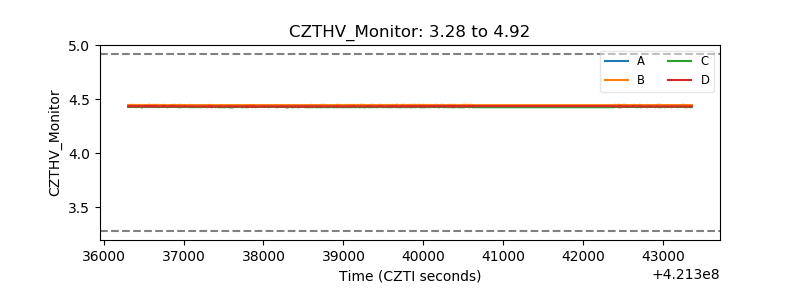 |
| D_VDD | 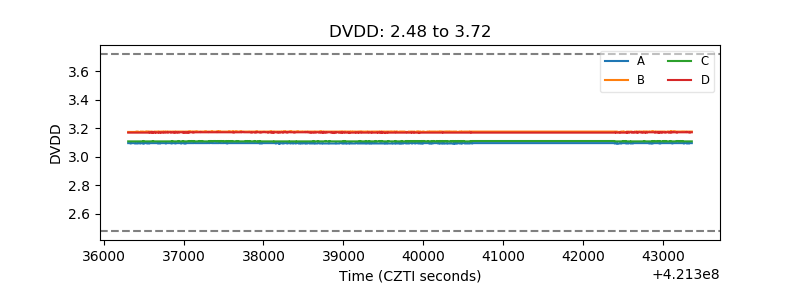 |
| Temperature 1 | 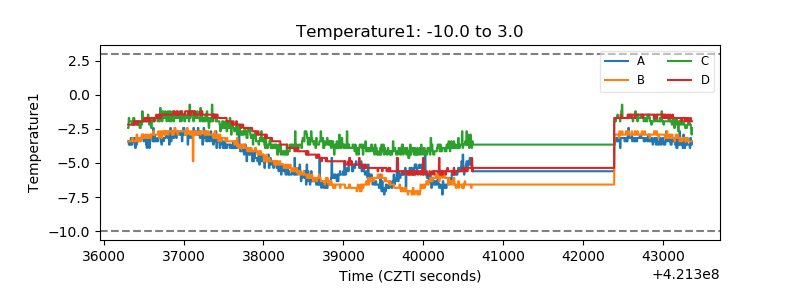 |
| Veto HV Monitor |  |
| Veto LLD | 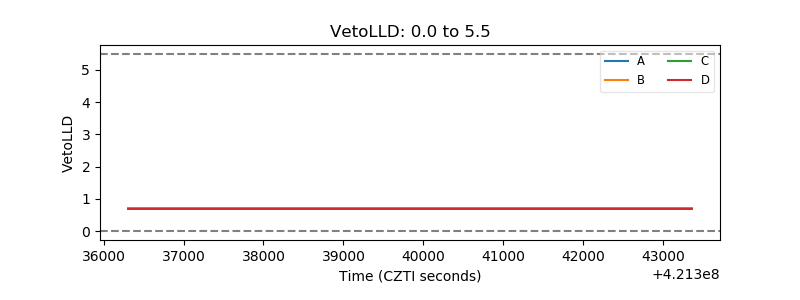 |
| Alpha Counter | 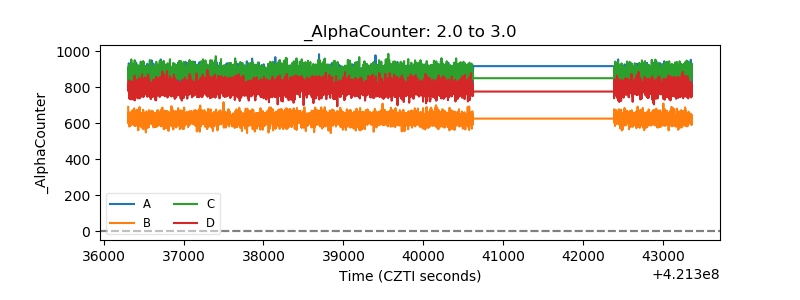 |
| _CPM_Rate | 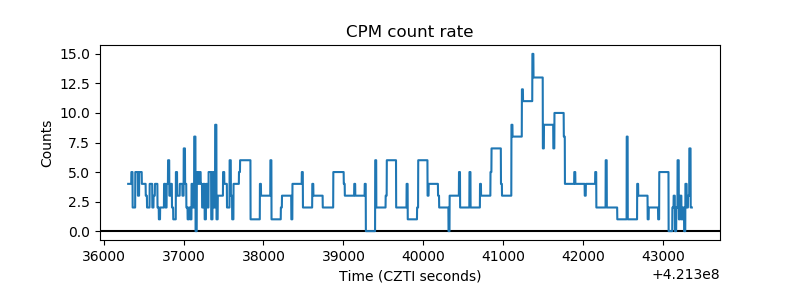 |
| CZT Counter | 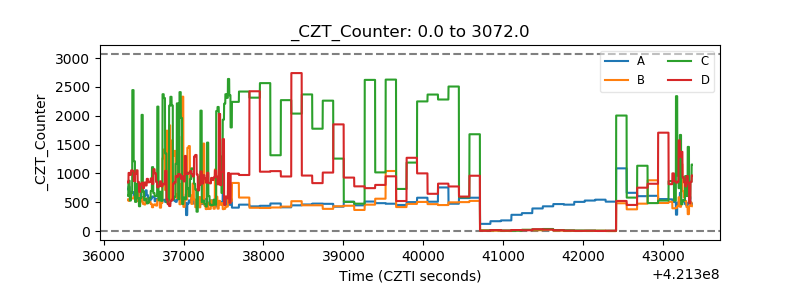 |
| +2.5 Volts monitor | 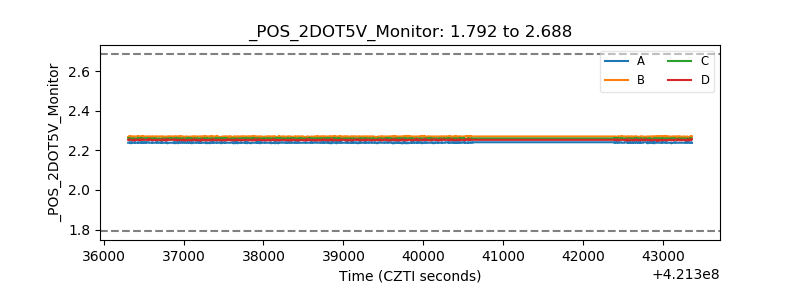 |
| +5 Volts monitor | 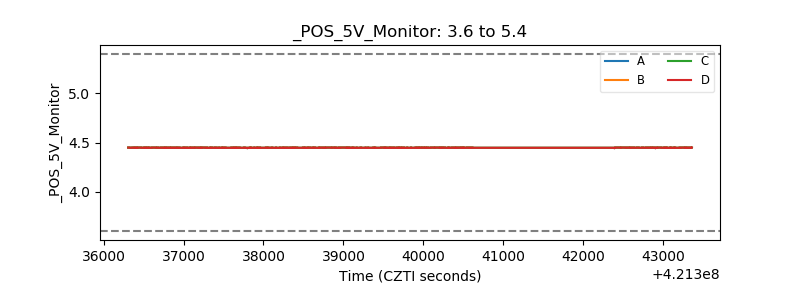 |
| _ROLL_ROT | 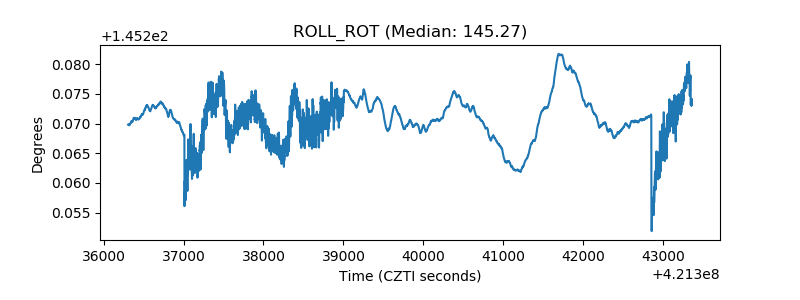 |
| _Roll_DEC | 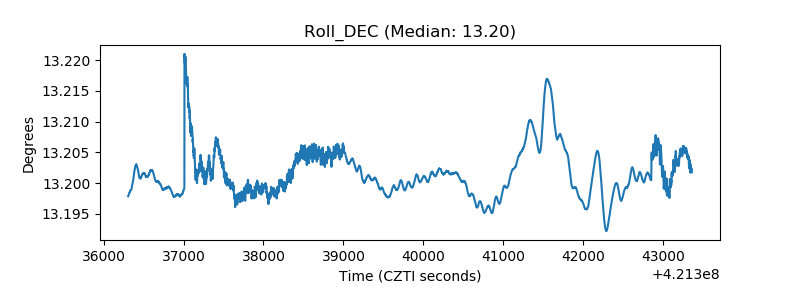 |
| _Roll_RA | 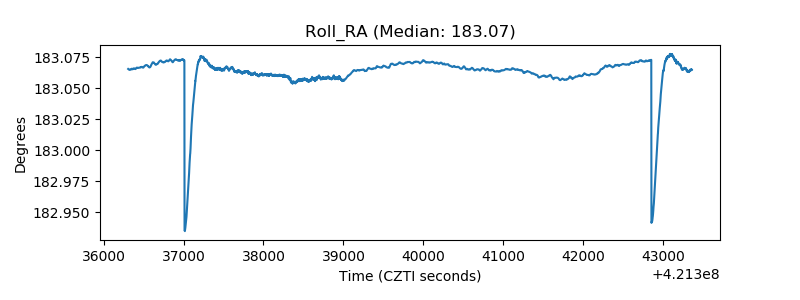 |
| Veto Counter | 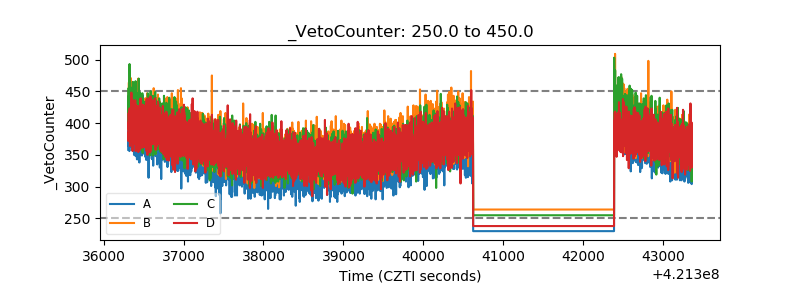 |