| Param | Original file | Final file |
|---|---|---|
| Filename | modeM0/AS1A12_037T01_9000005608_41160cztM0_level2.fits | modeM0/AS1A12_037T01_9000005608_41160cztM0_level2_quad_clean.evt |
| Size (bytes) | 447,978,240 | 91,042,560 |
| Size | 427.2 MB | 86.8 MB |
| Events in quadrant A | 2,958,503 | 632,844 |
| Events in quadrant B | 3,706,899 | 627,740 |
| Events in quadrant C | 4,837,491 | 536,193 |
| Events in quadrant D | 4,637,901 | 562,046 |
| Mode SS | |||
|---|---|---|---|
| Quadrant | BADHDUFLAG | Total packets | Discarded packets |
| A | 0 | 116 | 0 |
| B | 0 | 116 | 0 |
| C | 0 | 116 | 0 |
| D | 0 | 116 | 0 |
| Mode M0 | |||
|---|---|---|---|
| Quadrant | BADHDUFLAG | Total packets | Discarded packets |
| A | 0 | 12279 | 3 |
| B | 0 | 14949 | 2 |
| C | 0 | 18099 | 2 |
| D | 0 | 17820 | 2 |
| Mode M9 | |||
|---|---|---|---|
| Quadrant | BADHDUFLAG | Total packets | Discarded packets |
| A | 0 | 31 | 0 |
| B | 0 | 31 | 0 |
| C | 0 | 31 | 0 |
| D | 0 | 31 | 0 |
| Quadrant | Total seconds | Saturated seconds | Saturation percentage |
|---|---|---|---|
| A | 5687 | 11 | 0.193424% |
| B | 5687 | 225 | 3.956392% |
| C | 5687 | 806 | 14.172675% |
| D | 5687 | 134 | 2.356251% |
Noise dominated data is calculated using 1-second bins in cleaned event files. If a bin has >2000 counts, and if more than 50% of those come from <1% of pixels, then it is considered to be noise-dominated and hence unusable.
| Quadrant | # 1 sec bins | Bins with >0 counts | Bins with >2000 counts | High rate bins dominated by noise | Noise dominated (total time) | Noise dominated (detector-on time) | Marked lightcurve |
|---|---|---|---|---|---|---|---|
| A | 7150 | 5688 | 2 | 2 | 0.03% | 0.04% | 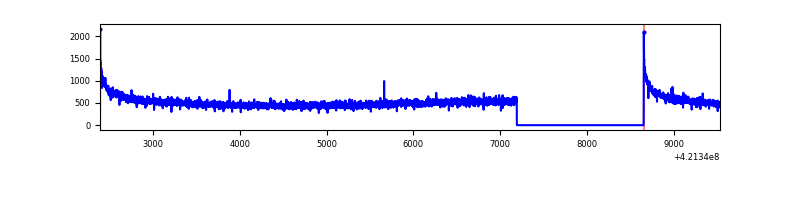 |
| B | 7150 | 5688 | 180 | 180 | 2.52% | 3.16% | 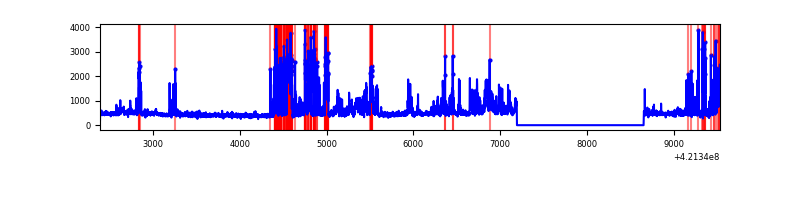 |
| C | 7150 | 5687 | 662 | 662 | 9.26% | 11.64% | 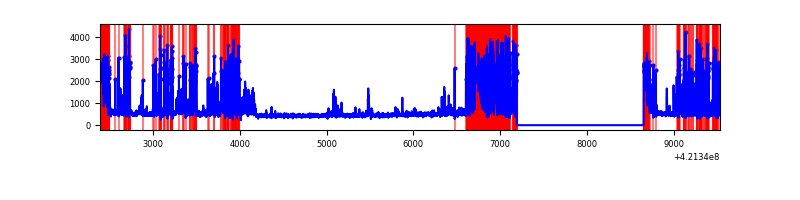 |
| D | 7150 | 5688 | 111 | 111 | 1.55% | 1.95% | 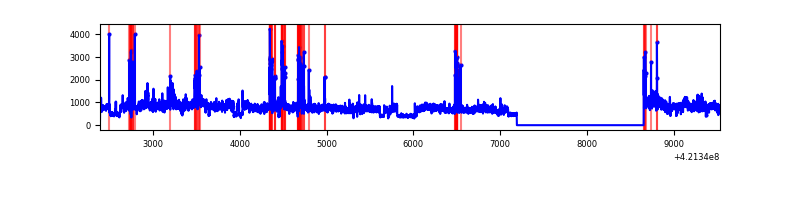 |
Top three noisy pixels from each quadrant. If the there are fewer than three noisy pixels in the level2.evt file, extra rows are filled as -1
| Pixel properties | Quadrant properties | ||||||
|---|---|---|---|---|---|---|---|
| Quadrant | DetID | PixID | Counts | Sigma | Mean | Median | Sigma |
| A | 10 | 83 | 535533 | 4147.78 | 626 | 613 | 129.0 |
| A | 13 | 254 | 9519 | 69.06 | 626 | 613 | 129.0 |
| A | 3 | 137 | 7121 | 50.46 | 626 | 613 | 129.0 |
| B | 0 | 245 | 1074283 | 8960.1 | 612 | 595 | 119.8 |
| B | 5 | 255 | 175362 | 1458.46 | 612 | 595 | 119.8 |
| B | 12 | 111 | 15047 | 120.6 | 612 | 595 | 119.8 |
| C | 9 | 54 | 2066910 | 15688.3 | 565 | 568 | 131.7 |
| C | 15 | 214 | 227851 | 1725.6 | 565 | 568 | 131.7 |
| C | 0 | 10 | 181119 | 1370.8 | 565 | 568 | 131.7 |
| D | 2 | 16 | 1842092 | 12390.05 | 603 | 586 | 148.6 |
| D | 13 | 249 | 279050 | 1873.56 | 603 | 586 | 148.6 |
| D | 2 | 249 | 155824 | 1044.47 | 603 | 586 | 148.6 |
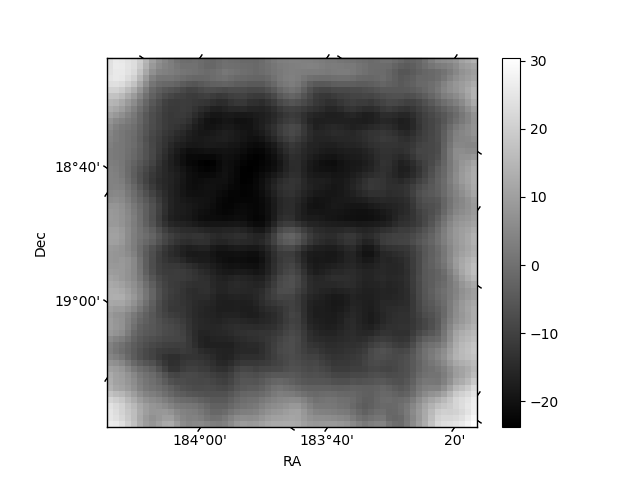
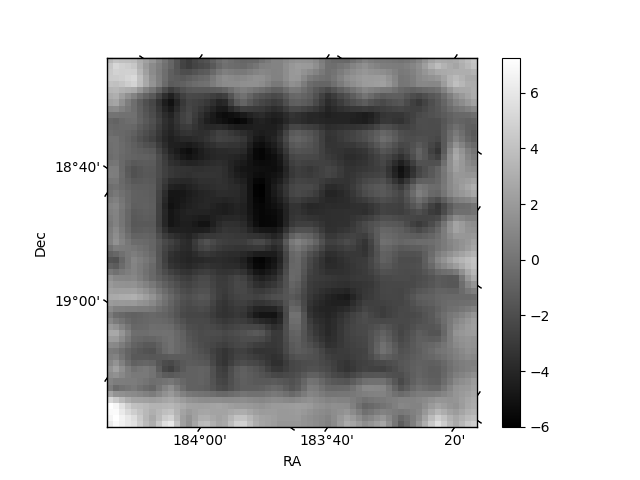
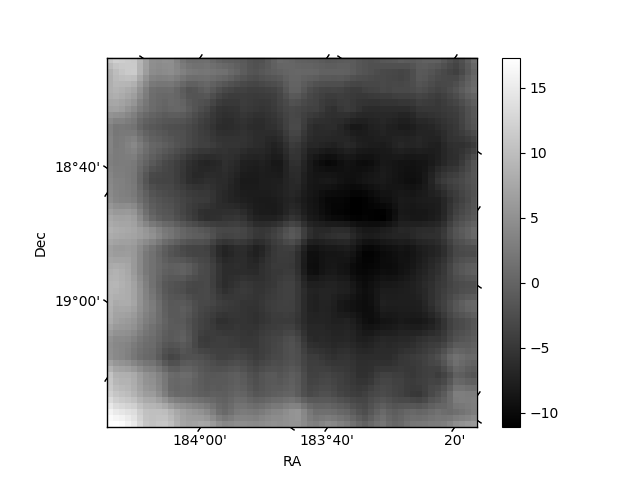
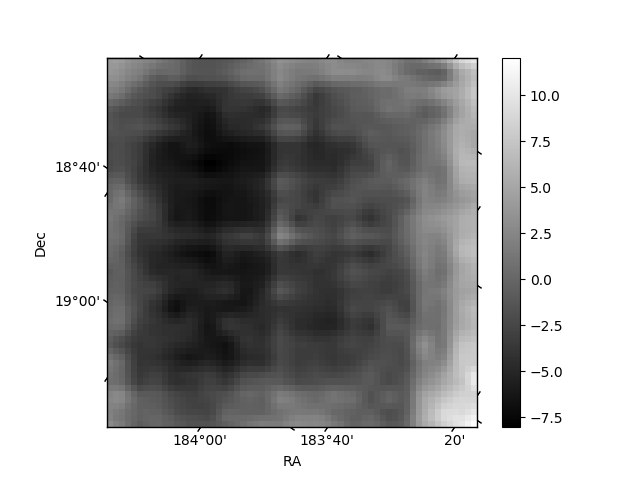
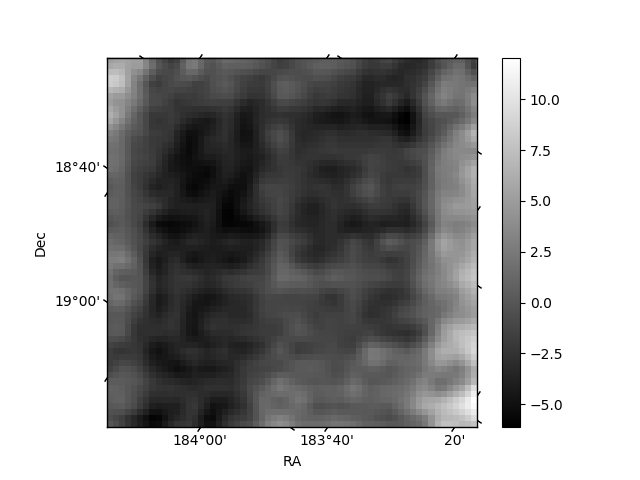
Histogram calculated using DETX and DETY for each event in the final _common_clean file
| Quadrant A | 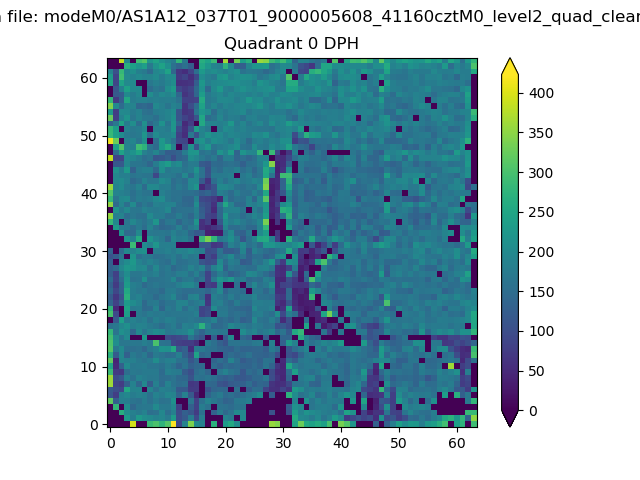 |
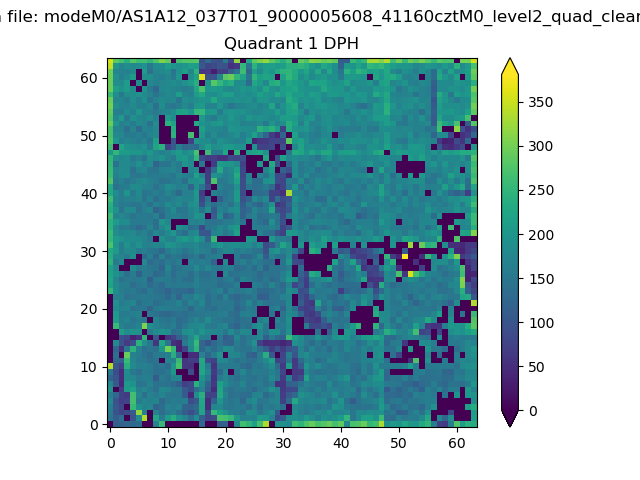 |
Quadrant B |
|---|---|---|---|
| Quadrant D | 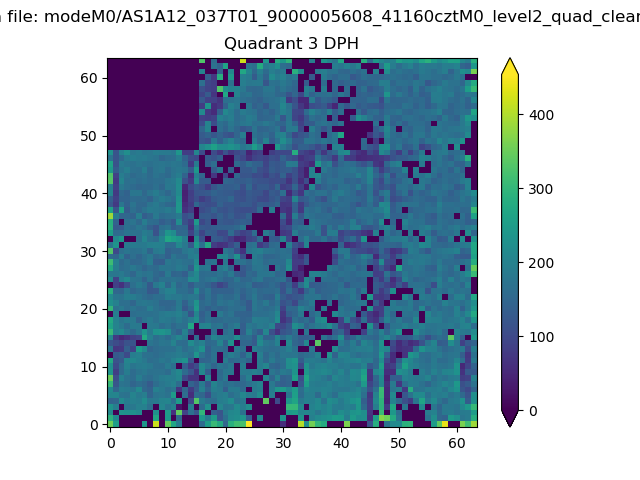 |
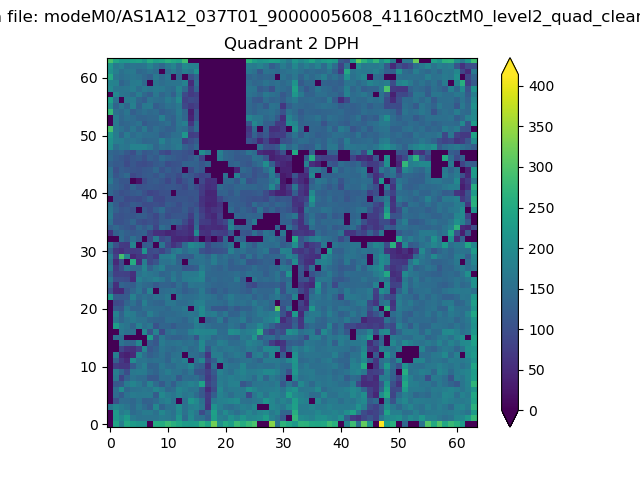 |
Quadrant C |
| Plot type | Count rate plots | Images |
|---|---|---|
| Comparison with Poisson distribution Blue bars denote a histogram of data divided into 1 sec bins. Red curve is a Poisson curve with rate = median count rate of data. |
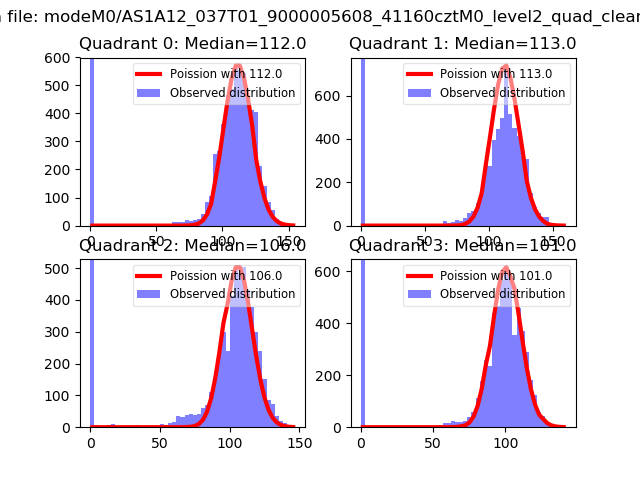 |
 |
| Quadrant-wise count rates Data is divided into 100 sec bins |
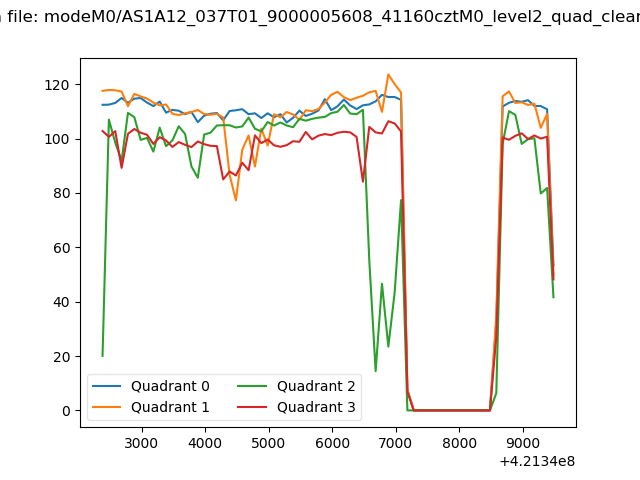 |
|
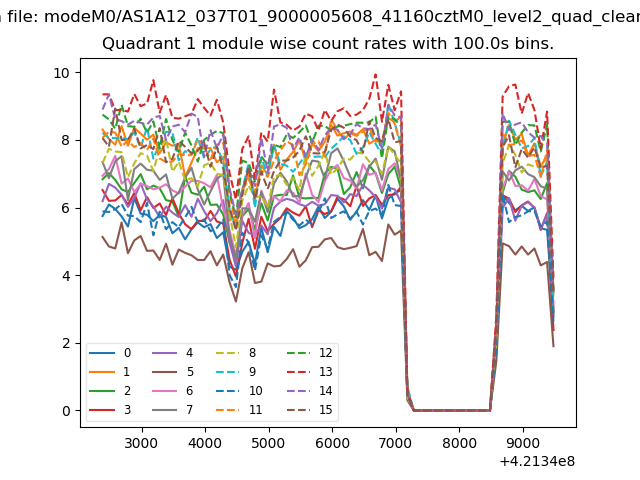
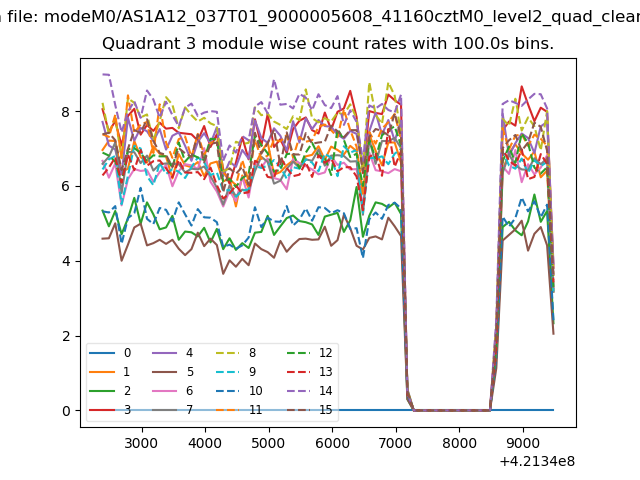
| Module-wise count rates for Quadrant A Data is divided into 100 sec bins |
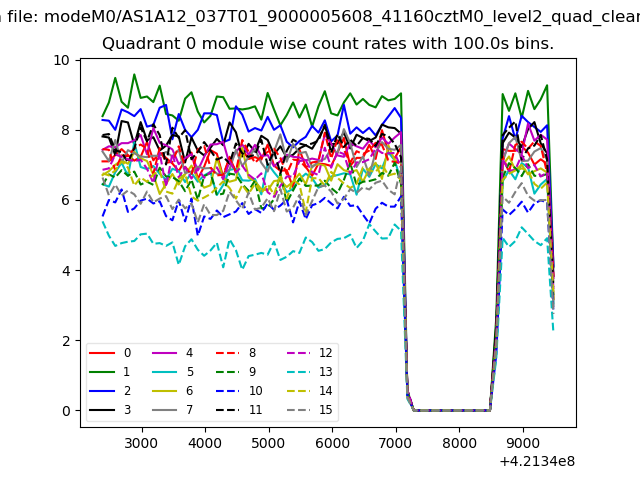 |
 |
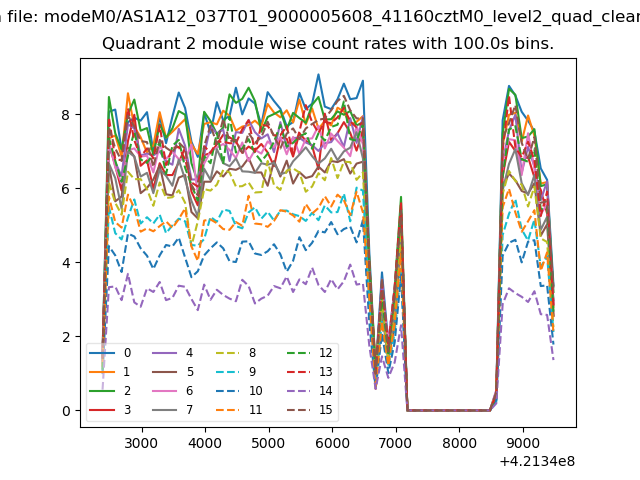
| Module-wise count rates for Quadrant B Data is divided into 100 sec bins |
 |
 |
| Module-wise count rates for Quadrant C Data is divided into 100 sec bins |
 |
 |
| Module-wise count rates for Quadrant D Data is divided into 100 sec bins |
 |
 |
| Parameter | Plot |
|---|---|
| CZT HV Monitor | 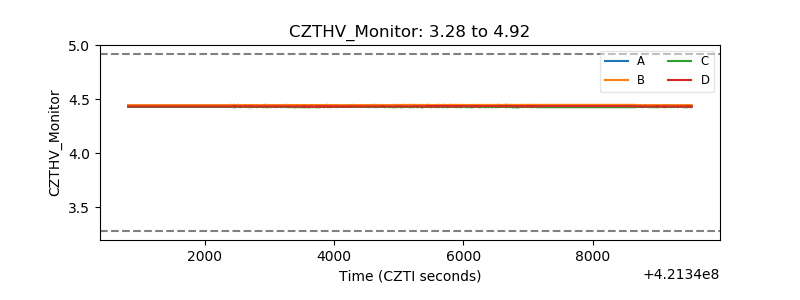 |
| D_VDD | 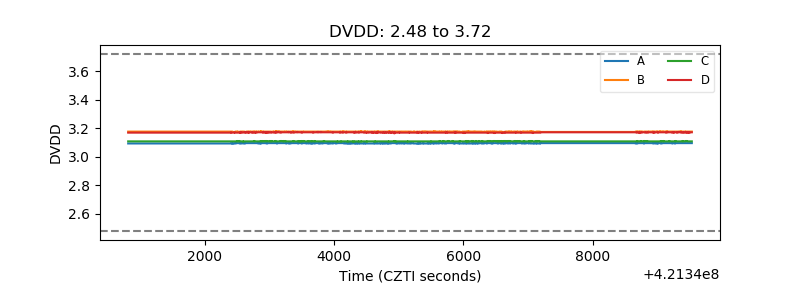 |
| Temperature 1 | 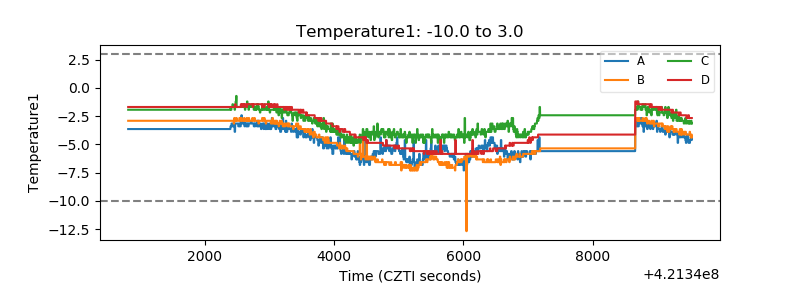 |
| Veto HV Monitor | 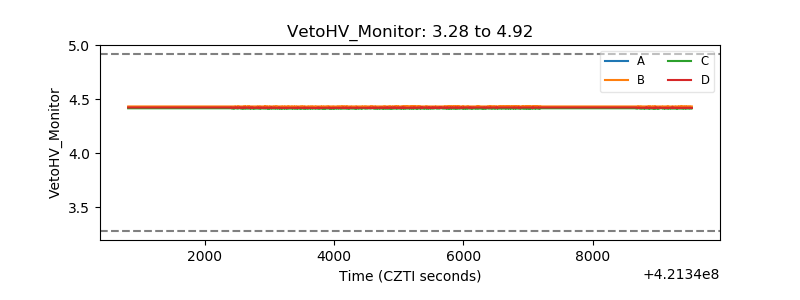 |
| Veto LLD | 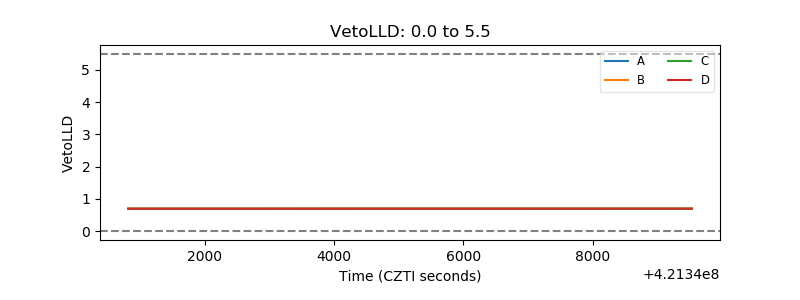 |
| Alpha Counter | 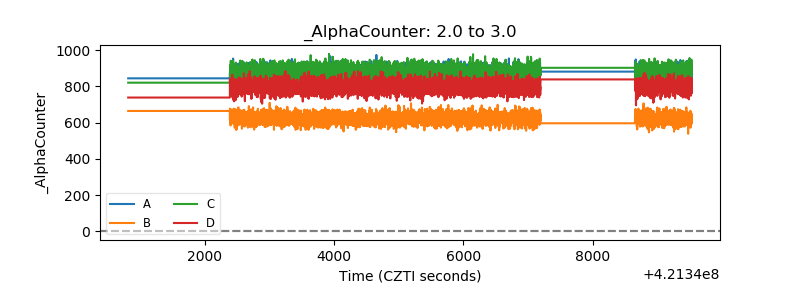 |
| _CPM_Rate | 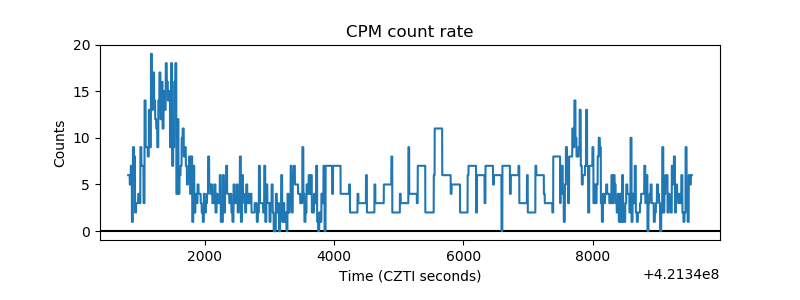 |
| CZT Counter | 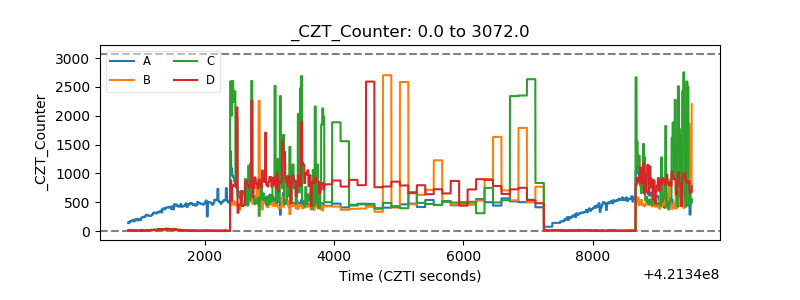 |
| +2.5 Volts monitor | 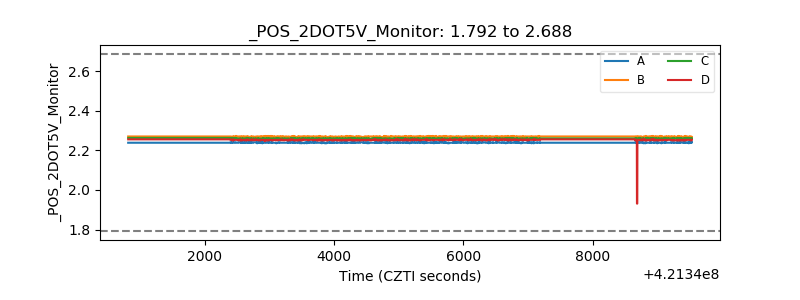 |
| +5 Volts monitor | 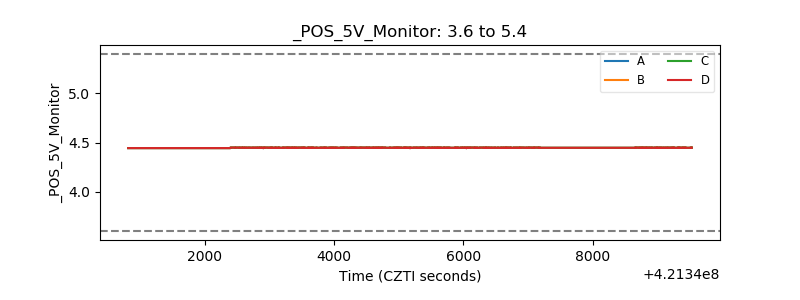 |
| _ROLL_ROT | 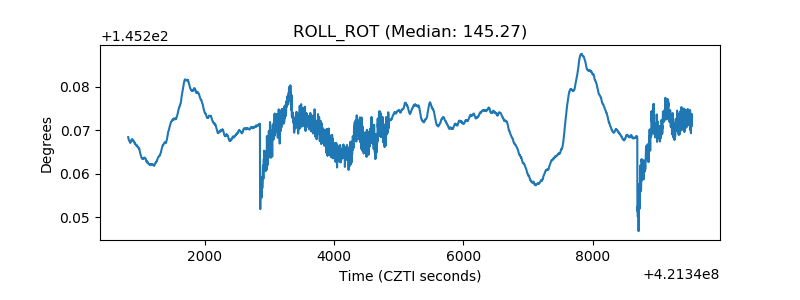 |
| _Roll_DEC | 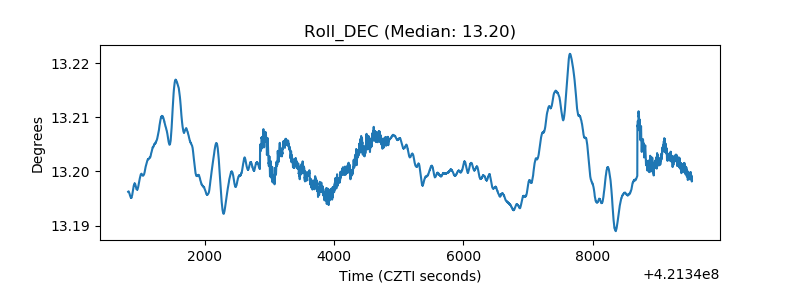 |
| _Roll_RA | 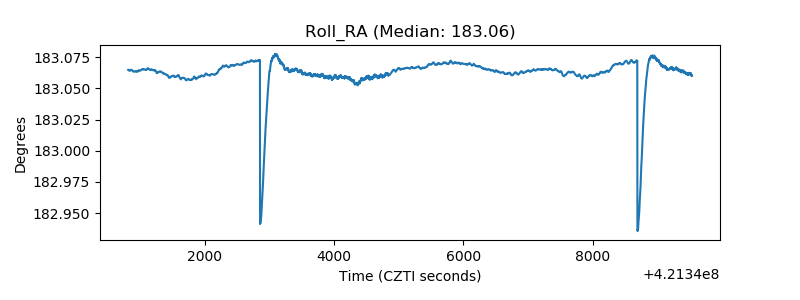 |
| Veto Counter | 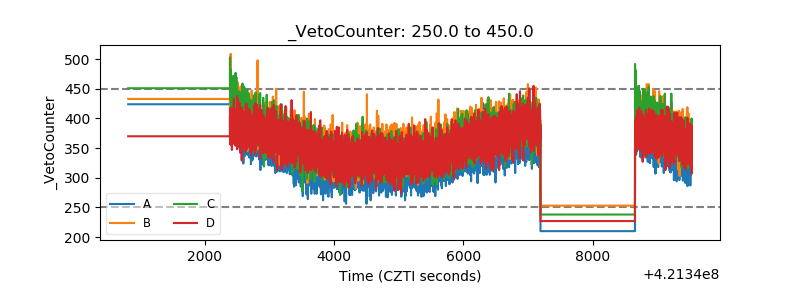 |