| Param | Original file | Final file |
|---|---|---|
| Filename | modeM0/AS1A12_037T01_9000005608_41161cztM0_level2.fits | modeM0/AS1A12_037T01_9000005608_41161cztM0_level2_quad_clean.evt |
| Size (bytes) | 406,342,080 | 95,535,360 |
| Size | 387.5 MB | 91.1 MB |
| Events in quadrant A | 3,052,680 | 646,237 |
| Events in quadrant B | 3,318,764 | 649,020 |
| Events in quadrant C | 3,589,078 | 607,017 |
| Events in quadrant D | 4,625,609 | 580,915 |
| Mode SS | |||
|---|---|---|---|
| Quadrant | BADHDUFLAG | Total packets | Discarded packets |
| A | 0 | 120 | 0 |
| B | 0 | 120 | 0 |
| C | 0 | 120 | 0 |
| D | 0 | 120 | 0 |
| Mode M0 | |||
|---|---|---|---|
| Quadrant | BADHDUFLAG | Total packets | Discarded packets |
| A | 0 | 12694 | 3 |
| B | 0 | 13806 | 2 |
| C | 0 | 14421 | 2 |
| D | 0 | 18001 | 2 |
| Mode M9 | |||
|---|---|---|---|
| Quadrant | BADHDUFLAG | Total packets | Discarded packets |
| A | 0 | 24 | 0 |
| B | 0 | 24 | 0 |
| C | 0 | 24 | 0 |
| D | 0 | 25 | 0 |
| Quadrant | Total seconds | Saturated seconds | Saturation percentage |
|---|---|---|---|
| A | 5859 | 10 | 0.170678% |
| B | 5859 | 143 | 2.440690% |
| C | 5859 | 208 | 3.550094% |
| D | 5859 | 36 | 0.614439% |
Noise dominated data is calculated using 1-second bins in cleaned event files. If a bin has >2000 counts, and if more than 50% of those come from <1% of pixels, then it is considered to be noise-dominated and hence unusable.
| Quadrant | # 1 sec bins | Bins with >0 counts | Bins with >2000 counts | High rate bins dominated by noise | Noise dominated (total time) | Noise dominated (detector-on time) | Marked lightcurve |
|---|---|---|---|---|---|---|---|
| A | 7171 | 5860 | 3 | 3 | 0.04% | 0.05% | 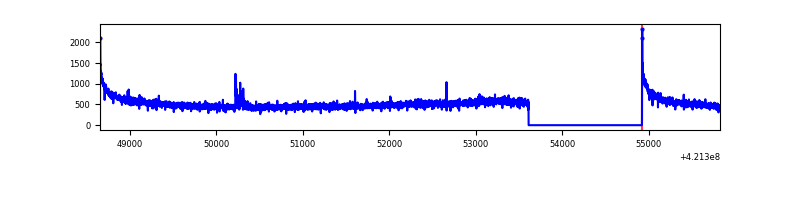 |
| B | 7171 | 5860 | 122 | 122 | 1.70% | 2.08% | 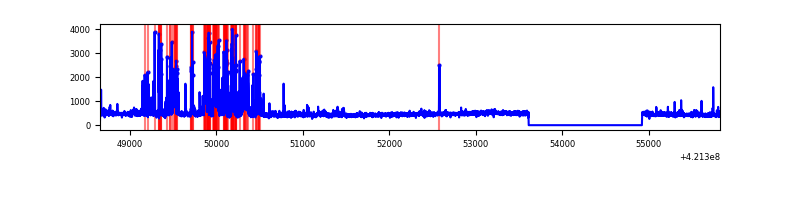 |
| C | 7171 | 5860 | 181 | 181 | 2.52% | 3.09% | 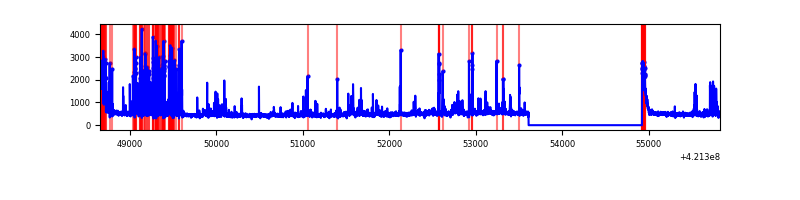 |
| D | 7171 | 5860 | 31 | 31 | 0.43% | 0.53% | 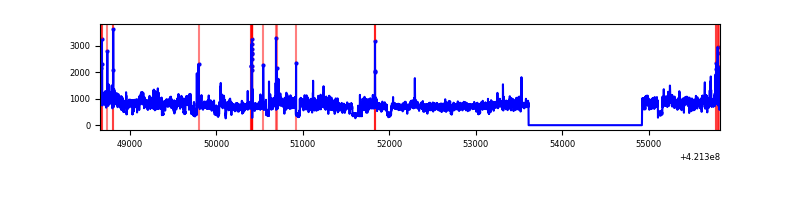 |
Top three noisy pixels from each quadrant. If the there are fewer than three noisy pixels in the level2.evt file, extra rows are filled as -1
| Pixel properties | Quadrant properties | ||||||
|---|---|---|---|---|---|---|---|
| Quadrant | DetID | PixID | Counts | Sigma | Mean | Median | Sigma |
| A | 10 | 83 | 545625 | 4071.98 | 642 | 628 | 133.8 |
| A | 6 | 10 | 18760 | 135.47 | 642 | 628 | 133.8 |
| A | 13 | 254 | 9564 | 66.77 | 642 | 628 | 133.8 |
| B | 0 | 245 | 503485 | 4064.64 | 630 | 610 | 123.7 |
| B | 5 | 255 | 231894 | 1869.43 | 630 | 610 | 123.7 |
| B | 0 | 190 | 54374 | 434.56 | 630 | 610 | 123.7 |
| C | 9 | 54 | 537828 | 3714.27 | 613 | 616 | 144.6 |
| C | 15 | 214 | 248348 | 1712.81 | 613 | 616 | 144.6 |
| C | 0 | 10 | 199894 | 1377.8 | 613 | 616 | 144.6 |
| D | 2 | 16 | 2033702 | 13151.24 | 621 | 601 | 154.6 |
| D | 13 | 249 | 142026 | 914.82 | 621 | 601 | 154.6 |
| D | 2 | 249 | 59334 | 379.92 | 621 | 601 | 154.6 |
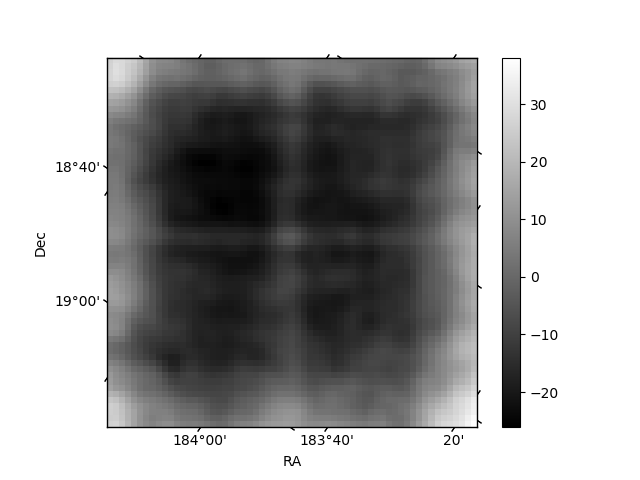
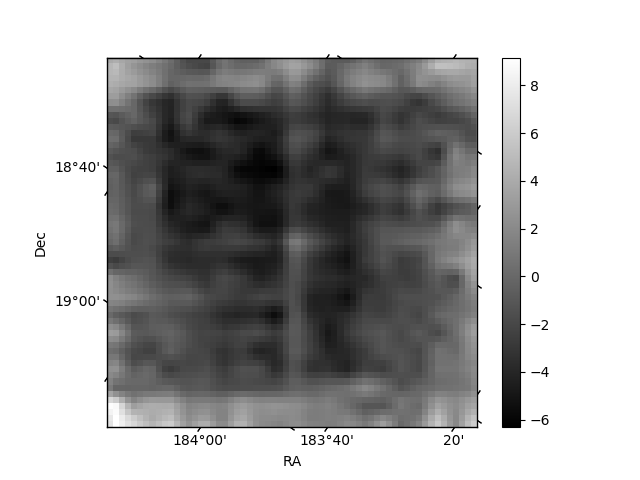
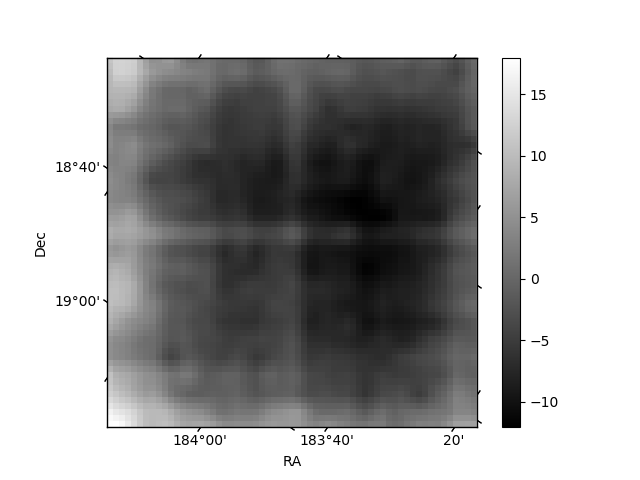
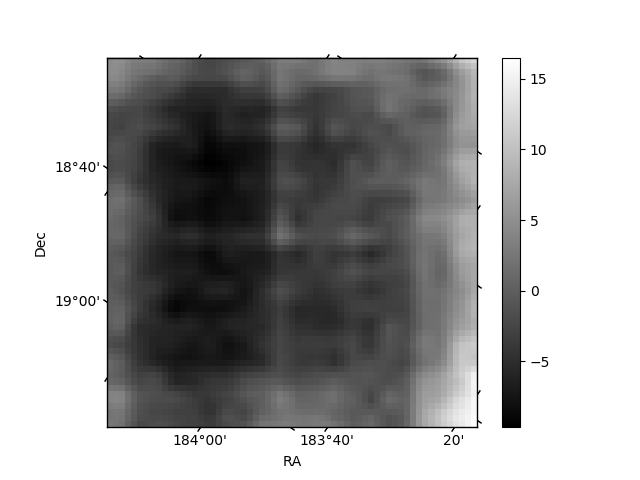
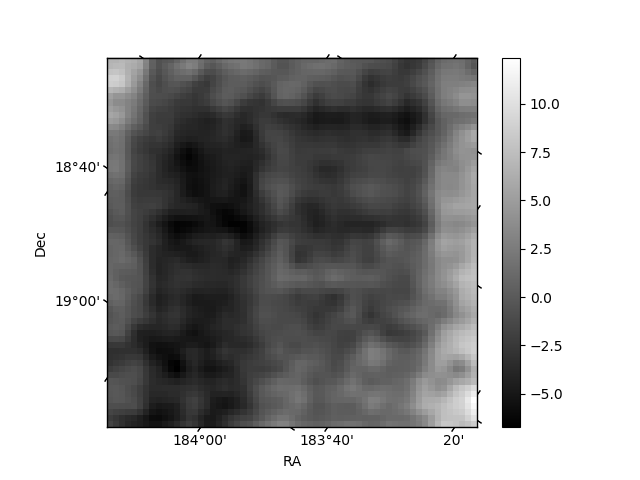
Histogram calculated using DETX and DETY for each event in the final _common_clean file
| Quadrant A | 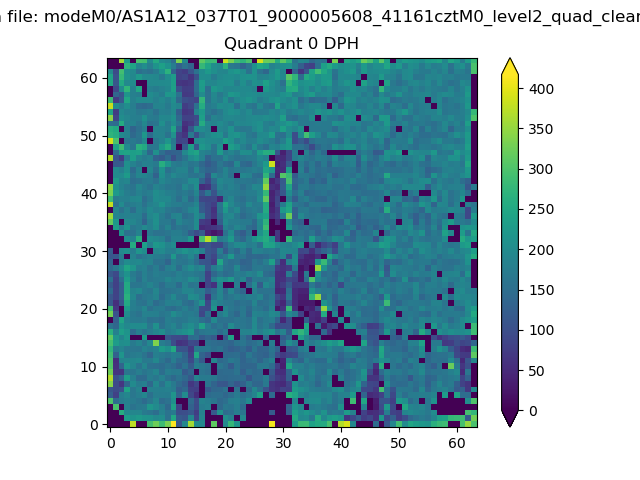 |
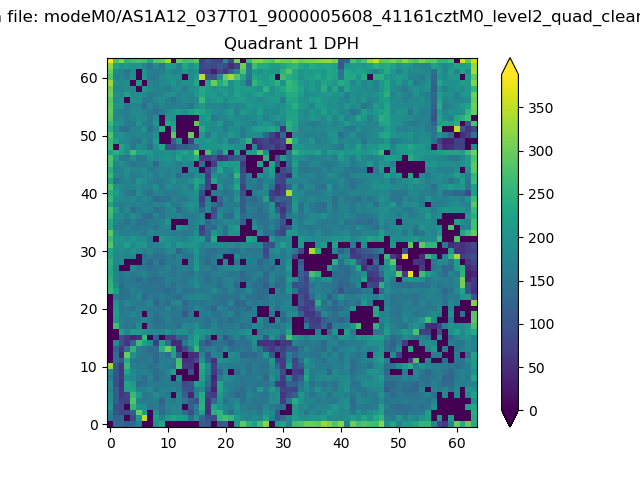 |
Quadrant B |
|---|---|---|---|
| Quadrant D | 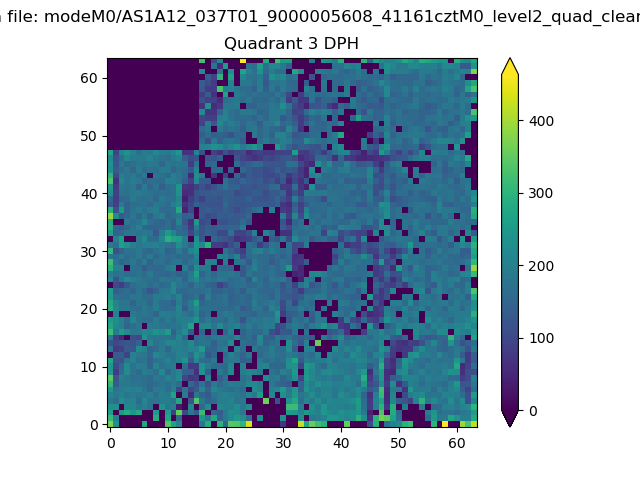 |
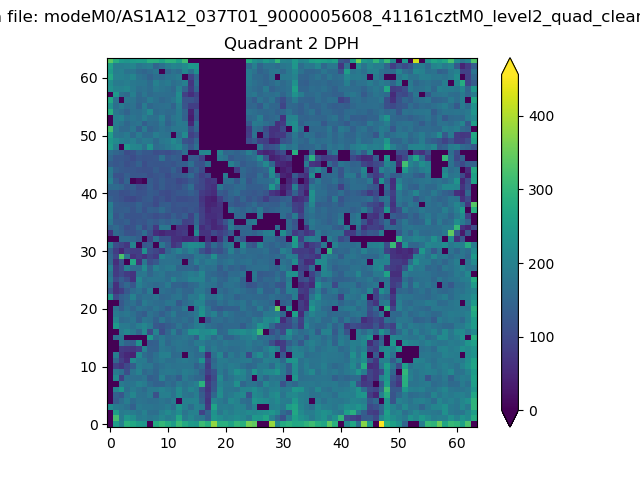 |
Quadrant C |
| Plot type | Count rate plots | Images |
|---|---|---|
| Comparison with Poisson distribution Blue bars denote a histogram of data divided into 1 sec bins. Red curve is a Poisson curve with rate = median count rate of data. |
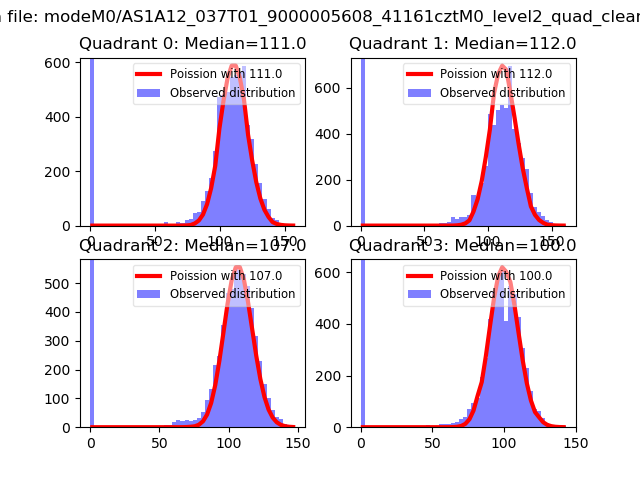 |
 |
| Quadrant-wise count rates Data is divided into 100 sec bins |
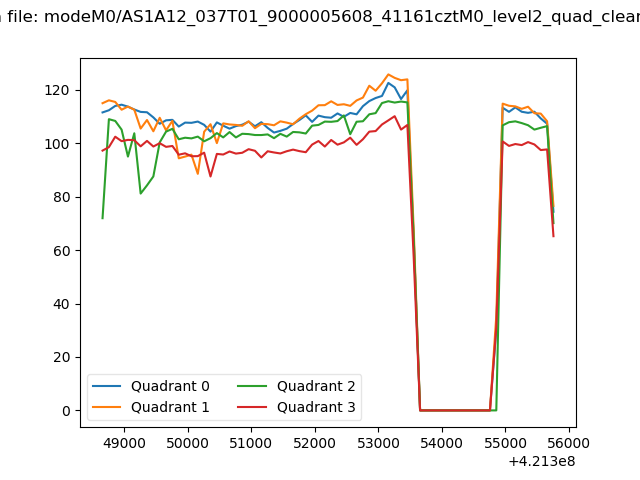 |
|
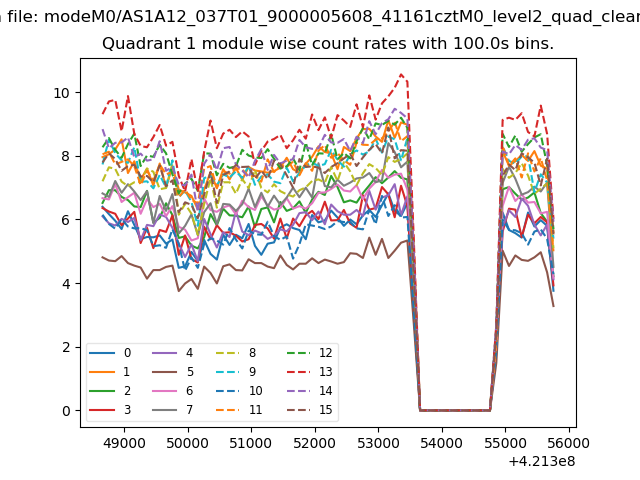
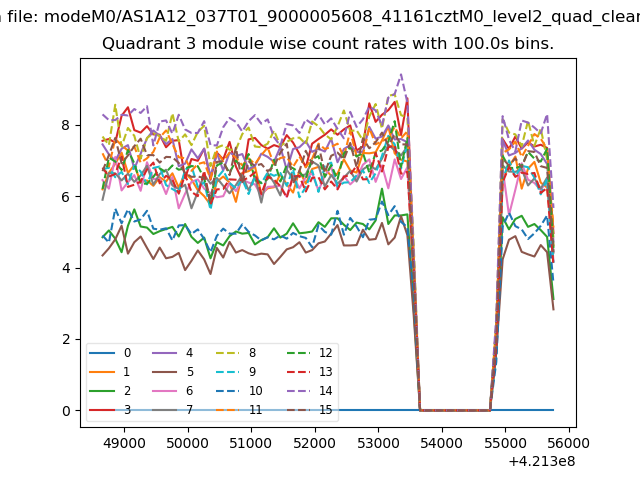
| Module-wise count rates for Quadrant A Data is divided into 100 sec bins |
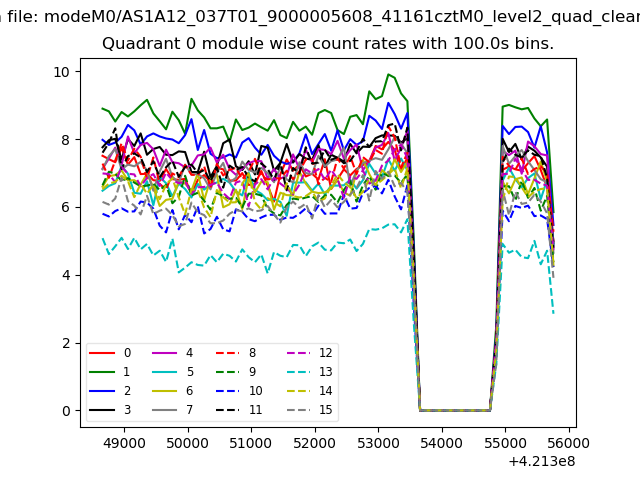 |
 |
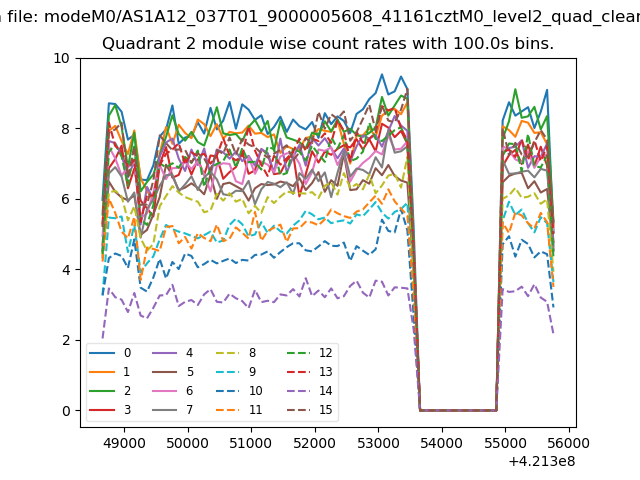
| Module-wise count rates for Quadrant B Data is divided into 100 sec bins |
 |
 |
| Module-wise count rates for Quadrant C Data is divided into 100 sec bins |
 |
 |
| Module-wise count rates for Quadrant D Data is divided into 100 sec bins |
 |
 |
| Parameter | Plot |
|---|---|
| CZT HV Monitor | 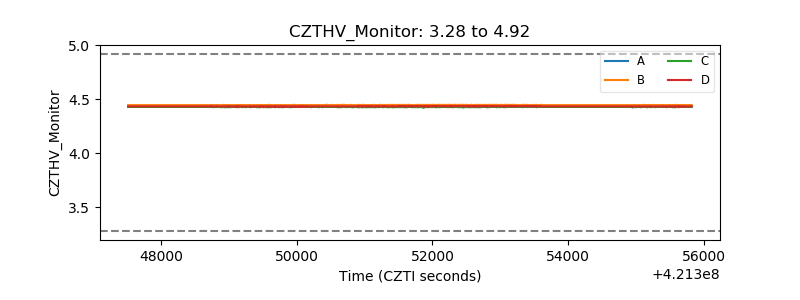 |
| D_VDD |  |
| Temperature 1 | 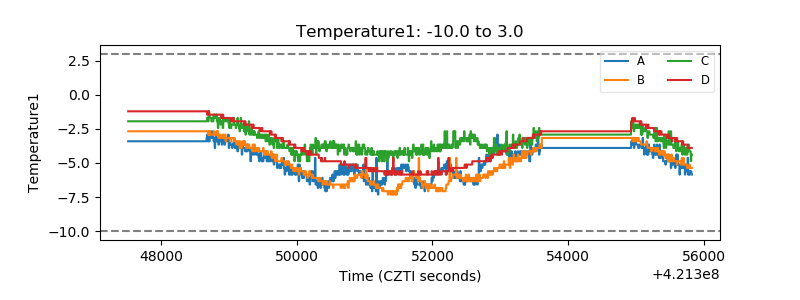 |
| Veto HV Monitor | 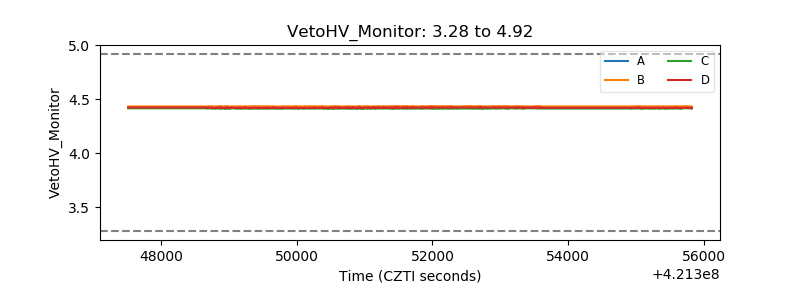 |
| Veto LLD | 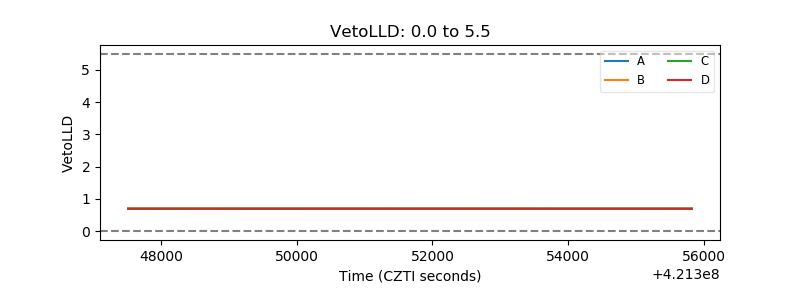 |
| Alpha Counter | 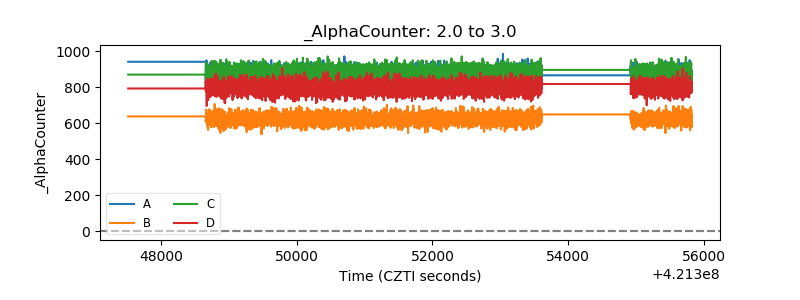 |
| _CPM_Rate | 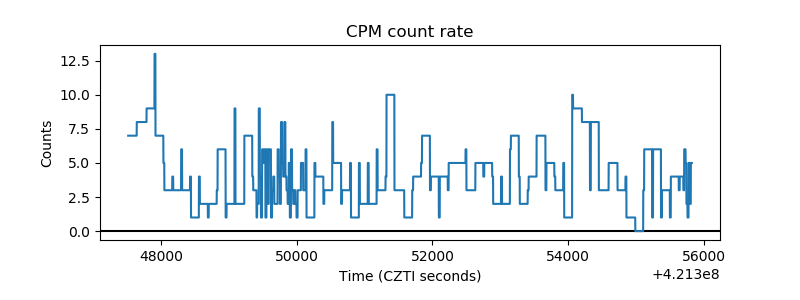 |
| CZT Counter | 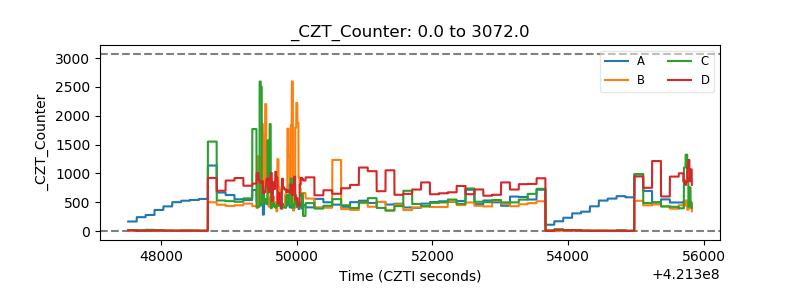 |
| +2.5 Volts monitor | 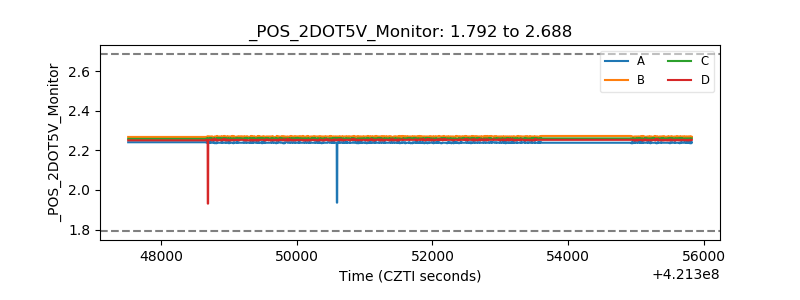 |
| +5 Volts monitor | 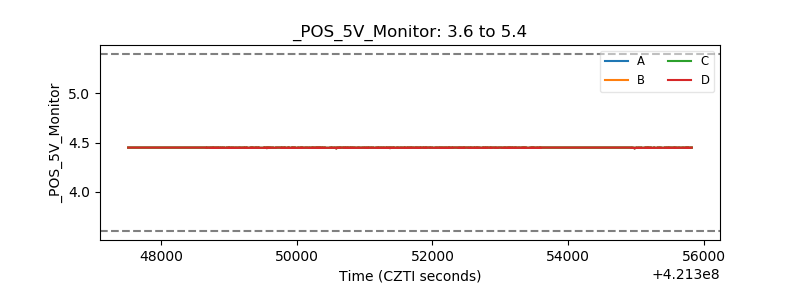 |
| _ROLL_ROT | 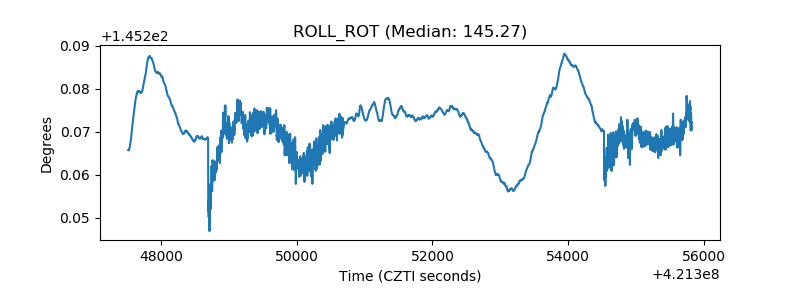 |
| _Roll_DEC | 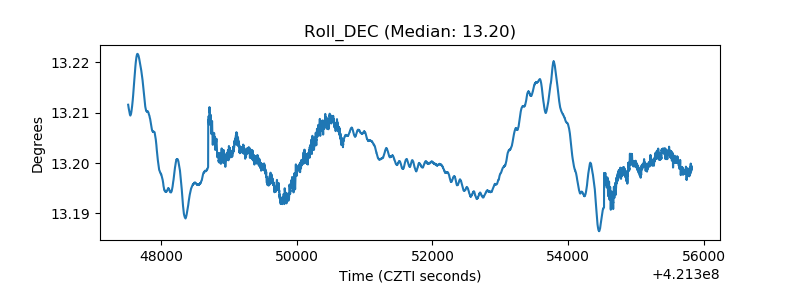 |
| _Roll_RA | 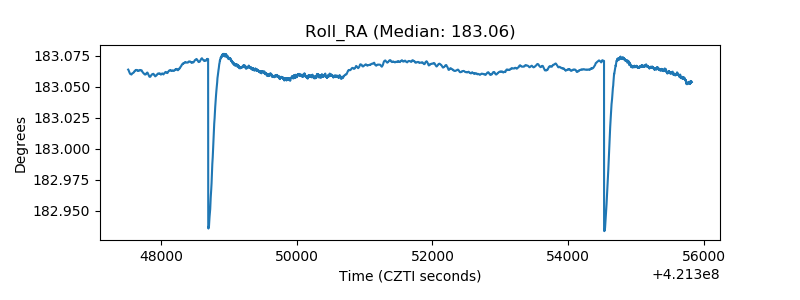 |
| Veto Counter | 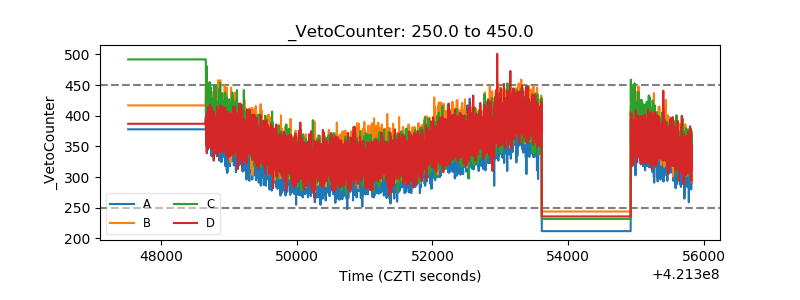 |