| Param | Original file | Final file |
|---|---|---|
| Filename | modeM0/AS1A12_037T01_9000005608_41165cztM0_level2.fits | modeM0/AS1A12_037T01_9000005608_41165cztM0_level2_quad_clean.evt |
| Size (bytes) | 948,038,400 | 246,188,160 |
| Size | 904.1 MB | 234.8 MB |
| Events in quadrant A | 7,980,855 | 1,648,015 |
| Events in quadrant B | 7,447,567 | 1,683,969 |
| Events in quadrant C | 8,322,883 | 1,574,402 |
| Events in quadrant D | 10,151,192 | 1,487,038 |
| Mode SS | |||
|---|---|---|---|
| Quadrant | BADHDUFLAG | Total packets | Discarded packets |
| A | 0 | 312 | 0 |
| B | 0 | 312 | 0 |
| C | 0 | 312 | 0 |
| D | 0 | 312 | 0 |
| Mode M0 | |||
|---|---|---|---|
| Quadrant | BADHDUFLAG | Total packets | Discarded packets |
| A | 0 | 33211 | 4 |
| B | 0 | 33064 | 4 |
| C | 0 | 34957 | 4 |
| D | 0 | 41188 | 4 |
| Mode M9 | |||
|---|---|---|---|
| Quadrant | BADHDUFLAG | Total packets | Discarded packets |
| A | 0 | 54 | 0 |
| B | 0 | 54 | 0 |
| C | 0 | 54 | 0 |
| D | 0 | 54 | 0 |
| Quadrant | Total seconds | Saturated seconds | Saturation percentage |
|---|---|---|---|
| A | 15377 | 37 | 0.240619% |
| B | 15377 | 96 | 0.624309% |
| C | 15377 | 328 | 2.133056% |
| D | 15377 | 173 | 1.125057% |
Noise dominated data is calculated using 1-second bins in cleaned event files. If a bin has >2000 counts, and if more than 50% of those come from <1% of pixels, then it is considered to be noise-dominated and hence unusable.
| Quadrant | # 1 sec bins | Bins with >0 counts | Bins with >2000 counts | High rate bins dominated by noise | Noise dominated (total time) | Noise dominated (detector-on time) | Marked lightcurve |
|---|---|---|---|---|---|---|---|
| A | 19555 | 15380 | 11 | 11 | 0.06% | 0.07% | 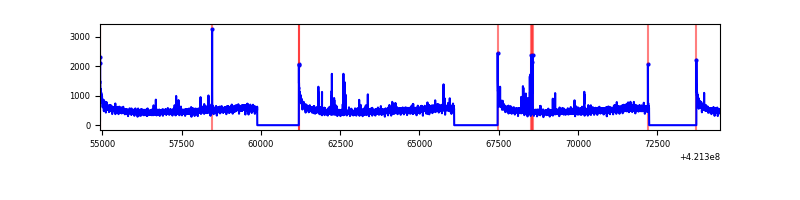 |
| B | 19555 | 15380 | 59 | 59 | 0.30% | 0.38% | 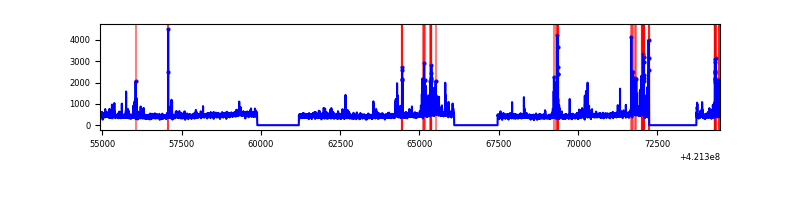 |
| C | 19555 | 15380 | 253 | 253 | 1.29% | 1.64% | 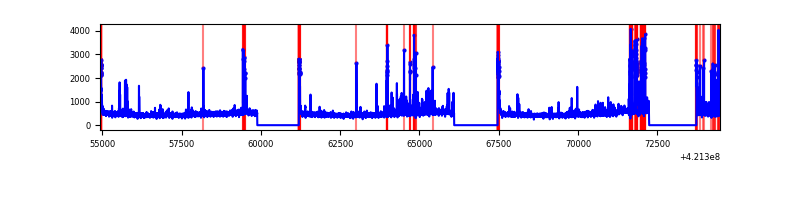 |
| D | 19555 | 15380 | 160 | 160 | 0.82% | 1.04% | 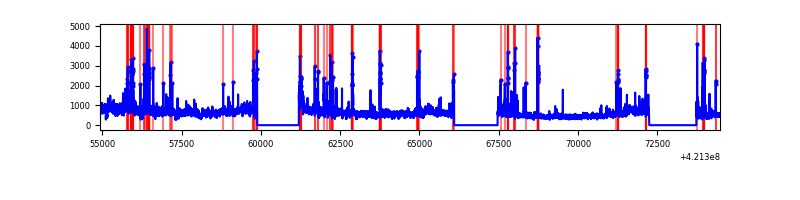 |
Top three noisy pixels from each quadrant. If the there are fewer than three noisy pixels in the level2.evt file, extra rows are filled as -1
| Pixel properties | Quadrant properties | ||||||
|---|---|---|---|---|---|---|---|
| Quadrant | DetID | PixID | Counts | Sigma | Mean | Median | Sigma |
| A | 10 | 83 | 1281800 | 3712.46 | 1688 | 1654 | 344.8 |
| A | 7 | 3 | 136756 | 391.8 | 1688 | 1654 | 344.8 |
| A | 13 | 254 | 27127 | 73.87 | 1688 | 1654 | 344.8 |
| B | 0 | 245 | 424402 | 1305.53 | 1668 | 1620 | 323.8 |
| B | 5 | 255 | 283995 | 871.96 | 1668 | 1620 | 323.8 |
| B | 0 | 229 | 109367 | 332.72 | 1668 | 1620 | 323.8 |
| C | 9 | 54 | 850795 | 2234.1 | 1627 | 1639 | 380.1 |
| C | 15 | 214 | 650332 | 1706.69 | 1627 | 1639 | 380.1 |
| C | 0 | 10 | 308858 | 808.28 | 1627 | 1639 | 380.1 |
| D | 2 | 16 | 2998063 | 7567.82 | 1628 | 1585 | 395.9 |
| D | 13 | 249 | 683970 | 1723.41 | 1628 | 1585 | 395.9 |
| D | 2 | 249 | 101668 | 252.77 | 1628 | 1585 | 395.9 |
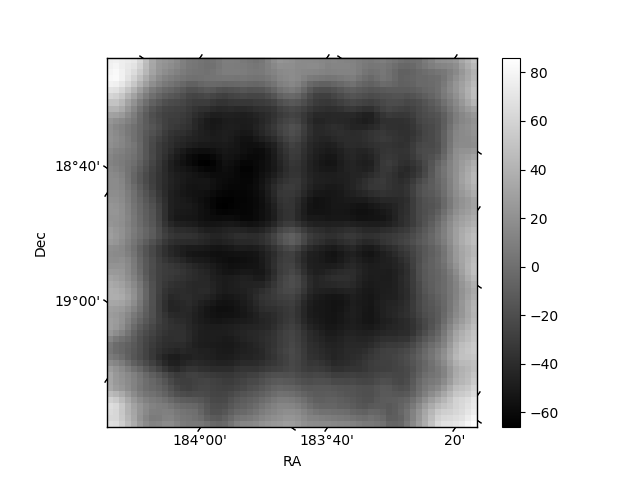
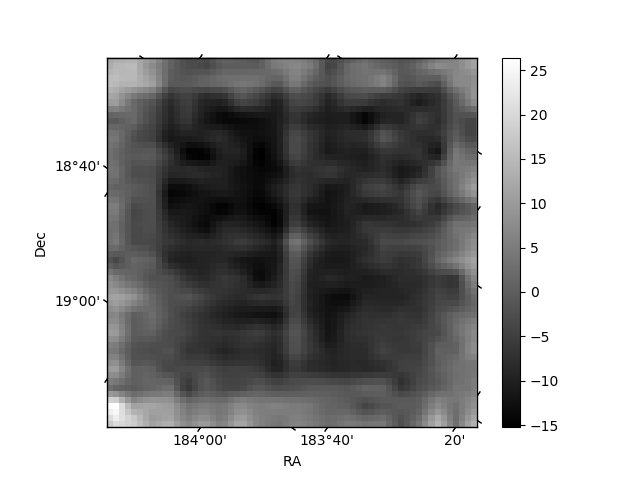
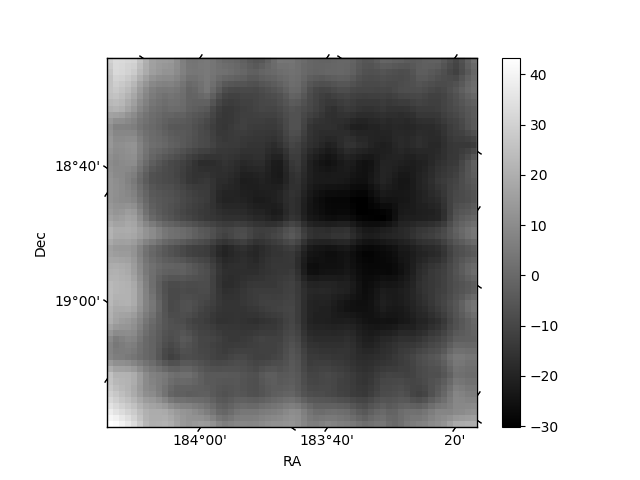
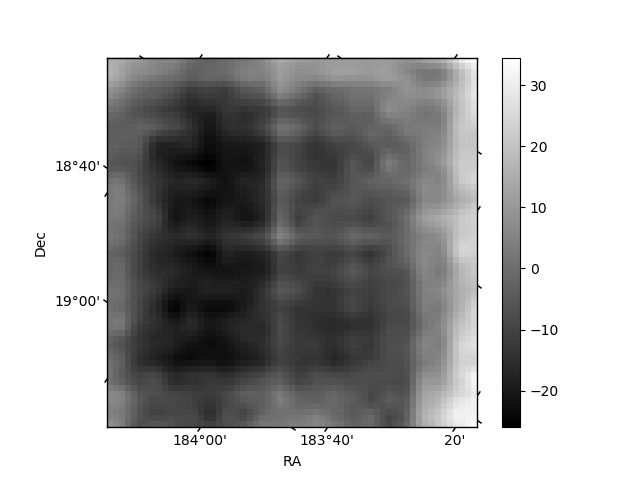
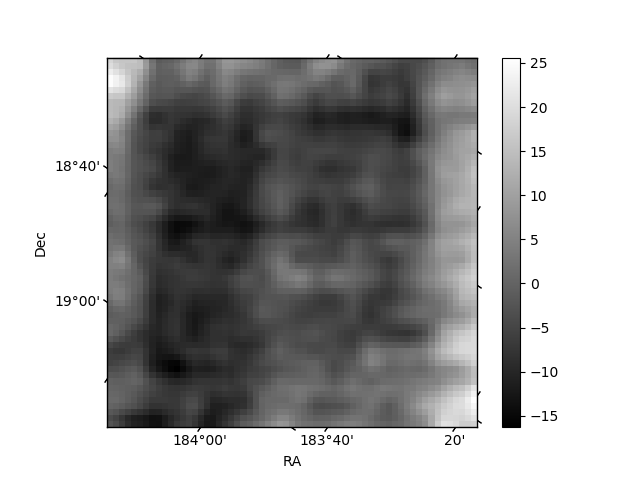
Histogram calculated using DETX and DETY for each event in the final _common_clean file
| Quadrant A | 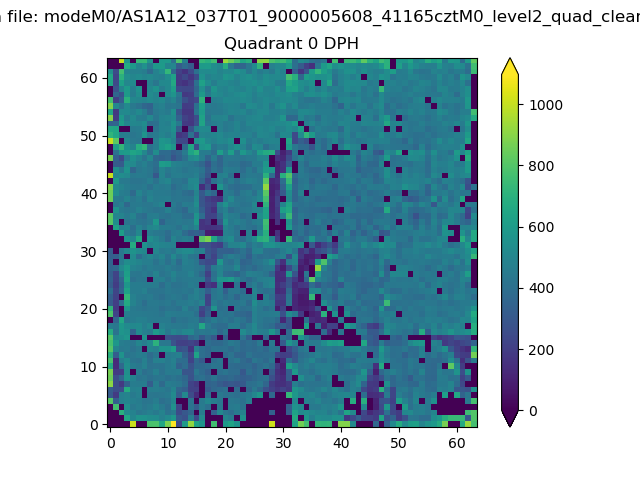 |
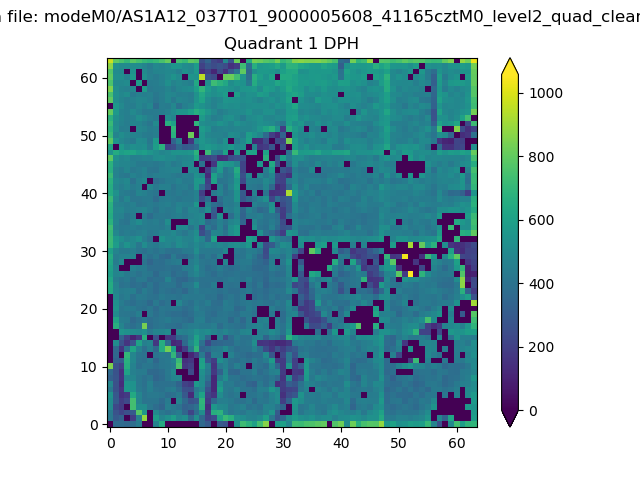 |
Quadrant B |
|---|---|---|---|
| Quadrant D | 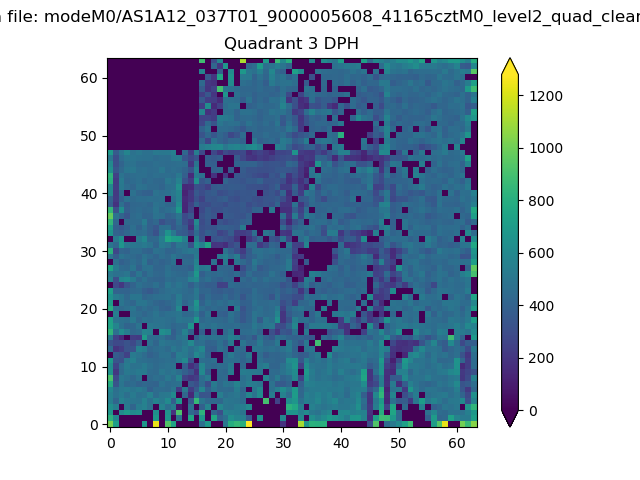 |
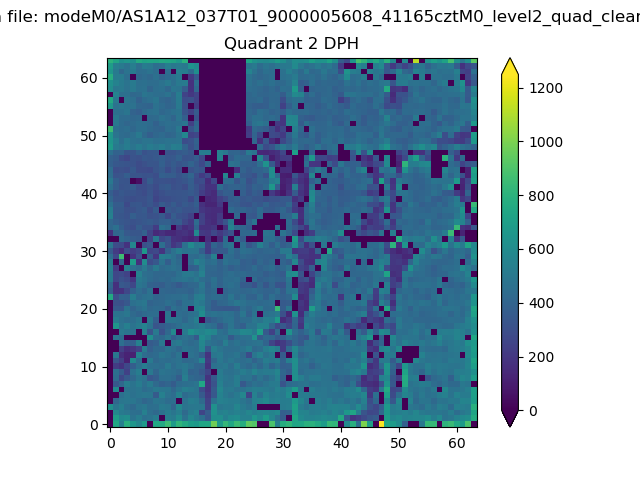 |
Quadrant C |
| Plot type | Count rate plots | Images |
|---|---|---|
| Comparison with Poisson distribution Blue bars denote a histogram of data divided into 1 sec bins. Red curve is a Poisson curve with rate = median count rate of data. |
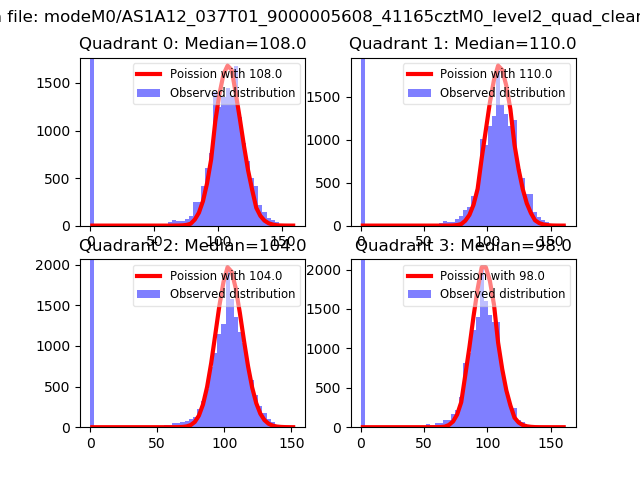 |
 |
| Quadrant-wise count rates Data is divided into 100 sec bins |
 |
|
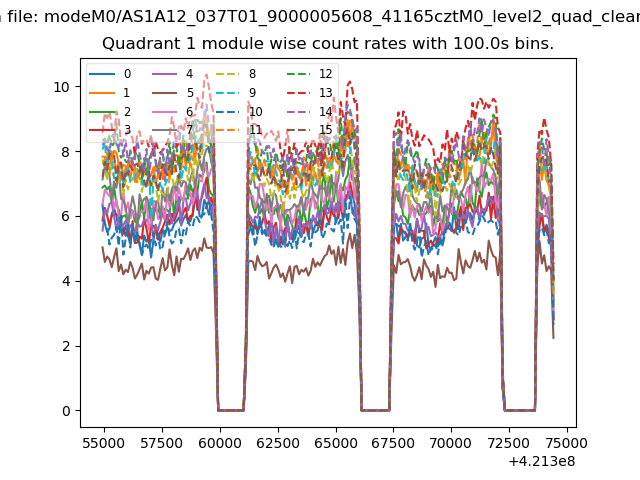
| Module-wise count rates for Quadrant A Data is divided into 100 sec bins |
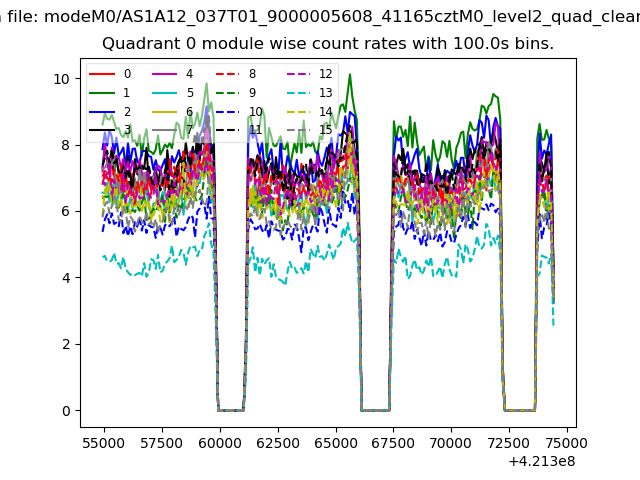 |
 |
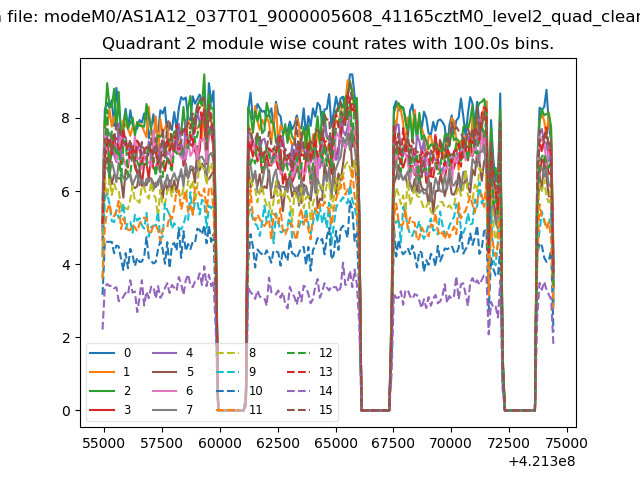
| Module-wise count rates for Quadrant B Data is divided into 100 sec bins |
 |
 |
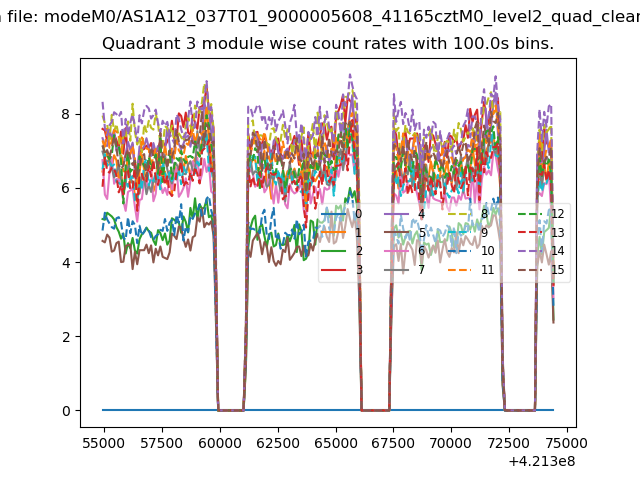
| Module-wise count rates for Quadrant C Data is divided into 100 sec bins |
 |
 |
| Module-wise count rates for Quadrant D Data is divided into 100 sec bins |
 |
 |
| Parameter | Plot |
|---|---|
| CZT HV Monitor | 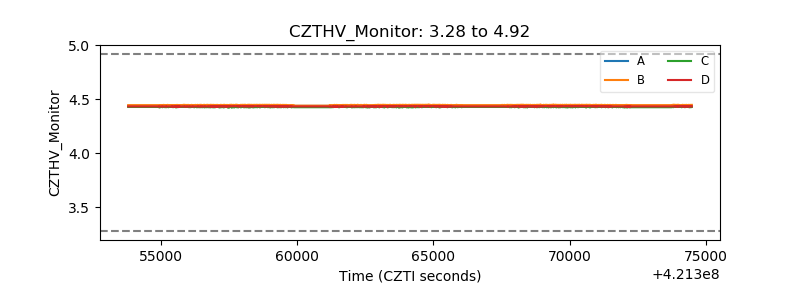 |
| D_VDD | 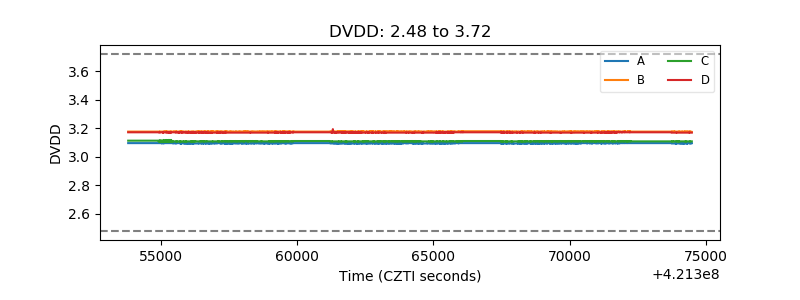 |
| Temperature 1 | 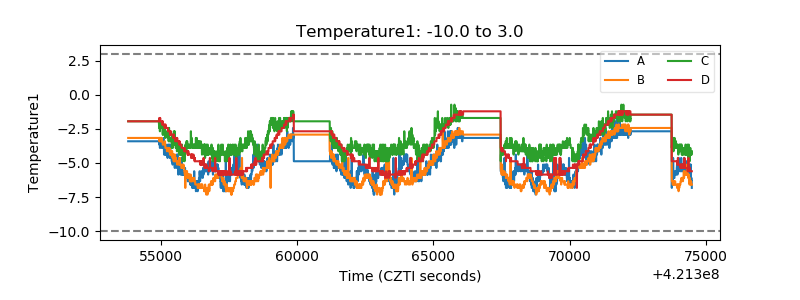 |
| Veto HV Monitor | 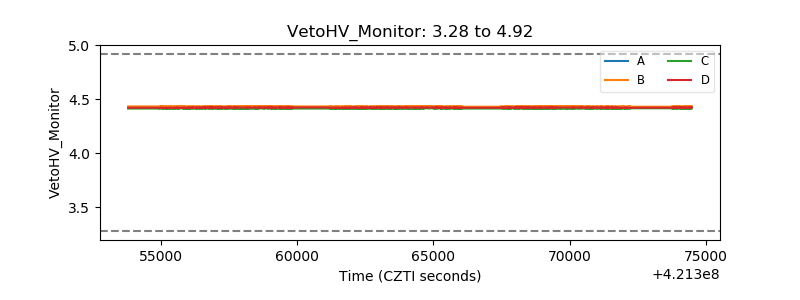 |
| Veto LLD | 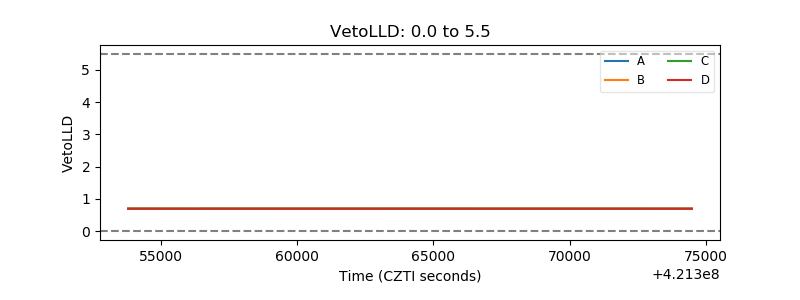 |
| Alpha Counter |  |
| _CPM_Rate |  |
| CZT Counter | 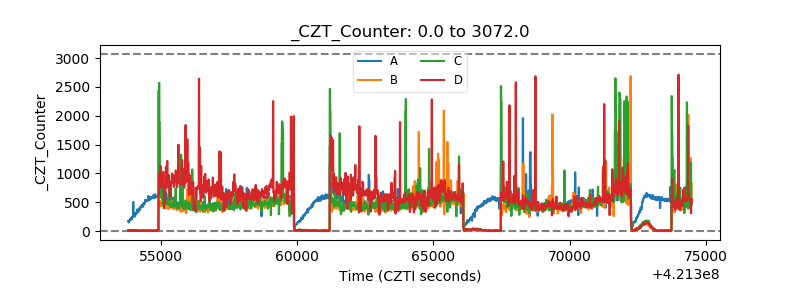 |
| +2.5 Volts monitor | 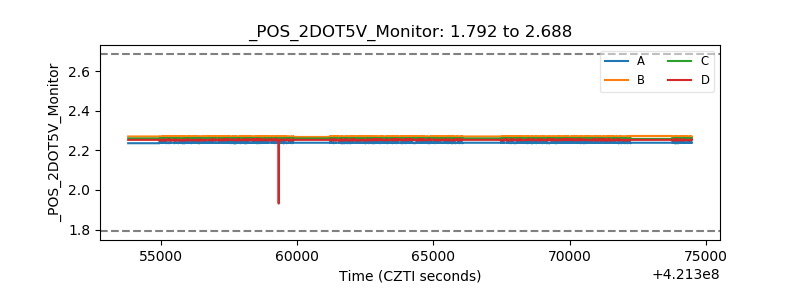 |
| +5 Volts monitor |  |
| _ROLL_ROT | 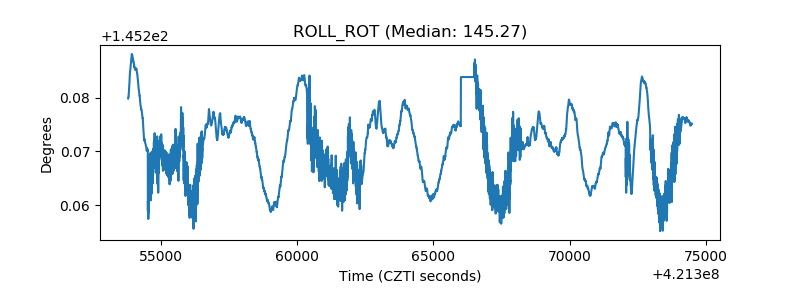 |
| _Roll_DEC | 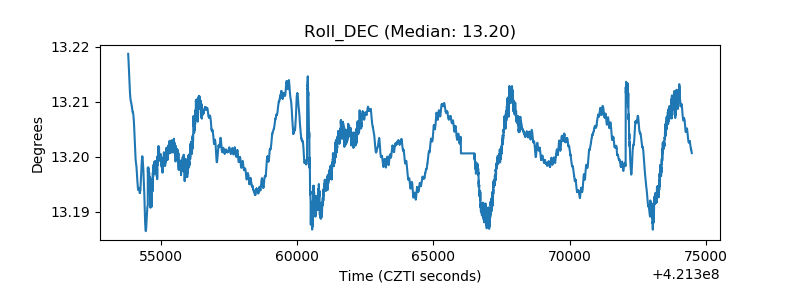 |
| _Roll_RA | 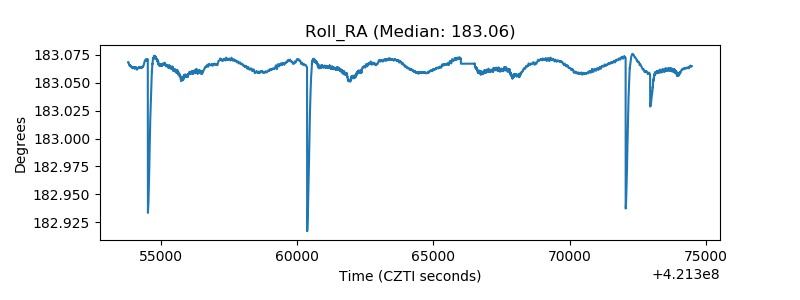 |
| Veto Counter |  |